Abstract
Circadian rhythms are endogenous cycles of approximately 24 hours reinforced by external cues such as light. These cycles are typically modeled as harmonic oscillators with fixed amplitude peaks. Using experimental data measuring global gene transcription in Neurospora crassa over 48 hours in the dark (i.e. with external queues removed), we demonstrate that many circadian genes frequently exhibit either damped harmonic oscillations, in which the peak amplitudes decrease each day, or driven harmonic oscillations, in which the peak amplitudes increase each day. By fitting extended harmonic oscillator models which include a damping ratio coefficient, we detected additional circadian genes that were not identified by the current standard tools that use fixed amplitude waves as reference, e.g. JTK_CYCLE. Functional Catalogue analysis confirms that our identified damped or driven genes exhibit distinct biological functions. The application of extended damped/driven harmonic oscillator models thus can elucidate, not only previously unidentified circadian genes, but also characterize gene subsets with expression patterns of biological relevance. Thus, expanded harmonic oscillators provide a powerful new tool for circadian system biology.
Keywords: Circadian Rhythm, Damped Harmonic Oscillator, Driven Harmonic Oscillator, Harmonic Oscillator, Gene Transcription
1. INTRODUCTION
Circadian oscillations are self-sustaining approximately 24-hour molecular rhythms that can be reset by environmental factors, such as light and temperature, yet persist even in the absence of these cues. Fungal and animal cells share circadian oscillators of conserved regulatory architecture: a transcription-translation based negative feedback loop where a heterodimeric transcription-factor complex, “the positive arm,” activates the transcription of a set of repressing proteins, “the negative arm” [2]. Circadian regulation of cellular functions stems from the influence of this molecular feedback loop. The current understanding of the mechanism underlying clock regulation over cellular functions is via transcriptional regulation, with the positive arm proteins regulating promoter activation of genes that do not encode proteins participating in the timekeeping loop itself, termed clock-controlled genes (ccgs).
Much of what is understood about the molecular circadian circuit comes from the clock model system Neurospora crassa, a bread mold whose well-defined clock shares a highly similar architecture with the mammalian circadian clock [8]. In Neurospora, the clock negative arm consists of the FRQ/FRH complex (FFC) and the positive arm consists of the WC-1 and WC-2 complex (WCC). The WCC binds to the frq promoter, initiating the transcription and translation of FRQ, which in turn forms the FFC. The FFC inhibits the activity of the WCC, decreasing frq expression. The resulting loss of the FFC releases the inhibition on the WCC, after which the cycle is reinitiated [5].
The circadian clock is a uniquely powerful regulator of gene expression and transcriptional regulation by the clock is evident for as many as 40% of genes in well-studied organisms [9]. While an understanding of direct clock control over cellular output is beginning to emerge, the networking of clock-controlled pathways to effect organismal physiology is poorly understood. What is known is that the consequences of chronically disrupting circadian regulation are severe. For example, chronic circadian disruption has been shown to lead to higher rates of cancer, diabetes, heart attack, and stroke in humans as well as in animal models [3]. To investigate the effects of circadian disruption, biologists often collect massive datasets quantifying temporal expression for tens of thousands of genes, transcripts, and proteins. Nowhere are these data sets as extensive as in Neurospora, for which multiple circadian transcriptomic data sets have been published [9, 16]. Importantly, Neurospora is also a model organism in the engineered overproduction of cellulases, which are enzymes essential for biofuel production [18]. Moreover, the production of cellulases is significantly influenced by the Neurospora circadian system, as circadian clocks coordinate cellular physiology for manys fungal cells [20]. Therefore, a better understanding of which elements of the cellulase secretion pathway fall under circadian control could enable the maximization of production through manipulation of the clock.
Computational tools have been developed for identifying circadian oscillations in these large gene expression datasets [7, 10]. However, when distinctly circadian oscillations deviate from a typical sinusoidal waveform, they can be missed by the fixed amplitude models that these currently available tools utilize. Thus, a more biologically realistic mathematical model, e.g. the one proposed in Section 3, which can account for damped or driven oscillations, is needed to more thoroughly identify and characterize circadianly expressed genes.
2. DETECTION OF CIRCADIAN RHYTHMS
JTK_CYCLE is the most widely used algorithm for distinguishing between circadian and non-circadian expression data [7]. JTK_CYCLE uses the Jonckheere-Terpstra-Kendall (JTK) algorithm, which employs Kendall’s τ rank correlation coefficent to determine how well the expression data match reference sinusoidal waves for a range of user-defined period lengths and phases. JTK_CYCLE provides the period, phase, amplitude, and p-values of cycling expression data. JTK_CYCLE and a later variant eJTK_CYCLE, which allows for non-sinusoidal reference waveforms, all assume that the amplitudes of the daily peaks are uniform across the time period.
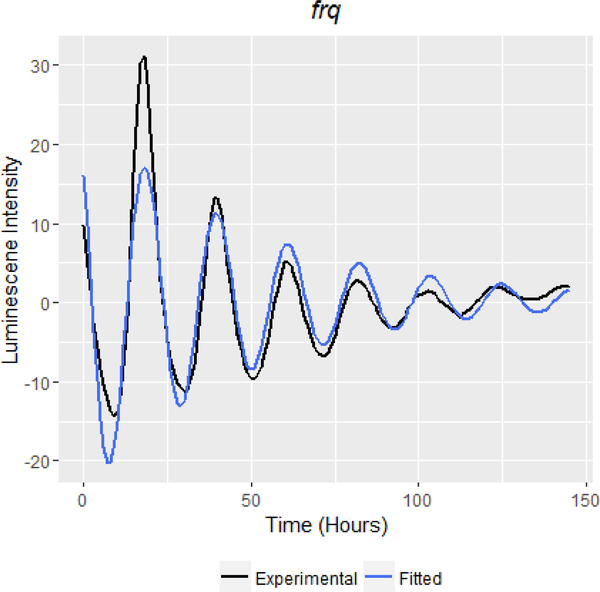
Recent experimental evidence, however, demonstrates that under certain growth conditions, circadian genes in Neurospora (and likely oscillating genes in many other systems cultured without reinforcing entrainment cues (e.g. [11])) have peaks that decrease in amplitude each day, a phenomena known as damping. In [9], the core clock gene frq (NCU02265) clearly displayed this damping phenomena. To further verify this expression pattern, we performed a standard luciferase assay (see Methods). The resulting time course distinctly showed that frq expression mimics a damped harmonic oscillator (Figure 1). Thus, we hypothesized that many circadian genes may exhibit oscillatory damping and that standard detection methods such as JTK_CYCLE that assume fixed amplitudes at best do not report these daily amplitude changes and at worst fail to detect these genes as rhythmic. To test this hypothesis, we developed a novel circadian rhythm detection method based on models of harmonic oscillators from physics that allow the amplitudes to be decreased (damped) or increased (driven) over time.
Figure 1:
High resolution detrended and scaled luceriferase data tracking the levels of the core clock protein frq over six days demonstrates the pattern of a damped harmonic oscillator. Experimental data (detrended and scaled) is represented with a black line while the fitted extended harmonic oscillator is represented with a blue line.
3. DRIVEN AND DAMPED HARMONIC OSCILLATORS
Below, we first review simple harmonic oscillators and then discuss how this basic model was extended to account for damped and driven genes.
The simple harmonic oscillator equation captures sinusoidal forms of varying amplitude and period, represented as follows:
| (1) |
where x (t) represents the corresponding change in amplitude, A is the amplitude at time 0, ω is the radial frequency, t is time, ø is the phase shift, and y is the equilibrium value. This model is used in physics to describe oscillations in the ideal mass-spring problem, though it clearly has applications to oscillations in circadian rhythms.
This equation, however, fails to capture both the decaying and amplifying nature of oscillations in reality, where the ideal mass-spring problem faces friction and external added forces, respectively. In order to capture this nature, the first equation is changed as follows:
| (2) |
where γ is the damping coefficient, and all other symbols retain their meaning from (1). This damping coefficient captures both driven and damped oscillations, with a positive value indicating damping and a negative value indicating driving. This equation is merely an extension of (1), as a damping coefficient value of 0 results in the simple harmonic oscillator.
4. METHODS
4.1. Oscillator Fitting Algorithms
Our method specifically fits the parameters of (2) by using nonlinear least squares. Given the experimental data points for each gene and parameters this function minimizes residuals in the following manner:
| (3) |
where n is the total number of data points and f (ti, β) represents the function for (2). A local solution is found using the nl2sol algorithm from the Port library, as implemented in nls function in R [13]. Problem (3) is nonconvex, so nls finds different local minima depending on the starting value. Thus, finding good starting values is necessary. The parameter starting values (denoted with subscript 0) are determined by prior knowledge and use of experimental values in the following manner:
| (4) |
| (5) |
| (6) |
ø0 is determined by partitioning the possible phase shift range into 12 pieces: for for Using the other estimated starting values and this value of at time points 2 and 3 (hour 4 and hour 6 as discussed below) are calculated using (2). Should the absolute value of the difference between these calculated values and the experimental values at those time points both be less than .1, the value of ø0 at i is selected. The last i that satisfies this criteria is chosen.
The supports for (4), which are the vector of peaks within the experimental data and δ, the logarithmic decrement, are determined by the following:
for number of peaks
where i is the time point, k is the number of the peak, n is the number of time points in the series, and t + T is the value at the next time point (in this case, time point 2).
We now consider our parameter choices. For (4), the logarithmic decrement δ estimates the amount of damping between two peaks. This method of estimation does not hold true for estimating γ in driven oscillators, and thus γ is set to a starting value of -s01 if the peak heights are non-decreasing.
The circadian period of Neurospora crassa [17] has been measured to be 22.5 hours. Thus we chose 22.5 hours for the starting value to determine circadian rhythms. Within (5), 22.5 represents this estimated period of the oscillation represented in hours.
For the Neurospora data, we chose a value of 0 for the equilibrium value (6), since the data for each gene is normalized to have mean 0 and standard deviation 1 over the time course.
Due to machine accuracy and experimental variation, finding an exact value of 0 for γ is unlikely. Therefore, we determined the range of γ for an oscillator to be considered harmonic as (−.01, .01). Values of γ including and above .01 would be considered damped, while values including and below −.01 would be considered driven. We have also determined that a period in the range of [20,27) would be classified as circadian in order to be compatible with JTK_CYCLE. In the results section, we suggest alternative strategies for determining circadian rhythms that can exploit additional model parameters.
After the fitted parameters are determined by nls, we determine p-values for these fits using Kendall’s τ rank correlation coefficient, which measures the concordance between two series of data. This is the same statistical test used in JTK_CYCLE. In this case, we seek to compare the fitted values, with the experimental data, Here n is the number of time points in the series. This is done using the following equation [7] [10]:
| (7) |
where sgn(x) is equal to 1 if x is positive and equal to −1 if x is negative. The numerator represents the number of pairs that vary concordantly minus the pairs that vary discordantly. The denominator represents the number of different pairs between the fitted values and experimental values, which allows τ to be normalized between −1 and 1. The distribution for the Kendall rank coefficient can be calculated explicitly for small samples. However, for larger samples, this can be approximated by the normal distribution, allowing for a simple p-value calculation. P-values were adjusted for multiple hypothesis testing using the Benjamini-Hochburg procedure. We used a .05 cutoff to determine significance.
For a baseline, we ran the JTK_CYCLE R script on the same data set. This run of JTK_CYCLE looked for periods between 20 and 26. To correct for multiple hypothesis testing, the output p-values were modified with the Benjamini-Hochburg procedure and significance was determined with an equivalent .05 cutoff.
4.2. Neurospora Time Course Data
We gathered data for this analysis from previous work investigating the extent to which the clock controls transcript levels in Neurospora [9]. For this publication, Neurospora was grown in constant dark conditions (DD) and triplicate time courses were run. During each time course, RNA was extracted from individual Neurospora cultures every 2 h over a period of 48 h. The extracted RNA from each sample was used to prepare Illumina libraries using standard protocols and the resultant libraries were subjected to Illumina high-throughput sequencing. The raw data were then normalized to fragments per kilobase of exon model per million mapped reads (FPKM) values [9]. A total of 9728 detected genes were detected using this analysis method. For our work, each gene was normalized to have mean 0 and standard deviation 1 over the time course and then each gene was analyzed using the methods described above.
To demonstrate the damped nature of oscillatory rhythms, we tracked the expression level of the core clock gene frq using a standard Luciferase tracking assay. This assay was preformed and analyzed as described previously using strain X661–5a, in which the promoter of frq was fused to the codon optimized firefly luciferase gene [9]. In this way, luminescence levels represent the level of frq expression and therefore the phase of the clock. Due to the nature of the experiment, the data displayed a downwards linear trend over the six days. As such, the data was “detrended” by fitting a linear trend to the data by the method of linear least squares, which minimizes the squared residuals between the fitted data and the experimental data. This resulted in the intercept (a) and coefficient corresponding to the downwards trend over time (b) and was used to obtain the detrended results in the following manner:
where x(t) is the original value, t is the time point, and n is the total amount of time points. Detrending effectively makes the equilibrium value of the harmonic oscillator a constant. While we do see suspected drifts in the 48-hour RNA data, these shifts are relatively small. Thus we do not model equilibrium drift on any of the results for the 48-hour RNA data presented here.
5. RESULTS
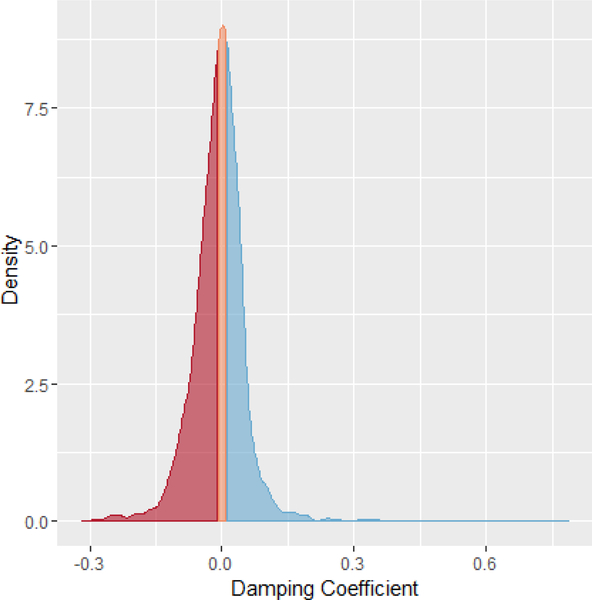
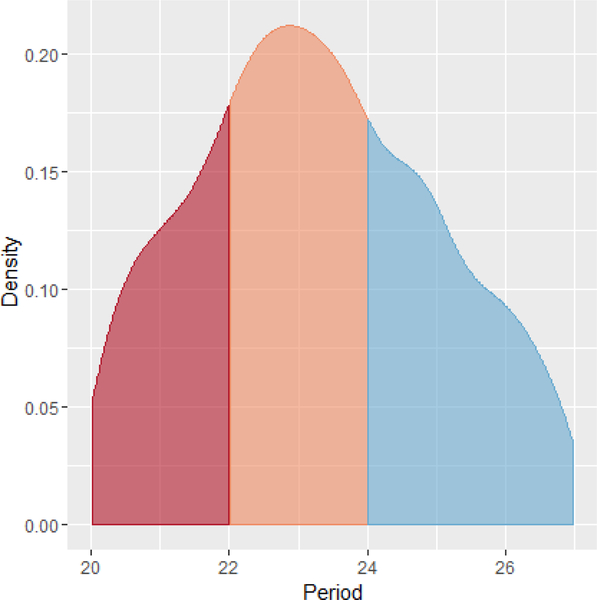
Upon fitting each of the genes detected in the above described data set to (2), we found that 1819 genes of 9728 detected genes were considered to be significantly rhythmic, as compared the 994 given by JTK_CYCLE. 1624 of those genes were unique to the extended harmonic oscillator, indicating that JTK_CYCLE may have missed a large portion of genes by not accounting for damping or driving. Of these 1624 unique genes, 751 were driven, 587 were damped, and 286 were harmonic. This distribution of driven, damped, and harmonic genes is reflected in Figure 2. Periods of these genes were distributed such that the highest densities fell between 22 and 24, as expected from the known circadian period of Neurospora (Figure 3) [17].
Figure 2:
Density graph of the damping coecients assigned to genes that were considered to be significantly rhythmic at a p-value less than .05. The left shaded region corresponds to driven genes (red), the middle to harmonic genes (orange), and the right to damped genes (blue). While the harmonic genes are well-represented in the dataset, it is the genes that display either damped or driven oscillations that dominate the circadian genes.
Figure 3:
Density graph of periods considered to be significantly rhythmic at the p-value .05. The left shaded region corresponds to ultradian genes (red), the middle to circadian genes (orange), and the right to infradian genes (blue). The highest density of periods falls within the 22 to 24 hour window.
To determine the biological functions of the genes we considered to be damped or driven, Functional Catalogue (FunCat) analysis was completed using the program FungiFun2 [12]. FunCat is a hierarchical category scheme to assign gene protein products to one or more functional annotations [15]. At the first level in the hierarchal description of each gene is a primary category function, e.g. metabolism or protein synthesis. Each primary category then contains second-level, third-level, etc. categories that further describe increasingly specific functional groups for a gene. Enrichment scores for categories represented in a dataset are then calculated by FungiFun2 as p-values considering the total number of genes possible for a category.
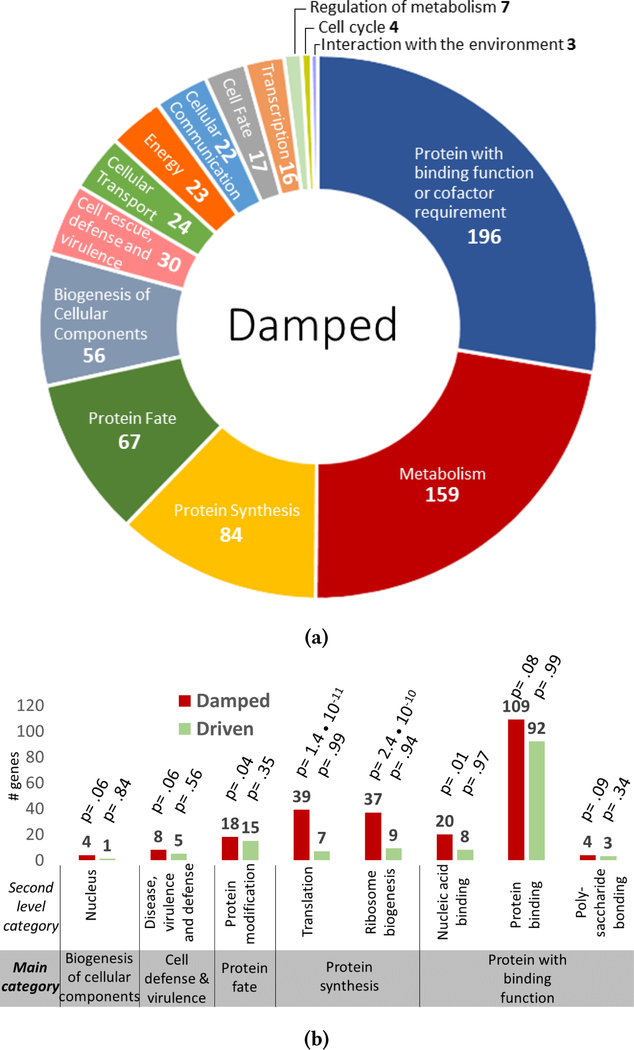
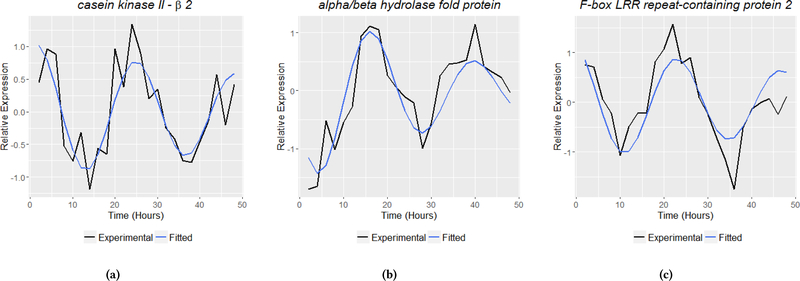
FunCat analysis of the 587 genes considered to be damped (γ > 0.01) identified a total of 14 primary categories (Figure 4a). Most numerous in this dataset are genes with protein binding function, followed by metabolic and protein synthetic genes. Second-level category enrichment reveals that genes involved in protein translation and ribosome biogenesis are the most statistically overrepresented categories in the damped gene dataset (Figure 4b). Among these damped genes is ckβ2 (Figure 5a, (γ = 0.02)), a subunit of casein kinase II, which is a kinase demonstrated to be an essential component of clock function and output [21]. Another damped gene identified, F-box LRR repeat-containing protein 2 (Figure 5c, (γ = .03)), is of interest as F-box proteins have been implicated in clock function as a primary mechanism for the temporal degradation of core clock proteins [6]. Finally a third damped gene, alpha/beta hydrolase protein (Figure 5b, (γ = .05)), is characterized as a secondary metabolism gene product predicted to be involved in the breakdown of aromatic compounds [4].
Figure 4:
4a: Primary functional categories of genes from the damped subset. Each color represents a distinct functional main category in the FunCat analysis with the name of the category labeled. The number of genes associated with each category from the damped subset is provided after the category name. 4b: Enriched second-level FunCat categories in the damped subset includes protein synthesis and proteins with binding function. Bar graphs represent the total number of genes from the driven (green) and damped (red) datasets in the secondary categories that have a significant enrichment for damped genes. P-values associated with each category and dataset are reported.
Figure 5:
Examples of biologically relevant genes with damped harmonic oscillations missed under standard circadian analysis. Circadian proteins casein kinase II subunit β−2 (5a), alpha/beta hydrolase protein (5b), and F-box LRR repeat-containing protein 2 (5c) display a damped rhythm and are identified as rhythmic by the extended harmonic oscillator in this analysis but not by JTK_Cycle using identical statistical tests and significance. The figures provide both the experimental data (black) and the fitted models (blue).
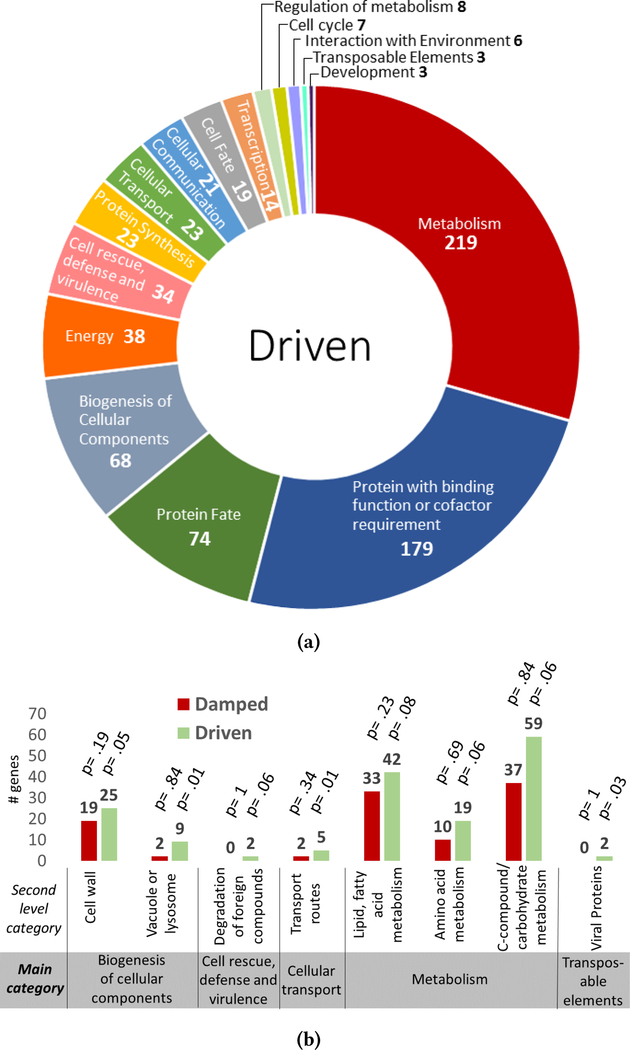
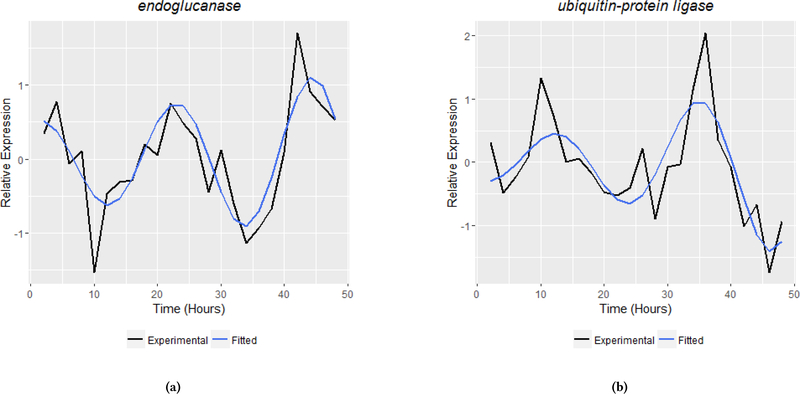
Of the 751 genes considered to be driven, FunCat analysis identified 16 primary categories that were represented in the dataset (Figure 6a). The most represented primary category was metabolism, followed by protein binding and protein fate. At the second-level, categories most enriched were vacuole biogenesis and several modes of metabolism, including fatty acid, carbohydrate and amino acid metabolism (Figure 6b). A particularly germane example of a driven gene with biological relevance is endoglucanase (Figure 7a, (γ = −.03)). endoglucanase is an enzyme necessary to the synergistic reactions that degrade biomass into compounds useful for industrial and biofuel applications [22]. Another driven gene of interest is ubiquitin-protein ligase (uce-17) (Figure 7b, (γ = −.04)), which functions primarily to target proteins for degradation by proteasomes [14, 22].
Figure 6:
6a: Functional categories of genes from the driven subset. Each color represents a distinct functional primary category in the FunCat analysis with the name of the category labeled. The number of genes associated with each category from the driven subset is provided after the category name. 6b: Enriched second-level FunCat categories in the driven subset includes metabolic and biogenesis-related categories. Bar graphs represent the total number of genes from the driven (green) and damped (red) datasets in the secondary categories that have a significant enrichment for driven genes. P-values associated with each category and dataset are reported.
Figure 7:
Examples of biologically relevant genes with driven harmonic oscillations missed under standard circadian analysis. Cellulase endoglucanase (7a) and degradation gene ubiquitin-protein ligase (7b) display a driven rhythm and are identified as rhythmic by the extended harmonic oscillator in this analysis but not by JTK_Cycle using identical statistical tests and significance. The figures provide both the experimental data (black) and the fitted models (blue).
6. DISCUSSION
The inclusion of a parameter to capture the change in amplitude over time enabled the identification of previously overlooked circadian genes; granting a more in-depth insight into clock regulation over organismal output. Oscillators of fixed amplitude are limited in their scope and thereby miss oscillting genes which may be crucial to the regulation of Neurospora crassa behavior over circadian time. This is evidenced by genes which are identified by our analysis as circadian which were overlooked by JTK_CYCLE’s algorithm; the genes identified in our data set, but not in JTK_CYCLE’s, were largely comprised of driven and damped oscillators (Figure 3). Therefore, the addition of a parameter which allows for changes in oscillatory amplitudes provided inclusiveness as compared to current circadian gene identification packages (i.e. those that look at simply harmonic oscillations).
Moreover, the inclusion of this parameter has extended the understanding of circadian regulation as it has identified a previously unknown class of biologically relevant circadian genes. This feature is demonstrated by the functional categories associated with the damped or driven oscillations that were not recognized by JTK_CYCLE, underscoring the importance of utilizing an algorithm that can identify damped/driven rhythmic genes. Most strikingly at the primary category level, genes associated with protein synthesis were well represented in the damped subset, whereas genes associated with metabolism were present in greater numbers in the driven subset (Figure 4a and Figure 6a). Among the specific categories most enriched in the damped genes were those involving ribosomes, the cellular machinery to make proteins. The damping of protein synthesis genes suggests that over the experimental time course, circadian-influenced pathways were triggered by media nutrient depletion to decelerate protein synthesis as a means of conserving metabolites and slowing growth (Figure 4b). Alternative methods of resource and energy conservation include the damping of genes with nonessential secondary metabolism functions, like the above referenced alpha/beta hydrolase protein (Figure 5b).
A more direct example of potential damping effects on the clock lies in the gene casein kinase II (ck2) subunit β−2 (Figure 5a). The damping of ck2 potentially represents a mechanism for not only the damping of genes under clock control, but the damping of the clock itself. The phosphorylating activities of ck2 and its temporal incorporation into the afternoon-evening clock protein complex are essential to clock function and output in Neurospora [21], If ck2 expression and activity are directly damped by nutrient-sensing pathways, this could feed into the clock and in turn effect many genes under circadian control, Additionally, the effects of ck2 damping could be widespread due to its additional phosphorylation targets which may alter cellular protein function, stability, and degradation.
f-box LRR repeat-containing protein 2 also presents a possible mechanism for overall clock damping (Figure 5c), F-box proteins are known to facilitate the degradation of negative arm clock proteins in preparation for subsequent cycles of the transcription-translation negative feedback loop [6]. One could envision that the damping of f-box LRR repeat-containing protein 2 may lead to more available negative arm protein causing increased inhibition of negative arm gene transcription, affecting clock gene expression with each oscillation.
Conversely, driven genes were most significantly composed of those categorized to aid in the breakdown and metabolism of sugars, lipids, and proteins or by the formation of lysosomes/vacuoles (Figure 6a). The circadian upregulation of metabolism genes may serve as an important survival mechanism to enhance pathways allowing the organism to be more resourceful; it may enable the metabolism of a more diverse array of intracellular substrates. The upregulation of the gene uce-17 is further evidence of driven circadian expression aiding metabolic resourcefulness in nutrient-restricted conditions (Figure 7b). uce-17 triggers degradation via the ubiquitin-proteasome pathway, potentially allowing the organism to recycle amino acids from existing proteins to generate proteins immediately essential to survival.
As an additional example of how driven genes may signify the organisms attempt to modify their environment to adapt to change, the well-documented cellulase gene, endoglucanase, was identified among the driven genes dataset (Figure 7a). This clock-driven regulation of a cellulase is of note as Neurospora is a commonly-used organism for components for ethanol biofuel production. Cellulases are enzymes that break down cellulose, the abundant starch giving structure to plant cell walls, into smaller sugars. They are produced by organisms like Neurospora as a means of digesting organic compounds into sugar metabolites and are utilized by bioengineers to ultimately produce fuels like ethanol from plant matter. endoglucanase cleaves the β-glycosidic bonds in cellulose to make the sugar chain accessible to other synergistic degradation enzymes [22]. Like many other genes important to metabolism, secretions of several cellulases are known to be circadian in Neurospora [16]. The driving of endoglucanase production suggests that pathways for cellulose degradation are circadianly amplified as the more easily metabolized compounds in the media are depleted, offering valuable information for implementing efficient biofuel production using Neurospora.
Our algorithm shows that to a great extent, genes that fall under circadianly regulation are damped or driven under artificial/experimental conditions. However, and surprisingly, the functions of circadianly damped and driven genes Neurospora are enriched in biologically germane processes, suggesting that damping/driving of circadian regulation may have biological relevance. Moreover, as we note that other circadian systems beyond fungal organisms display damping under artificial/experimental conditions and Neurospora has a molecular architecture that is conserved in mammalian clocks, this work argues that the damping/driving phenomena likely applies to clocks in higher eurkayotes. It is possible, perhaps probable, that the genes that can be damped or driven by the clock are linked to the diseases associated with chronic circadian rhythm disruption and therefore warrant study. The conserved cellular processes identified in our analyses (e.g. protein synthesis and carbon metabolism) further highlights the need for future research to better understand the mechanisms that regulate these processes and the influence that damping and driving can have on the circadian regulation of organismal behavior.
In summary, the preliminary biological results demonstrate that our development of a extended harmonic oscillator model is an important first step in the detection and analysis of damped and driven circadian genes. Moreover, this work demonstrates that state-of-the-art oscillating gene detection techniques are not always able to detect damped and driven genes, highlighting the need for the development of models that are able to identify these damping/driving rhythms. Thus, further studies with multiple synthetic and real datasets are underway to both optimize the detecting damped and driven oscillators as well as understand their importance in circadian regulation.
Our analysis revealed a few areas in which improvements should be made to further refine the harmonic oscillator model and the algorithm. For example, our current model assumes that the equilibrium value of the oscillators is constant. However, drifts downwards and or upwards have been noted in in vivo and in vitro datasets. While we followed the standard practice of “detrending” the luciferase data for frq (Figure 1) to remove a downward drift before circadian analysis, the model could be expanded to explicitly capture such drifts trends to further improve modeling of genes that exhibit potentially subtle upward or downward drifts (e.g Figure 7b). In addition, more robust algorithms could also further improve the results. For example, the underlying optimization problem (3) is non-convex and ill-conditioned; thus, the nls algorithm may get stuck in local minima or fail to converge.
We also observe that the definition of what constitutes a “circadian rhythm” under the proposed model should be further refined. As in the existing approach, JTK_CYCLE, we defined a gene as circadian if the period parameter is within the target range and the goodness of fit yields a significant p-value. The increased flexibility of the proposed model to account for damping or driving allows genes that are strongly damped or driven with very small oscillatory amplitudes (i.e. that exhibit roughly linear behavior) to be classified as circadian. Thus, the definition of “circadian” and the associated statistical tests should be refined to consider the damping coefficient and amplitude of the model as well.
Finally, we note that the presence of damped and driven harmonic oscillators, albeit under non-native conditions, indicates that a deeper understanding of the molecular mechanisms underlying circadian rhythms is needed. Prior investigations have lead to the creation of mathematical models that approximately represent the core mechanisms of the circadian clock; see for example [1, 19]. However, these models do not include a parameter to describe the damping of the core circadian oscillator under conditions without re-entraining cues. Our finding that this damping/driving phenomena may have biological relevance suggests that these models should be extended to incorporate this new aspect of the circadian clock. For example, one could utilize previously developed models of the molecular circadian clock to show that in the core clock, as well as in output, gene dynamics can be described by a dynamical equation corresponding to the damped harmonic oscillator equations. This modified model could provide insight into the molecular mechanism underlying circadian regulation. We leave this to future work.
7. CONCLUSION
Damped and driven harmonic oscillations diverge largely from simple harmonic oscillations, so much so that fixed amplitude detection methods cannot harness biologically relevant genes. The inclusion of the damping parameter, γ, within the simple harmonic oscillator equation provides an exponential decay or growth that explains the genes’ functions over time, allowing the identification of additional circadian genes. Moreover, the categorization of these damped and driven genes demonstrates an important biological relevance to each expression pattern. The presence of functional distinctions between damped or driven genes supports a model where as nutrients become scarce, circadian output is influenced via damping or driving mechanisms to adapt clock control over behavior to environmental conditions to maximize organismal fitness. Computational results demonstrate that the proposed extended harmonic oscillator identifies circadian genes missed by fixed amplitude approaches and suggest that extended harmonic oscillators represent a powerful new class of methods for circadian biology.
ACKNOWLEDGMENTS
This work is supported by the National Science Foundation (#1331023 to K. Bennett), a Rensselaer Polytechnic Institute Presidential Fellowship (to H. De los Santos), the National Institutes of Health/National Institute of Biomedical Imaging and Bioengineering (U01 EB022546 to J. Hurley) and an NIH T32 training grant (to E. Collins). We thank the Larrondo lab for their gift of the X661–5a strain. We thank the reviewers for their helpful suggestions.
Contributor Information
Hannah De los Santos, Rensselaer Polytechnic Institute Institute for Data Exploration and Applications/Department of Mathematical Sciences Troy, NY 12180.
Jennifer M. Hurley, Rensselaer Polytechnic Institute Department of Biological Sciences/Center for Biotechnology and Interdisciplinary Sciences Troy, NY 12180
Emily J. Collins, Rensselaer Polytechnic Institute Department of Biological Sciences/Center for Biotechnology and Interdisciplinary Sciences Troy, NY 12180
Kristin P. Bennett, Rensselaer Polytechnic Institute Institute for Data Exploration and Applications/Department of Mathematical Sciences Troy, NY 12180
REFERENCES
- [1].Dovzhenok Andrey A., Baek Mokryun, Lim Sookkyung, and Hong Christian I. 2015. Mathematical modeling and validation of glucose compensation of the neurospora circadian clock. Biophysical Journal 108, 7 (apr 2015), 1830–1839. DOI: 10.1016/j.bpj.2015.01.043 [DOI] [PMC free article] [PubMed] [Google Scholar]
- [2].Dunlap Jay C. 1999. Molecular bases for circadian clocks. Cell 96, 2 (1999), 271–290. [DOI] [PubMed] [Google Scholar]
- [3].Evans Jennifer A. and Davidson Alec J. 2013. Health consequences of circadian disruption in humans and animal models. Prog Mol Biol Transl Sci 119 (2013), 283–323. [DOI] [PubMed] [Google Scholar]
- [4].Frishman Dmitrij, Mokrejs Martin, Kosykh Denis, Kastenmller Gabi, Kolesov Grigory, Zubrzycki Igor, Gruber Christian, Geier Birgitta, Kaps Andreas, Albermann Kaj, Volz Andreas, Wagner Christian, Fellenberg Matthias, Heumann Klaus, and Mewes Hans-Werner. 2003. The PEDANT genome database. Nucleic Acids Research 31, 1 (2003), 207–211. [DOI] [PMC free article] [PubMed] [Google Scholar]
- [5].Fuller Kevin K., Hurley Jennifer M., Loros Jennifer J., and Dunlap Jay C. 2014. 6: Photobiology and Circadian Clocks in Neurospora. Springer Berlin Heidelberg, Berlin, Heidelberg, 121–148. DOI: 10.1007/978-3-642-45218-5_6 [DOI] [Google Scholar]
- [6].He Qun, Cheng Ping, Yang Yuhong, He Qiyang, Yu Hongtao, and Liu Yi. 2003. FWD1-mediated degradation of FREQUENCY in Neurospora establishes a conserved mechanism for circadian clock regulation. The EMBO Journal 22, 17 (2003), 4421–4430. [DOI] [PMC free article] [PubMed] [Google Scholar]
- [7].Hughes Michael E., Hogenesch John B., and Kornacker Karl. 2010. JTK_CYCLE: an efficient nonparametric algorithm for detecting rhythmic components in genome-scale data sets. Journal of Biological Rhythms 25, 5 (2010), 372–380. [DOI] [PMC free article] [PubMed] [Google Scholar]
- [8].Hurley Jennifer, Loros Jennifer J., and Dunlap Jay C. 2015. Chapter two-dissecting the mechanisms of the clock in Neurospora. Methods in Enzymology 551 (2015), 29–52. [DOI] [PMC free article] [PubMed] [Google Scholar]
- [9].Hurley Jennifer M., Dasgupta Arko, Emerson Jillian M., Zhou Xiaoying, Ringelberg Carol S., Knabe Nicole, Lipzen Anna M., Lindquist Erika A., Daum Christopher G., Barry Kerrie W., and others. 2014. Analysis of clock-regulated genes in Neurospora reveals widespread posttranscriptional control of metabolic potential. Proceedings of the National Academy of Sciences 111, 48 (2014), 16995–17002. [DOI] [PMC free article] [PubMed] [Google Scholar]
- [10].Hutchison Alan L., Maienschein-Cline Mark, Chiang Andrew H., SM Ali Tabei Herman Gudjonson, Bahroos Neil, Allada Ravi, and Dinner Aaron R. 2015. Improved statistical methods enable greater sensitivity in rhythm detection for genome-wide data. PLoS Comput Biol 11, 3 (2015), e1004094. [DOI] [PMC free article] [PubMed] [Google Scholar]
- [11].Keller Maren, Mazuch Jeannine, Abraham Ute, Eom Gina D., Herzog Erik D., Volk Hans-Dieter, Kramer Achim, and Maier Bert. 2009. A circadian clock in macrophages controls inflammatory immune responses. Proceedings of the National Academy of Sciences 106,50 (2009),21407–21412. [DOI] [PMC free article] [PubMed] [Google Scholar]
- [12].Priebe Steffen, Kreisel Christian, Horn Fabian, Guthke Reinhard, and Linde Jrg. 2015. FungiFun2: a comprehensive online resource for systematic analysis of gene lists from fungal species. Bioinformatics 31, 3 (feb 2015), 445–446. DOI: 10.1093/bioinformatics/btu627 [DOI] [PMC free article] [PubMed] [Google Scholar]
- [13].R Core Team. 2015. R: A Language and Environment for Statistical Computing. R Foundation for Statistical Computing, Vienna, Austria: https://www.R-project.org/ [Google Scholar]
- [14].Robinson Patrick A. and Ardley Helen C. 2004. Ubiquitin-protein ligases. Journal of Cell Science 117, 22 (2004). http://jcs.biologists.org/content/117/22/5191.short [DOI] [PubMed] [Google Scholar]
- [15].Ruepp Andreas, Zollner Alfred, Maier Dieter, Albermann Kaj, Hani Jean, Mokrejs Martin, Tetko Igor, Guldener Ulrich, Mannhaupt Gertrud, Munsterkotter Martin, and Mewes H Werner. 2004. The FunCat, a functional annotation scheme for systematic classification of proteins from whole genomes. Nucleic Acids Research 32, 18 (2004), 5539–45. DOI: 10.1093/nar/gkh894 [DOI] [PMC free article] [PubMed] [Google Scholar]
- [16].Sancar Cigdem, Sancar Gencer, Ha Nati, Cesbron François, and Brunner Michael. 2015. Dawn- and dusk-phased circadian transcription rhythms coordinate anabolic and catabolic functions in Neurospora. BMC Biology 13 (feb 2015), 17 DOI: 10.1186/s12915-015-0126-4 [DOI] [PMC free article] [PubMed] [Google Scholar]
- [17].Sargent Malcolm L., Briggs Winslow R., and Woodward Hughes Dow O.. 1966. Circadian Nature of a Rhythm Expressed by an Invertaseless Strain of Neurospora crassa. Plant Physiology 41, 8 (1966), 1343–1349. [DOI] [PMC free article] [PubMed] [Google Scholar]
- [18].Tian Chaoguang, Beeson William T., Iavarone Anthony T., Sun Jianping, Marletta Michael A., Cate Jamie HD, and Glass N. Louise. 2009. Systems analysis of plant cell wall degradation by the model filamentous fungus Neurospora crassa. Proceedings of the National Academy of Sciences 106, 52 (2009), 22157–22162. [DOI] [PMC free article] [PubMed] [Google Scholar]
- [19].Tseng Yu-Yao, Hunt Suzanne M., Heintzen Christian, Crosthwaite Susan K., and Schwartz Jean-Marc. 2012. Comprehensive Modelling of the Neurospora Circadian Clock and Its Temperature Compensation. PLOS Computational Biology 8,3 (03 2012), 1–13. DOI: 10.1371/journal.pcbi.1002437 [DOI] [PMC free article] [PubMed] [Google Scholar]
- [20].Vitalini Michael W., de Paula Renato M., Park William D., and Bell-Pedersen Deborah. 2006. The rhythms of life: circadian output pathways in Neurospora. Journal of Biological Rhythms 21, 6 (2006), 432–444. [DOI] [PubMed] [Google Scholar]
- [21].Yang Yuhong, Cheng Ping, and Liu Yi. 2002. Regulation of the Neurospora circadian clock by casein kinase II. Genes & Development 16, 8 (apr 2002), 994–1006. DOI: 10.1101/gad.965102 [DOI] [PMC free article] [PubMed] [Google Scholar]
- [22].Yennamalli Ragothaman M., Rader ndrewJ., Kenny Adam J., Wolt Jeffrey D., and Sen Taner Z. 2013. Endoglucanases: insights into thermostability for biofuel applications. Biotechnology for Biofuels 6, 1 (jan 2013), 136 DOI: 10.1186/1754-6834-6-136 [DOI] [PMC free article] [PubMed] [Google Scholar]


