

Abstract
Background
The Life-Space Assessment (LSA) has demonstrable validity and reliability among people sampled from nonclinical settings. Its properties in clinical settings, especially physical therapy services, are less well established.
Objective
The aim of this study was to test the construct/convergent validity, responsiveness, and floor/ceiling effects of the LSA among patients who had musculoskeletal, orthopedic, neurological, or general surgical presentations and were receiving individually tailored, community-based physical therapist interventions to address gait/balance impairments in an urban location in the United Kingdom.
Design
A prospective, repeated-measures, comparative cohort design was used.
Methods
Two hundred seventy-six community-dwelling, newly referred patients were recruited from three cohorts (outpatients; domiciliary, nonhospitalized; and domiciliary, recent hospital discharge). Data were collected from the LSA and the Performance-Oriented Mobility Assessment (POMA1) at initial assessment and discharge. Two hundred twenty-eight participants were retained at follow-up.
Results
The median age was 80.5 years, 73.6% were women, and the median number of physical therapist contacts over 53 days was five. LSA scores at assessment and changes over treatment distinguished between cohorts, even after adjustment for covariates. Weak correlations (0.14–0.41) were found between LSA and POMA1 scores. No LSA floor/ceiling effects were found. Significant improvements in the LSA score after the intervention were found for each cohort and for the sample overall. For the whole sample, the mean change in the LSA score was 10.5 points (95% CI = 8.3–12.8).
Limitations
The environmental demands participants faced were not measured. Caregivers answered the LSA questions on behalf of participants when necessary. Assessors were not always masked with regard to the measurement point.
Conclusions
The LSA has utility as an outcome measure in routine community-based physical therapist practice. It has satisfactory construct validity and is sensitive to change over a short time frame. The LSA is not a substitute for the POMA1; these measures complement each other, with the LSA bringing the added value of measuring real-life functional mobility.
Physical activity such as walking outdoors is an important health-protective factor,1 especially for older people.2 Reduced functional mobility is associated with depression,3–5 cognitive impairment,6,7 and shorter life expectancy.8,9
Patients referred to Edinburgh Community Physiotherapy Service are frequently elderly. Rehabilitation interventions addressing balance, gait, coordination, muscle strength, and indoor/outdoor mobility are commonly provided on an outpatient or domiciliary basis.
The identification of a valid and reliable measure of functional mobility, which is responsive to changes in mobility, both indoors and out, would enable physical therapists and other health care staff to measure meaningful clinical change and provide grounds for giving evidence-based feedback to patients regarding their progress in mobility.
The Panel on Prevention of Falls in Older Persons10 noted that the Performance-Oriented Mobility Assessment11 (POMA) is one of the most commonly used mobility measures. POMA assesses balance and gait in a controlled indoor environment and has been shown to be predictive of falls risk.12 The validity and reliability of the most frequently used version, POMA1, has been established for those with osteoarthritic knees13 and for people with Parkinson disease.14 Among samples of older adults, POMA1 has been shown to be responsive to intervention effects at the group level,15 especially among those with lower baseline scores.16 However, POMA1 scores might not correlate strongly with actual functional mobility.17 Factors beyond gait and balance, such as fear of falling when walking outdoors18 and the availability of resources, such as personal assistance, are likely to be important in this respect.
The Life-Space Assessment19 (LSA), a self-report measure, requires respondents to quantify how far and how often they have mobilized with or without assistance during the last 4 weeks. The items are repeated for each of the five “Life-Space Levels,” which represent increasing distances from the room in which the respondent sleeps (Appendix). Life-space has been described as the area in which a person moves purposefully in a specific time period.20 Although LSA is not a direct measure of factors such as fear of falling and the availability of resources, it is plausible that LSA scores of mobility will partly reflect these, and to a greater extent than would be reflected in POMA1 scores.
Based on its face validity, published psychometric properties, and apparent ease of administration, we tested the suitability of the LSA as a measure in routine clinical practice by conducting a preliminary pilot study of staff members’ experiences of administering the measure within our service.21 The LSA was found to be quick and easy to administer by both physical therapists and their assistants.
The LSA has been shown to be a valid and reliable instrument among people sampled from nonclinical settings across a range of cultures.3,7,22–32 Evidence for validity has been found in a small number of studies involving clinical groups33–41 where mean baseline LSA composite scores19 are often markedly lower than in other studies. Several studies provide evidence that floor/ceiling effects are absent or negligible,19,25,36,39,40 and there is no contrary evidence. There is evidence supporting the responsiveness of LSA to interventions likely to affect mobility, although the number of studies is small,41–45 and only three of these have used LSA as an outcome measure in the context of a physical therapy/exercise intervention.42–44 There are no studies of any kind using LSA that were conducted in the United Kingdom, where there is an unmet clinical need for health services, including physical therapy, that are publicly funded, free at point of need, and therefore accessible to the broad spectrum of the general population.
The aim of this study was to evaluate the validity and utility of the LSA during routine physical therapist treatment provided at home or in outpatient clinics in urban Scotland for patients with gait and balance problems secondary to a range of primary conditions. Specifically, the objective of this study was to evaluate the construct validity (differences between groups and convergent validity) and responsiveness over treatment.46 In the absence of a gold standard, the criterion validity of the LSA was not tested.
Methods
Setting and Participants
The domiciliary and outpatient services of Edinburgh Community Physiotherapy Service and West Lothian Domiciliary Physiotherapy Service were the settings for this study. Lothian NHS Board in Scotland, United Kingdom, is the publicly funded provider of these services. Participants were newly referred, consecutively assessed patients of these services. Patients were referred to the service by community-based general practitioners or allied health professionals and hospital-based medical, surgical, or allied health professionals. Patients were eligible if they were 16 years old or older, with an improvement in balance and/or gait identified as a primary rehabilitation goal by the patient and treating physical therapist. Participants’ primary conditions included musculoskeletal lower limb conditions and injuries, recent lower limb, pelvic, or lumbar vertebral fractures, lower limb joint replacements, recent general (abdominal) surgical interventions, and neurological conditions. Exclusion criteria were: having no potential to bear weight, being a nursing home resident, having a diagnosis of terminal illness, chronic lung disease, lymphedema, or cognitive impairment to a degree precluding capacity to consent. Clinical physical therapists in the services assessed new patients on their caseload for eligibility, provided study information, and carried out the informed consent procedure.
Design
A prospective, comparative cohort design was adopted. Between January 2016 and March 2017, participants were sampled from subpopulations of patients, defined by clinical presentation, to create three study cohorts for comparison purposes: outpatient (OP)—able to make their way independently to attend outpatient appointments; domiciliary, nonhospitalized (DNH)—treated at home with no hospital admission within the previous 4 weeks; and domiciliary, recent hospital discharge (DH)—treated at home after a recent discharge from hospital after having been an inpatient for a minimum of 3 of the previous 4 weeks.
Therapists and Interventions
Twenty professionally registered physical therapists provided supervised, individually tailored, graduated, goal-focused, home or clinic-based physical therapist interventions to primarily address balance and gait impairments and, when appropriate, outdoor mobilization, including confidence building, to enhance coping with environmental demands. Indoor exercises were based on the tests described in POMA1. Additional patient-specific progressive core strengthening, lower limb joint mobilization, and muscle-strengthening training exercises were performed predominantly while standing according to assessed need. Both indoor and outdoor exercises were tailored to suit each participant’s requirements in terms of type, intensity, duration, and provision of mobility aids and/or personal assistance. Participants were encouraged to incorporate their personalized advice and perform their prescribed exercise program on a daily basis. The details of the exercise programs were determined by the treating physical therapists on a case-by-case basis. The number of sessions provided was determined by attainment of agreed goals in each individual case. Initial assessment sessions were typically 45 minutes, with subsequent treatment sessions lasting 20 to 30 minutes.
Measures
The principal measures were the LSA and the POMA1. The LSA19 is a self-report measure of the frequency of independent mobility across five Life-Space Levels during the last 4 weeks (Appendix). Level 1 is defined as the area indoors from the bedroom into the rest of the home. Level 2 is the distance beyond the front door as far as the garden boundary or communal hallway. Level 3 is the local neighborhood, as defined by the respondent. Level 4 is the respondent’s town or city. Level 5 is the area beyond the town or city. Assistance to mobilize (from another person and/or by use of equipment), if required, is recorded at each level.
Permission was received from the developers to alter the terminology of some of the Life-Space Level descriptors and LSA instructions for cultural relevance in the United Kingdom.* For respondents living in rural environments the developers recommend using a distance of up to ~ 0.8 km (0.5 mile) from the home as being equivalent to level 3, up to ~16 km (10 miles) as being equivalent to level 4, and ~16 km or more (10 miles or more) as being equivalent to level 5. Life-Space Level scores are summed to produce an LSA composite score with a possible range of 0 to 120. The LSA interview takes approximately 5 minutes to complete.
The LSA was administered by telephone by one of three researchers who were independent of the investigatory team, had no role in the clinical assessment or treatment of participants, and were not told about the study cohort membership of participants. Where a participant was unable to answer the telephone a caregiver was allowed to assist. To maintain masking, the researchers were trained to request that participants (and caregivers) did not reveal the identity of their treating physical therapist or the location of their treatment during the LSA interviews. Instances in which the researchers were unmasked with regard to cohort membership were recorded. Since the researchers were employed throughout the study and were aware of the study sequence of events, no attempt was made to mask them with regard to measurement time point.
There are several versions of the POMA.47 For this study we chose the most commonly used version: POMA1.17 This is an objective, clinician-completed measure of performance on a range of tasks allowing the assessment of balance (score range = 0–16) and gait (score range = 0–12) by the physical therapist. Balance and gait scores are summed to produce a total score (range = 0–28). POMA1 assessments take 10 to 15 minutes to complete and in this study were performed by the participant’s treating physical therapist.
The LSA and POMA1 score data recorded for analysis purposes were the total scores in each case (for the LSA, this was the LSA composite score19).
The treating physical therapists also provided demographic and treatment-related data including age, sex, postal code, main presenting problem, length of treatment, and number of treatment contacts. Postal codes were used to determine level of social deprivation by translation into residential area deprivation ranks defined by the Scottish Index of Multiple Deprivation (SIMD).48 SIMD combines seven measures of deprivation (employment, income, health, geographic access to services, crime, housing, and education, skills and training) into one index which provides a relative ranking of each geographical “data zone” in Scotland from 1 (most deprived) to 6505 (least deprived).
Measurement Points
Measures were administered twice. POMA1 was administered at the patient’s physical therapist assessment (T1) and discharge (T2) appointments as part of normal clinical practice. On receipt of signed informed consent after the initial assessment appointment, the researchers were instructed to conduct the first LSA interview as soon as possible thereafter. A similar triggering process for the second LSA interview was followed on confirmation that discharge from treatment had occurred.
Specific Hypotheses
Clinical experience indicated that the study cohorts would differ on average in predictable ways in terms of level of mobility at initial assessment and degree of improvement in mobility over treatment. Specifically, we hypothesized that at the initial assessment, the OP cohort would be more mobile than the DNH cohort, which would be more mobile than the DH cohort, as measured by the LSA, and that over treatment, the DH cohort would show more improvement in mobility than the DNH cohort, which would show more improvement than the OP cohort, as measured by the LSA.
In terms of convergent validity, because the LSA and the POMA1 appear to measure related but nonidentical constructs, we hypothesized that correlations between LSA and POMA1 scores at the initial assessment and between LSA and POMA1 score changes over treatment would be positive but moderate in size (0.3 < r < 0.6).
In terms of responsiveness, we hypothesized that there would be an improvement in the LSA score at discharge from physical therapy compared with the initial assessment within each cohort and the sample overall and that the lower limit of the 95% CI for the change scores would be > 0.
Sample Size
Statistical advice was to recruit 77 patients per study cohort, that is, 231 in total. With a two-group t test and a two-sided 5% significance level, this sample size would have 80% power to detect a true difference in the mean LSA score change after treatment of 10 points or greater between any two study cohorts, assuming that the common SD was 22. The SD used in this calculation was derived from our pilot data.21
Data Management and Analysis
The telephone researchers were responsible for all LSA data entry. An LSA scoring algorithm (in SPSS [IBM Corp, Armonk, NY, USA], with command syntax provided by the developers) that was used to calculate Life-Space Level scores and the total score was applied to the raw data by A.P.
Data analysis was conducted in a masked fashion with regard to study cohort membership, sex, and main presenting problem by R.A.P. using SPSS Statistics for Windows v21.0 (released in 2012; IBM Corp, Armonk, NY, USA). Analyses included all eligible participants who consented to take part in the LSA study provided that they recorded an LSA score at the initial assessment.
Participant characteristics were summarized overall and stratified by study cohort. Since most variables were not normally distributed, the participant characteristics were compared across cohorts using Kruskal-Wallis tests for continuous data and chi-squared tests for categorical data. To determine whether the LSA scores at the initial assessment were significantly different between the three cohorts, box plots were constructed and Kruskal-Wallis tests were used. On the basis of the observed validity of the analysis of variance assumptions, a parametric one-way analysis of variance was used to assess whether changes in the LSA scores over treatment were significantly different between the study cohorts, with box plots being used to enable visual comparison. Similarly, box plots and a one-way analysis of variance were used to compare groups with different main presenting problems. Means and 95% CIs for differences in the LSA scores at the initial assessment and differences in the changes in the LSA scores between cohorts were also calculated.
To investigate the convergent validity of the LSA score, Kendall tau correlation coefficients were calculated between LSA scores and POMA1 scores at the initial assessment. The method of Kendall tau correlation was chosen because our data had frequent occurrences of tied observations. This analysis was conducted both overall and stratified by cohort.
To evaluate responsiveness, mean differences and 95% CIs were calculated for the changes in the LSA scores after treatment within each cohort, with P values being calculated on the basis of a paired t test. Standardized response means (SRMs) for changes in the LSA and POMA1 scores after treatment were calculated for comparative purposes as the mean difference divided by the SD. To evaluate responsiveness in terms of the longitudinal validity of LSA, Kendall tau correlation coefficients were calculated between LSA and POMA1 score changes over treatment.
According to predefined criteria, floor and ceiling effects were assumed to have occurred if at least 10% of the participants recorded the minimum possible LSA score of 0 and at least 10% of the participants recorded the maximum possible LSA score of 120. These criteria were determined a priori before the start of data collection.
The number and percentage of unmasking events relating to the telephone researchers’ becoming aware of participant cohort membership were calculated both overall and within study cohorts.
Analysis was done by “complete cases,” assuming that any missing data were missing completely at random irrespective of participant characteristics. To assess the appropriateness of this assumption, we performed a missing data analysis involving fitting a multiple logistic regression model to a binary outcome, taking the value as 1 if a participant had at least 1 LSA or POMA1 score missing at T1 or T2 or taking the value as 0 otherwise. Participant age, sex, study cohort, and LSA score at the initial assessment had no missing data and so were all included as covariates in the model to investigate the probability of missing data varying by these characteristics.
The 5% level was adopted as the criterion for statistical significance unless stated otherwise.
Role of the Funding Source
This study was funded by the Edinburgh and Lothians Health Foundation (grant ref. no. 10–576); recipients were A. McCrone, A. Smith, J. Hooper, and A. Peters. The funder played no role in the design, conduct, or reporting of this study.
Results
Descriptive Statistics
Study recruitment and retention rates are shown in Figure 1. Reasons for withdrawal or loss to follow-up included nonresponse to calls, dropping out of treatment, illness/admission, death, or bereavement.
Figure 1.
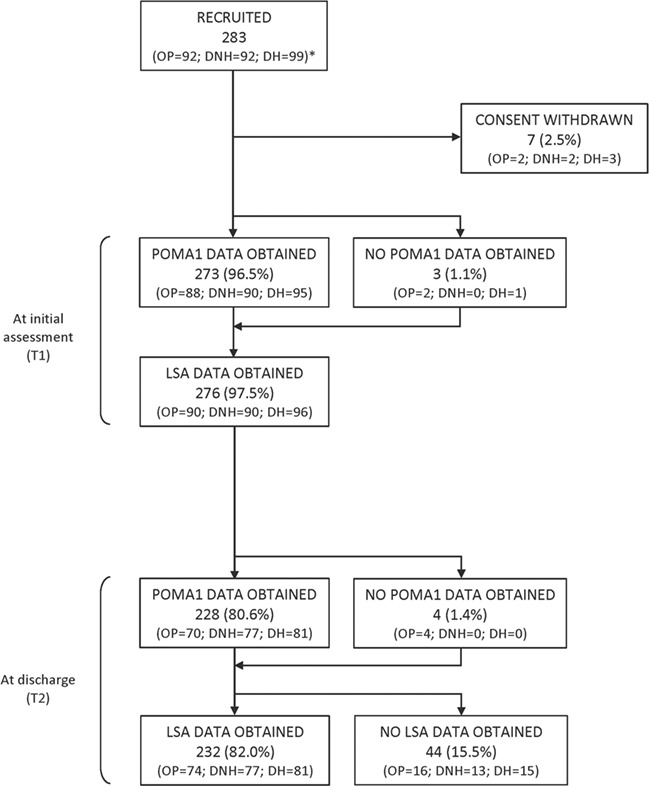
Participant flow diagram. *Cohorts: DH = domiciliary, recent hospital discharge; DNH = domiciliary, nonhospitalized; LSA = Life-Space Assessment; OP = outpatient; POMA1 = Performance-Oriented Mobility Assessment.
The demographic, clinical presentation, and treatment characteristics of the cohorts are described in Table 1. The cohorts did not differ significantly in terms of sex, socioeconomic deprivation, length of treatment, or number of physical therapist contacts. There was significant variation between cohorts both in age (P = .02) and the frequencies of main presenting problem (P < .001). The characteristics of the main presenting problem categories are described in Table 2. These categories differed significantly with respect to age only (P < .001), in that patients with neurological problems were younger on average than patients in the other categories.
Table 1.
Demographic, Clinical Presentation, and Treatment Characteristics of Participants Stratified by Cohort and Overalla
| Characteristic | Overall | Cohort | P b | ||
|---|---|---|---|---|---|
| OP | DNH | DH | |||
| No. of participants | 276 | 90 | 90 | 96 | |
| Sex, no. (%) | .81 | ||||
| Women | 203 (73.6) | 67 (74.4) | 64 (71.1) | 72 (75.0) | |
| Men | 73 (26.4) | 23 (25.6) | 26 (28.9) | 24 (25.0) | |
| Age (y) | .02 | ||||
| Median | 80.5 | 79 | 83.5 | 79.5 | |
| Range | 25–99 | 25–95 | 56–96 | 27–99 | |
| Scottish Index of Multiple Deprivation 2012 rankingc | .80 | ||||
| Median | 4348 | 4230 | 4628 | 4295 | |
| Range | 45–6492 | 241–6492 | 45–6492 | 184–6492 | |
| Main presenting problem,d no. (%) of participants | <.001 | ||||
| Musculoskeletal | 150 (54.3) | 62 (68.9) | 69 (76.7) | 19 (19.8) | |
| Orthopedic | 83 (30.1) | 1 (1.1) | 13 (14.4) | 69 (71.9) | |
| Neurological | 38 (13.8) | 27 (30.0) | 8 (8.9) | 3 (3.1) | |
| General surgical | 5 (1.8) | 0 | 0 | 5 (5.2) | |
| No. of physical therapist contacts | .09 | ||||
| Median | 5 | 6 | 5 | 5 | |
| Range | 1–14 | 2–10 | 1–12 | 1–14 | |
| Length of treatment (d) | .66 | ||||
| Median | 53 | 49 | 56 | 52.5 | |
| Range | 7–210 | 14–169 | 7–201 | 8–210 | |
aDH = domiciliary, recent hospital discharge; DNH = domiciliary, nonhospitalized; OP = outpatient.
bChi-square test P value for binary data and Kruskal-Wallis test P value for continuous data.
cRanking of small geographical areas of Scotland from 1 (most deprived) to 6505 (least deprived).
dGeneral surgical = recent abdominal surgery; musculoskeletal = conditions and injuries involving muscles, joints, or soft tissues of lower limbs but no recent fracture or joint replacement; neurological = stroke, multiple sclerosis, Parkinson disease, or myopathy; orthopedic = recent lower limb, pelvic, or lumbar vertebral fractures or surgical replacement of lower limb joints.
Table 2.
Demographic and Treatment Characteristics of Participants Stratified by Main Presenting Problem and Overalla
| Characteristic | Overall | Main Presenting Problem | P b | |||
|---|---|---|---|---|---|---|
| Musculoskeletal | Orthopedic | Neurological | General Surgical | |||
| No. of participants | 276 | 150 | 83 | 38 | 5 | |
| Sex | .10 | |||||
| Women | 203 (73.6) | 112 (74.7) | 65 (78.3) | 24 (63.2) | 2 (40) | |
| Men | 73 (26.4) | 38 (25.3) | 18 (21.7) | 14 (36.8) | 3 (60) | |
| Age (y) | <.001 | |||||
| Median | 80.5 | 84 | 79 | 66 | 73 | |
| Range | 25–99 | 54–96 | 50–93 | 25–99 | 66–79 | |
| Scottish Index of Multiple Deprivation 2012 rankingc | .98 | |||||
| Median | 4348 | 4359 | 4298 | 4652 | 3760 | |
| Range | 45–6492 | 45–6492 | 261–6492 | 241–6448 | 1324–6343 | |
| No. of physical therapist contacts | .77 | |||||
| Median | 5 | 6 | 5 | 5 | 4 | |
| Range | 1–14 | 1–14 | 1–13 | 2–11 | 2–7 | |
| Length of treatment (d) | .76 | |||||
| Median | 53 | 53.5 | 51 | 53 | 49 | |
| Range | 7–210 | 7–210 | 8–197 | 14–173 | 14–73 | |
aGeneral surgical = recent abdominal surgery; musculoskeletal = conditions and injuries involving muscles, joints, or soft tissues of lower limbs but no recent fracture or joint replacement; neurological = stroke, multiple sclerosis, Parkinson disease, or myopathy; orthopedic = recent lower limb, pelvic, or lumbar vertebral fractures or surgical replacement of lower limb joints.
bChi-squared test P value for binary data and Kruskal-Wallis test P value for continuous data.
cRanking of small geographical areas of Scotland from 1 (most deprived) to 6505 (least deprived).
Times Between Measures
The median time difference was 53 days between LSA measurements at T1 and T2 (range = 2–203) and also between POMA1 assessments at T1 and T2 (range = 7–210). These differences did not vary significantly across cohorts (P = .17 for LSA; P = .66 for POMA1). The median lags between POMA1 and LSA measurements were 7 (range = 0–84) days at T1 and 5 (range = 0–117) days at T2. These lags varied significantly between cohorts (P < .001 for both T1 and T2), with the median lag observed in the OP cohort on both occasions being 4 to 7 days greater than those observed in the other cohorts.
Construct Validity
Differences between cohorts
The hypothesized patterns of LSA scores at the initial assessment and the LSA score changes over treatment for the three cohorts were confirmed (ie, LSA scores at initial assessment in the relationship OP > DNH > DH and LSA score change over treatment in the relationship DH > DNH > OP) (Fig. 2). The corresponding descriptive statistics are shown in Table 3.
Figure 2.
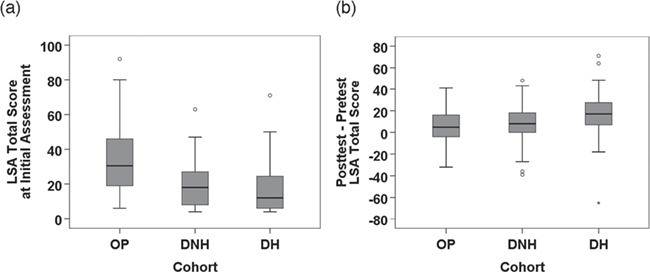
Box plots of Life-Space Assessment (LSA) score at assessment (a) and LSA score change over treatment (b) by cohort. DH = domiciliary, recent hospital discharge; DNH = domiciliary, nonhospitalized; OP = outpatient.
Table 3.
LSA Score at Initial Assessment and Change in LSA Score Over Treatment by Study Cohorta
| Parameter | Overall | Cohort b | P | ||
|---|---|---|---|---|---|
| OP | DNH | DH | |||
| LSA score at assessment | |||||
| No. | 276 | 90 | 90 | 96 | |
| Median | 20 | 30.5 | 18 | 12 | <.001c |
| Range | 4–92 | 6–92 | 4–63 | 4–71 | |
| Change in LSA score over treatment | |||||
| No. | 232 | 74 | 77 | 81 | |
| Mean | 10.5 | 5.2 | 8.8 | 17.0 | <.001d |
| SD | 17.5 | 15.3 | 16.0 | 18.9 | |
aLSA = Life-Space Assessment.
bDH = domiciliary, recent hospital discharge; DNH = domiciliary, nonhospitalized; OP = outpatient.
cKruskal-Wallis test.
dAnalysis of variance.
There was significant variation between cohorts in LSA score at assessment (P < .001). Further analysis showed significant mean differences in LSA score at assessment between the OP and DNH cohorts of 14.1 (95% CI = 9.2 to 19.0) points and between the OP and DH cohorts of 17.3 (95% CI = 12.6 to 22.1) points but not between the DNH and DH cohorts (3.3 [95% CI = −0.4 to 6.9] points). These patterns of differences in LSA score between cohorts were, with 1 exception, confirmed by multiple linear regression analysis adjusting for possible confounding variables (see Supplementary Analysis available at https://academic.oup.com/ptj). The exception was that the DNH cohort had a significantly higher initial LSA score than the DH group at the initial assessment (mean difference = 4.5 [95% CI = 0.2 to 8.7]; P = .04) in the multivariable analysis.
Similarly, there was significant variation between cohorts in LSA score change over treatment (P < .001). Mean difference analyses indicated significantly greater improvements in the DH cohort than in the OP (11.8 [95% CI = 6.3 to 17.3] points) and DNH (8.1 [95% CI = 2.6 to 13.7] points) cohorts but no significant difference between the DNH and OP cohorts (3.6 [95% CI = −1.4 to 8.7] points). These patterns of differences in LSA change scores between cohorts were confirmed in multiple linear regression analysis adjusting for possible confounding variables (see Supplementary Analysis).
Differences between main presenting problems
Analyses of LSA outcomes by main presenting problem category are described in the Supplementary Analysis. Overall, these analyses show that both LSA score at initial assessment and LSA score change over treatment distinguished between the main presenting problem categories, particularly between patients with musculoskeletal, orthopedic, or neurological presentations. Statistically and clinically significant improvements in LSA score over treatment were found for the musculoskeletal and orthopedic categories but not for the neurological and general surgical categories (although the latter was a very small group comprising five patients).
Convergent validity
Relatively weak, positive correlations (Kendall tau-b = 0.21–0.41) for the sample as a whole and within each cohort were observed between the LSA and POMA1 scores at the initial assessment (Tab. 4). These correlations were in the direction hypothesized, if somewhat weaker than expected in most instances.
Table 4.
Correlations Between LSA Score and POMA1 Score at Initial Assessment and LSA Change Score and POMA1 Change Score Over Treatmenta
| Parameter | Overall | Cohort b | ||
|---|---|---|---|---|
| OP | DNH | DH | ||
| LSA score and POMA1 score at assessment | ||||
| No. | 273 | 88 | 90 | 95 |
| Kendall tau-b | 0.37 | 0.41 | 0.21 | 0.33 |
| P | <.001 | <.001 | .01 | <.001 |
| LSA change score and POMA1 change score over treatment | ||||
| No. | 228 | 70 | 77 | 81 |
| Kendall tau-b | 0.27 | 0.14 | 0.15 | 0.32 |
| P | <.001 | .11 | .07 | <.001 |
aLSA = Life-Space Assessment; POMA1 = Performance-Oriented Mobility Assessment.
bDH = domiciliary, recent hospital discharge; DNH = domiciliary, nonhospitalized; OP = outpatient.
Responsiveness
Changes after treatment
Statistically and clinically significant improvements in the LSA score after treatment were found for each of the cohorts and the sample overall. For the whole sample (experiencing a median of five physical therapist contacts over a median of 53 days), the mean change in LSA score was 10.5 points (95% CI = 8.3 to 12.8; SRM = 0.60; P < .001). This size of improvement equates to the difference between, for instance, having been previously housebound but mobile daily with a walking stick to now visiting the garden one to three times per week and the neighborhood once a fortnight using a stick. The mean change in the DH cohort was 17.0 points (95% CI = 12.8 to 21.2; SRM = 0.90; P < .001), that in the DNH cohort was 8.8 points (95% CI = 5.2 to 12.5; SRM = 0.55; P < .001), and that in the OP cohort was 5.2 points (95% CI = 1.8 to 8.7, SRM = 0.34; P = .005). This pattern of responses mirrors that of the SRMs of POMA1 score changes over treatment across cohorts, which were 1.52 (DH), 1.13 (DNH), and 1.00 (OP). These comparisons indicate that LSA is responsive but not to the same extent as POMA1 in this sample.
Longitudinal validity
Relatively weak, positive correlations (Kendall tau-b = 0.14–0.32) for the sample as a whole, and within each cohort, were observed between LSA and POMA1 score changes over treatment (Tab 4). Again, these correlations were in the direction hypothesized, if somewhat weaker than expected.
Floor and ceiling effects
No participant scored 0 or 120 on the LSA at either measurement point. Hence, there was no evidence of floor or ceiling effects.
Unmasking of Assessors
The researchers who conducted the LSA interviews reported becoming unmasked with regard to participant cohort membership on 19 of 276 occasions (6.9%) at T1 and 15 of 231 occasions (6.5%) at T2. The analyses of differences between cohorts on LSA score at assessment and change in LSA score over treatment, as well as the responsiveness analyses, were run again after exclusion of all instances of unmasking. Our conclusions were unchanged after exclusion of these cases.
Missing Data
A total of 228 participants (82.6%) had complete LSA and POMA1 score data, whereas 48 participants (17.4%) had at least one missing LSA or POMA1 score at T1 or T2. We found no statistically significant differences in participant age, sex, study cohort, or LSA score at the initial assessment between these two groups in a multiple logistic regression analysis. Therefore, we found insufficient evidence that the probability of missing data depends on participant characteristics or the study cohort, suggesting that the missing-completely-at-random assumption is reasonable.
Discussion
In this sample of patients receiving community physical therapy in the United Kingdom, we have found good evidence to support the construct validity of the LSA. The measure distinguished between three cohorts of patients (outpatients; domiciliary, nonhospitalized; and domiciliary, recent hospital discharge) on both score at assessment and change score over treatment comprising five contacts over 8 weeks on average. Five of six comparisons between pairs of cohorts in adjusted analyses showed statistically and clinically significant mean differences on these two outcomes. The directions of all of these differences confirmed our hypotheses based on clinical experience. Both LSA score at assessment and LSA change score distinguished between patients presenting with different primary problems, even though all shared the treatment goal of improvement in gait and/or balance. In terms of convergent validity we found that LSA and POMA1 scores established through assessments conducted, on average, approximately 1 week apart were positively correlated in most analyses, as hypothesized, but the associations were relatively weak and smaller than expected. It is likely that the correlation coefficients reported here are slight underestimates due to the median lags between POMA1 and LSA measurements ranging between 5 and 7 days. Notwithstanding this, the weak correlations support the hypothesis that although the two instruments measure something in common, they offer different measurement foci, and therefore cannot be used interchangeably. We also found good evidence for the responsiveness of the LSA as a measure of change in functional mobility over relatively short periods of physical therapy, for the sample as a whole, and within each of our cohorts. However, our analyses indicate that LSA is less responsive than POMA1 in this population, which supports the conclusion that the two measures are complementary but not interchangeable. This difference in responsiveness probably reflects that improvements on gait/balance tasks (measured by POMA1) are necessary but not always sufficient to lead to improvements in functional mobility behavior (measured by LSA). Further, we found no evidence of floor or ceiling effects constraining the sensitivity of the LSA to changes after treatment.
The key strengths of this study are the clinically grounded hypothesis testing approach, the use of independent assessors who were intended to be masked with regard to cohort membership, and, by virtue of its setting, its relevance to outcome measurement in routine physical therapist practice. One limitation is that we did not attempt to measure the actual environmental demands faced by participants (such as terrain and lighting) which may have differed systematically between cohorts. Another possible limitation is that we allowed caregivers to answer the LSA questions on behalf of participants where necessary. Caution in using this method has been advised due to limits on the accuracy of caregivers’ recall.49 However, in this study close relatives responded on behalf of only nine of the 276 participants (3%), so the effect of any bias was likely to be minimal. The time lag between LSA and POMA1 measurements was not consistent across study cohorts, which may have biased the construct validity analyses, although we adjusted for the time lag in regression analyses comparing study cohorts on the two main LSA outcomes. Use of the t test P value (which is primarily an indicator of statistical significance) as a measure of responsiveness could be regarded as a limitation, although we also reported the 95% CIs around the mean response to aid interpretation. Further, the SRM relies on the accuracy of sample-based estimates of the mean and standard deviation, and uncertainty regarding the true value will be greater in small subgroups. Finally, the assessors were not always masked with regard to measurement point, which may have introduced bias.
The need for further study of the clinical applications of LSA has been noted;28 this study enhances that small body of work, and is the first study of LSA in a United Kingdom setting. Our findings are consistent with those from the most robust clinical population studies in terms of the construct (difference between groups)35,41,44,45,50 and convergent26,33–36,38,39,44 validity, responsiveness over treatment,41,42,44,45 and absence of floor/ceiling effects36,39 of LSA. A particularly important feature of our findings is that they occurred in the context of a median baseline LSA score of 20, which is lower than any reported in the literature, and far below the range (≤ 52–56) that has been proposed28,33 as the “cutoff score” indicating mobility problems sufficient to hinder activities of daily living. In this context, our finding of statistically and clinically significant changes in LSA score over a relatively brief period of treatment is particularly noteworthy.
This study provides evidence of the construct validity and responsiveness of the LSA in routine community physical therapist practice among patients with very restricted functional mobility. We found that LSA scores are influenced by more than gait and balance problems; they may also reflect concepts such as confidence in mobilizing outdoors,18 social participation,51 and access to support resources. Hence, the LSA complements and brings added value to outcome measures commonly used by community physical therapists, such as the POMA1, by quantifying a person’s functional mobility around the home and in negotiating outdoor environmental demands. This is essential if an individual is to take part in social activities which, ultimately, impacts upon quality of life.28,30 Although the LSA is brief and straightforward to administer and its questions easily understood, its scoring procedures as they stand are likely to limit its use in routine practice. The requirement to apply an algorithm written in SPSS syntax to raw Life-Space Level scores to generate a total score is prohibitive; few clinical services are likely to have access to SPSS software. However, the logical operations expressed by the algorithm are relatively simple, and it is our belief that three enhancements to the scoring instructions (see our detailed suggestions in the eAppendix, available at https://academic.oup.com/ptj) would render the algorithm redundant and greatly increase the utility of the measure in routine practice. The evidence presented should encourage physical therapists, their assistants, and other health professionals and organizations providing rehabilitation/support programs for mobility in the community to consider adopting the LSA as one of their standard outcome measures.
Further research is required to evaluate the reliability, minimal detectable change, and minimal important clinical difference of the LSA among clinical populations with a variety of health conditions who receive physical therapist rehabilitation for gait and balance problems. This would further strengthen the case for adopting the LSA as an outcome measure in routine practice and controlled evaluations of community physical therapist interventions. Other professions (eg, podiatry, occupational therapy) and rehabilitation services which aim to help people to regain or maintain functional mobility could also use the LSA to evaluate their interventions effectively. Finally, we are in agreement with the recommendation of Wijlhuizen et al52 that, since older people are known to compensate for their fear of outdoor falls by changing their level of physical activity, outcome measures in falls research should include a measure of outdoor mobility; the evidence indicates that LSA is a good candidate for this.
Author Contributions and Acknowledgments
Concept/idea/research design: A. Smith, A. McCrone, A. Peters, J. Hooper
Writing: A. Smith, A. McCrone, A. Peters, J. Hooper, R.A. Parker
Data collection: A. Smith, A. McCrone
Data analysis: R.A. Parker
Project management: A. Smith, A. McCrone, A. Peters, J. Hooper
Fund procurement: A. Smith, A. McCrone, A. Peters
Providing participants: A. Smith, A. McCrone, J. Hooper
Providing facilities/equipment: A. Smith, A. McCrone
Clerical/secretarial support: A. Smith, A. McCrone
Consultation (including review of manuscript before submitting): A. Smith, A. McCrone, R.A. Parker, J. Hooper, A. Peters
The authors are grateful to the funders, patients, caregivers, physical therapists, and service managers who made this study possible. Special thanks go to the telephone researchers: Sue Begg, Lesley Goodman, and Emma Dignan.
Ethics Approval
South-East Scotland Research Ethics Service confirmed that NHS ethical review under the terms of the Governance Arrangements for NHS Research Ethics Committees (A Harmonised Edition) was not required because the data to be obtained were part of usual patient care. NHS Lothian’s Quality Improvement Team assured compliance with data protection and other information governance aspects. This research was conducted in accordance with the Declaration of Helsinki.
Funding
This study was funded by the Edinburgh and Lothians Health Foundation (grant ref. no. 10–576); recipients were A. McCrone, A. Smith, J. Hooper, and A. Peters. R.A. Parker was supported by the National Health Service (NHS) Lothian via the Edinburgh Clinical Trials Unit. Support for the open access fee was provided by Edinburgh Clinical Trials Unit.
Disclosure
The authors completed the ICMJE Form for Disclosure of Potential Conflicts of Interest and reported no conflicts of interest. Anonymized data are available on request.
Supplementary Material
Appendix
| Life-Space Assessmenta | ||||||||
|---|---|---|---|---|---|---|---|---|
| UAB Study of Aging Life-Space Assessmentb | ||||||||
| Name: | Date: | |||||||
| These questions refer to your activities just within the past month. | ||||||||
| LIFE-SPACE LEVEL | FREQUENCY | INDEPENDENCE | SCORE | |||||
| During the past four weeks, have you been to . . . | How often did you get there? | Did you use aids or equipment? Did you need help from another person? | Level X Frequency X Independence | |||||
| Life-Space Level 1.. .Other rooms of your home besides the room where you sleep? | Yes 1 | No 0 | Less than 1/week 1 | 1–3 times/week 2 | 4–6 times/week 3 | Daily 4 | 1 = personal assistance 1.5 = equipment only 2 = no equipment or personal assistance | |
| Score | _________________ × ________________ × _____________ = | ____________ Level 1 Score | ||||||
| Life-Space Level 2.. . An area outside your home such as your porch, deck or patio, hallway (of an apartment building), or garage, in your own yard or driveway? | Yes 2 | No 0 | Less than 1/week 1 | 1–3 times/week 2 | 4–6 times/week 3 | Daily 4 | 1 = personal assistance 1.5 = equipment only 2 = no equipment or personal assistance | |
| Score | _________________ × ________________ × _____________ = | ____________ Level 2 Score | ||||||
| Life-Space Level 3.. . Places in your neighborhood, other than your own yard or apartment building? | Yes 3 | No 0 | Less than 1/week 1 | 1–3 times/week 2 | 4–6 times/week 3 | Daily 4 | 1 = personal assistance 1.5 = equipment only 2 = no equipment or personal assistance | |
| Score | _________________ × ________________ × _____________ = | ____________ Level 3 Score | ||||||
| Life-Space Level 4.. . Places outside your neighborhood, but within your town? | Yes 4 | No 0 | Less than 1/week 1 | 1–3 times/week 2 | 4–6 times/week 3 | Daily 4 | 1 = personal assistance 1.5 = equipment only 2 = no equipment or personal assistance | |
| Score | _________________ × ________________ × _____________ = | ____________ Level 4 Score | ||||||
| Life-Space Level 5.. . Places outside your town? | Yes 5 | No 0 | Less than 1/week 1 | 1–3 times/week 2 | 4–6 times/week 3 | Daily 4 | 1 = personal assistance 1.5 = equipment only 2 = no equipment or personal assistance | |
| Score | _________________ × ________________ × _____________ = | ____________ Level 5 Score | ||||||
| TOTAL SCORE (ADD) | ____________ Sum of Levels | |||||||
aReprinted with permission from Peel C, Sawyer Baker P, Roth DL, Brown CJ, Brodner EV, Allman RM. Assessing mobility in older adults: the UAB study of Aging Life-Space Assessment. Phys Ther. 2005;85:1008–1019.
bUAB = University of Alabama at Birmingham.
A. McCrone, MCSP, Physio@Home, National Health Service (NHS) Lothian, Edinburgh, United Kingdom
A. Smith, MCSP, Physio@Home, NHS Lothian, Allermuir Health Centre, 165 Colinton Mains Dr, Edinburgh, United Kingdom. Address all correspondence to Mrs Smith at: angela.x.smith@nhslothian.scot.nhs.uk
J. Hooper, PhD, Edinburgh Community Physiotherapy Service Outpatients, NHS Lothian
R.A. Parker, MSc, Edinburgh Clinical Trials Unit, University of Edinburgh, Edinburgh, United Kingdom
A. Peters, MPhil, Research and Development Office, NHS Lothian
Footnotes
After alteration, Life-Space 2 reads as “An area just outside your home such as your patio, garden path, driveway, garden or communal hallway outside your apartment”; Life-Space 3: “Places in your immediate neighbourhood beyond your own garden or apartment building”; Life-Space 4: “Places outside your immediate neighbourhood but within your town/city”; Life-Space 5: “Places outside your town/city.”
References
- 1. World Health Organization EUR/RC65/9 Physical activity strategy for the WHO European Region 2016-2025 2015. http://www.euro.who.int/__data/assets/pdf_file/0010/282961/65wd09e_PhysicalActivityStrategy_150474.pdf. Accessed May 30, 2019.
- 2. World Health Organization WHO global report on falls prevention in older age. 2007. http://www.who.int/ageing/publications/Falls_prevention7March.pdf. Accessed May 30, 2019.
- 3. Snih SA, Peek KM, Sawyer P, Markides KS, Allman RM, Ottenbacher KJ. Life-space mobility in Mexican Americans aged 75 and older. J Am Geriatr Soc. 2012;60:532–537. [DOI] [PMC free article] [PubMed] [Google Scholar]
- 4. Polku H, Mikkola TM, Portegijs E, et al. Life-space mobility and dimensions of depressive symptoms among community-dwelling older adults. Aging Ment Health. 2015;19:781–789. [DOI] [PubMed] [Google Scholar]
- 5. Wheeler TL, Illston JD, Markland AD, Goode PS, Richter HE. Life space assessment in older women undergoing non-surgical treatment for urinary incontinence. Open J Obstet Gynecol. 2014;4:809–816. [DOI] [PMC free article] [PubMed] [Google Scholar]
- 6. Sartori AC, Wadley VG, Clay OJ, Parisi JM, Rebok GW, Crowe M. The relationship between cognitive function and life-space: the potential role of personal control beliefs. Psychol Aging. 2012;27:364–374. [DOI] [PMC free article] [PubMed] [Google Scholar]
- 7. Curcio C, Alvarado BE, Gomez F, Guerra R, Guralnik J, Zunzunegui MV. Life-space assessment scale to assess mobility: validation in Latin American older women and men. Aging Clin Exp Res. 2013;25:553–560. [DOI] [PubMed] [Google Scholar]
- 8. Keeler E, Guralnik JM, Tian H, Wallace RB, Reuben DB. The impact of functional status on life expectancy in older persons. J Gerontol A Biol Sci Med Sci. 2010;65:727–733. [DOI] [PMC free article] [PubMed] [Google Scholar]
- 9. Landi F, Calvani R, Tosato M, et al. Impact of physical function impairment and multimorbidity on mortality among community-living older persons with sarcopaenia: results from the ilSIRENTE prospective cohort study. BMJ Open. 2016;6:e008281. [DOI] [PMC free article] [PubMed] [Google Scholar]
- 10. Panel on Prevention of Falls in Older Persons, American Geriatrics Society and British Geriatrics Society Summary of the updated American Geriatrics Society/British Geriatrics Society clinical practice guideline for prevention of falls in older persons. J Am Geriatr Soc. 2011;59:148–157. [DOI] [PubMed] [Google Scholar]
- 11. Tinetti ME, Speechley M, Ginter SF. Risk factors for falls among elderly persons living in the community. N Engl J Med. 1988;319:1701–1707. [DOI] [PubMed] [Google Scholar]
- 12. Kloos AD, Kegelmeyer DA, Young GS, Kostyk SK. Fall risk assessment using the Tinetti mobility test in individuals with Huntington's disease. Mov Disord. 2010;25:2838–2844. [DOI] [PubMed] [Google Scholar]
- 13. Parveen H, Noohu MM. Evaluation of psychometric properties of Tinetti performance-oriented mobility assessment scale in subjects with knee osteoarthritis. Hong Kong Physiother J. 2017;36:25–32. [DOI] [PMC free article] [PubMed] [Google Scholar]
- 14. Kegelmeyer DA, Kloos AD, Thomas KM, Kostyk SK. Reliability and validity of the Tinetti mobility test for individuals with Parkinson’s disease. Phys Ther. 2007;87:1369–1378. [DOI] [PubMed] [Google Scholar]
- 15. Faber MJ, Bosscher RJ, van Wieringen PCW. Clinimetric properties of the Performance-Oriented Mobility Assessment. Phys Ther. 2006;86:944–954. [PubMed] [Google Scholar]
- 16. Pardasaney PK, Latham NK, Jette AM, et al. Sensitivity to change and responsiveness of four balance measures for community-dwelling older adults. Phys Ther. 2012;92:388–397. [DOI] [PMC free article] [PubMed] [Google Scholar]
- 17. Tinetti ME, Williams FT, Mayewski R. Fall risk for elderly patients based on number of chronic disabilities. Am J Med. 1986;80:429–434. [DOI] [PubMed] [Google Scholar]
- 18. Auais M, Alvarado B, Guerra R, et al. Fear of falling and its association with life-space mobility of older adults: a cross-sectional analysis using data from five international sites. Age Ageing. 2017;46:459–465. [DOI] [PMC free article] [PubMed] [Google Scholar]
- 19. Baker PS, Bodner EV, Allman RM. Measuring life-space mobility in community-dwelling older adults. J Am Geriatr Soc. 2003;51:1610–1614. [DOI] [PubMed] [Google Scholar]
- 20. May D, Nayak US, Isaacs B. The life-space diary: a measure of mobility in old people at home. Int Rehabil Med. 1985;7:182–186. [DOI] [PubMed] [Google Scholar]
- 21. McCrone A, Smith A, Peters A, Hooper J. Preliminary pilot project to test the utility of the Life-Space Assessment as a measure of outdoor mobility in a community physiotherapy setting. Edinburgh Community Physiotherapy Service. 2013. [Google Scholar]
- 22. Peel C, Sawyer Baker P, Roth DL, Brown CJ, Brodner EV, Allman RM. Assessing mobility in older adults: the UAB study of aging Life-Space Assessment. Phys Ther. 2005;85:1008–1019. [PubMed] [Google Scholar]
- 23. Brown CJ, Roth DL, Allman RM, Sawyer P, Ritchie CS, Roseman JM. Trajectories of life-space mobility after hospitalization. Ann Intern Med. 2009;150:372–378. [DOI] [PMC free article] [PubMed] [Google Scholar]
- 24. Sheppard KD, Sawyer P, Ritchie CS, Allman RM, Brown CJ. Life-Space mobility predicts nursing home admission over 6 years. J Aging Health. 2013;25:907–920. [DOI] [PMC free article] [PubMed] [Google Scholar]
- 25. Portegijs E, Iwarsson S, Rantakokko M, Viljanen A, Rantanen T. Life-space mobility assessment in older people in Finland: measurement properties in winter and spring. BMC Res Notes. 2014;7:323. [DOI] [PMC free article] [PubMed] [Google Scholar]
- 26. Suzuki T, Kitaike T, Ikezaki S. Life-space mobility and social support in elderly adults with orthopaedic disorders. Int J Nurs Pract. 2014;20 (Suppl 1):32-38. [DOI] [PubMed] [Google Scholar]
- 27. Ji M, Zhou Y, Liao J, Feng F. Pilot study on the Chinese version of the Life Space Assessment among community-dwelling elderly. Arch Gerontol Geriatr. 2015;61:301–306. [DOI] [PubMed] [Google Scholar]
- 28. Portegijs E, Rantakokko M, Viljanen A, Sipila S, Rantanen T. Identification of older people at risk of ADL disability using the Life-Space Assessment: a longitudinal cohort study. J Am Med Dir Assoc. 2016;17:410–414. [DOI] [PubMed] [Google Scholar]
- 29. Portegijs E, Rantakokko M, Viljanen A, Sipila S, Rantanen T. Is frailty associated with life-space mobility and perceived autonomy in participation outdoors? A longitudinal study. Age Ageing. 2016;45:550–553. [DOI] [PubMed] [Google Scholar]
- 30. Rantakokko M, Portegijs E, Viljanen A, Iwarsson S, Kauppinen M, Rantanen T. Changes in life-space mobility and quality of life among community-dwelling older people: a 2-year follow-up study. Qual Life Res. 2016;25:1189–1197. [DOI] [PubMed] [Google Scholar]
- 31. Fristedt S, Kammerlind A, Bravell ME, Fransson EI. Concurrent validity of the Swedish version of the Life-Space Assessment questionnaire. BMC Geriatr. 2016;16:181. [DOI] [PMC free article] [PubMed] [Google Scholar]
- 32. Tsai LT, Portegijs E, Rantakokko M, et al. The association between objectively measured physical activity and life-space mobility among older people. Scand J Med Sci Sports. 2015;25:e368–e373. [DOI] [PubMed] [Google Scholar]
- 33. Shimada H, Sawyer P, Harada K, et al. Predictive validity of the classification schema for functional mobility tests in instrumental activities of daily living decline among older adults. Arch Phys Med Rehabil. 2010;91:241–246. [DOI] [PubMed] [Google Scholar]
- 34. Miller A, Clemson L, Lannin N. Measurement properties of a modified Reintegration to Normal Living Index in a community-dwelling adult rehabilitation population. Disabil Rehabil. 2011;33:1968–1978. [DOI] [PubMed] [Google Scholar]
- 35. Phillips JL, Lam L, Luckett T, Agar M, Currow D. Is the Life Space Assessment applicable to a palliative care population? Its relationship to measures of performance and quality of life. J Pain Symptom Manage. 2014;47:1121–1127. [DOI] [PubMed] [Google Scholar]
- 36. Lanzino D, Sander E, Mansch B, Jones A, Gill M, Hollman J. Life Space Assessment in spinal cord injury. Top Spinal Cord Inj Rehabil. 2016;22:173–182. [DOI] [PMC free article] [PubMed] [Google Scholar]
- 37. Fathi R, Bacchetti P, Haan MN, Houston TK, Patel K, Ritchie CS. Life-Space Assessment predicts hospital readmission in home-limited adults. J Am Geriatr Soc. 2017;65:1004–1011. [DOI] [PubMed] [Google Scholar]
- 38. Estima AEMS, Dutra BMT, Martins JVP, Frazoi ACOB. Validation of the “Life Space Assessment-LSA” questionnaire in a group of hemiplegic patients. Acta Fisiatr. 2015;22:1–4. [Google Scholar]
- 39. Simoes MSM, Garcia IF, Costa LC, Lunardi AC. Life-Space Assessment questionnaire: Novel measurement properties for Brazilian community-dwelling older adults. Geriatr Gerontol Int. 2018;18:783–789. [DOI] [PubMed] [Google Scholar]
- 40. Auger C, Demers L, Gelinas I, et al. Development of a French-Canadian version of the Life-Space Assessment (LSA-F): content validity, reliability and applicability for power mobility device users. Disabil Rehabil Assist Technol. 2009;4:31–41. [DOI] [PubMed] [Google Scholar]
- 41. Stewart CML. Wheeler TL2, Markland AD, Straughn JMJ, Richter HE. Life-Space Assessment in urogynecology and gynecological oncology surgery patients: a measure of perioperative mobility and function. J Am Geriatr Soc. 2009;57:2263–2268. [DOI] [PMC free article] [PubMed] [Google Scholar]
- 42. Fairhall N, Sherrington C, Kurrle SE, Lord SR, Lockwood K, Cameron ID. Effect of a multifactorial interdisciplinary intervention on mobility-related disability in frail older people: randomised controlled trial. BMC Med. 2012;10:120. [DOI] [PMC free article] [PubMed] [Google Scholar]
- 43. Matsuda K, Ikeda S, Nakahara M, et al. Factors affecting the coefficient of variation of stride time of the elderly without falling history: a prospective study. J Phys Ther Sci. 2015;27:1087–1090. [DOI] [PMC free article] [PubMed] [Google Scholar]
- 44. Ullrich P, Werner C, Bongartz M, Kiss R, Bauer J, Hauer K. Validation of a modified life-space assessment in multimorbid older persons with cognitive impairment. Gerontologist. 2019;59(2):e66–75. [DOI] [PubMed] [Google Scholar]
- 45. Saitoh M, Ogawa M, Dos Santos MR, et al. Effects of intradialytic resistance exercise on protein energy wasting, physical performance and physical activity in ambulatory patients on dialysis: a single-center preliminary study in a Japanese dialysis facility. Therap Apher Dial. 2016;20:632–638. [DOI] [PubMed] [Google Scholar]
- 46. Mokkink LB, Terwee CB, Patrick DL, et al. The COSMIN study reached international consensus on taxonomy, terminology, and definitions of measurement properties for health-related patient-reported outcomes. J Clin Epidemiol. 2010;63:737–745. [DOI] [PubMed] [Google Scholar]
- 47. Hayes KW, Johnson ME. Measures of adult general performance tests. Arthritis Care Res. 2003;49:S28-S42. [Google Scholar]
- 48. Scottish Government Scottish Index of Multiple Deprivation 2012: A National Statistics Publication for Scotland. 2012 (December). http://www.gov.scot/Topics/Statistics/SIMD. Archived by WebCite at. http://www.webcitation.org/6fOW1ZDqz. [Google Scholar]
- 49. Cavanaugh JT, Crawford K. Life-Space Assessment and Physical Activity Scale for the Elderly: validity of proxy informant responses. Arch Phys Med Rehabil. 2014;95:1527–1532. [DOI] [PubMed] [Google Scholar]
- 50. Brown CJ, Foley KT, Lowman JDJ, et al. Comparison of post hospitalization function and community mobility in hospital mobility program and usual care patients: a randomized clinical trial. JAMA Intern Med. 2016;176:921–927. [DOI] [PMC free article] [PubMed] [Google Scholar]
- 51. Satariano WA, Guralnik JM, Jackson RJ, Marottoli RA, Phelan EA, Prohaska TR. Mobility and aging: new directions for public health action. Am J Public Health. 2012;102:1508–1515. [DOI] [PMC free article] [PubMed] [Google Scholar]
- 52. Wijlhuizen GJ, Jong de R, Hopman-Rock M. Older persons afraid of falling reduce physical activity to prevent outdoor falls. Prev Med. 2007;44:260–264. [DOI] [PubMed] [Google Scholar]
Associated Data
This section collects any data citations, data availability statements, or supplementary materials included in this article.