Abstract
Optical coherence tomography (OCT) is a promising high-speed, non-invasive imaging modality providing high-resolution retinal scans. However, a variety of external factors such as light occlusion and patient movement can seriously degrade OCT image quality, which complicates manual retinopathy detection and computer-aided diagnosis. As such, this study first presents an OCT image quality assessment (OCT-IQA) system, capable of automatic classification based on signal completeness, location, and effectiveness. Four CNN architectures (VGG-16, Inception-V3, ResNet-18, and ResNet-50) from the ImageNet classification task were used to train the proposed OCT-IQA system via transfer learning. The ResNet-50 with the best performance was then integrated into the final OCT-IQA network. The usefulness of this approach was evaluated using retinopathy detection results. A retinopathy classification network was first trained by fine-tuning Inception-V3 model. The model was then applied to two test datasets, created randomly from the original dataset, one of which was screened by the OCT-IQA system and only included high quality images while the other was mixed by high and low quality images. Results showed that retinopathy detection accuracy and area under curve (AUC) were 3.75% and 1.56% higher, respectively, for the filtered data (compared with the unfiltered data). These experimental results demonstrate the effectiveness of the proposed OCT-IQA system and suggest that deep learning could be applied to the design of computer-aided systems (CADSs) for automatic retinopathy detection.
1. Introduction
Optical coherence tomography (OCT), which can image retinal structures in vivo [1], has been widely applied in diagnostic ophthalmology due to its ease-of-use, lack of ionizing radiation, and high resolution [2]. There are approximately 30 million OCT procedures performed worldwide each year [3], with hundreds of consecutive B-scans comprising the majority of each procedure. This produces large quantities of data and limits the manual evaluation of individual images. Recent developments in computer-aided diagnostic systems (CADSs) have aided in retinopathy diagnosis and reduced the workload for clinicians. This has reduced processing times by accelerating image evaluation and improving diagnoses [4]. Previous studies have focused on screening retinal diseases using OCT images and an automatic CAD system [5–9]. Farsiu et al. assessed OCT scan quality by comparing results with manual evaluations performed by experts, excluding poor quality images from the dataset [5]. Wang et al. eliminated poor quality images during pre-processing and Kermany et al. removed half of the original OCT data in an initial quality review, which decreased the sample size [6,9]. Rasti et al. and Treder et al. used only images from public datasets that passed an image quality assessment (IQA) process. As is common, none of these studies used low-quality images in training the CADS. However, in practice, low quality retinal OCT images are inevitably produced due to insufficient contrast, lighting conditions, patient movement, and signal occlusion, which can cause signal void or blurring and prevent images from being suitable for diagnosis. As such, the use of an IQA in a CADS is critical for eliminating low quality images.
IQA methods can be divided into subjective and objective assessments. Subjective IQA methods were applied in the studies listed above, wherein experts manually eliminated unsatisfactory images [5,6,9]. Objective IQA methods can assist clinicians by automatically evaluating image quality, without requiring manual intervention. Several objective IQA algorithms have been proposed in recent years, including reference and blind IQA techniques. Reference methods primarily involve determining image parameters. For example, Ishikawa et al. [10] calculated the signal-to-noise ratio (SNR) and an image quality (IQ) metric to assess OCT scans. Stein et al. [11] introduced the quality index (QI), a new IQA parameter based on histogram information. Liu et al. [12] proposed signal deviation (SD), which considers the standard deviation of measured intensities, and Huang et al. [13] used a maximum tissue contrast index (mTCI) to quantify the image signal from multiple devices. Reference IQA can automatically and objectively eliminate unqualified images but robustness and accuracy suffer from a heavy dependence on image parameters (i.e., intensity, SNR, and signal strength). This can amplify parameter calculation errors in subsequent assessments. On the other hand, these image parameters mentioned above often fail to represent image quality. For example, an image with high SNR could be unacceptable for retinopathy diagnosis because of an off-centered signal, making the reference IQA unsuitable.
Blind IQA has become more generalizable with the development of machine learning and does not require additional information beyond the original data [14]. As such, it is commonly used for fundus images classification [15–21] and has proven to be effective in eliminating low-quality images. Few studies have investigated the use of blind IQA methods based on OCT until 2019. Kauer et al. proposed an AQuANet to classify OCT B-scans into ‘good,’ ‘bad,’ ‘upper,’ and ‘lower’ categories using A-scans [22]. However, this study only investigated the position of the signal. Zhang et al. proposed a blind IQA architecture based on ResNet50. In this process, OCT images were partitioned into non-overlapping patches for preprocessing. ResNet50 was then adopted as a feature extractor and support vector regression was used to train the IQA model. However, this study primarily focused on assessing signal intensity [23]. These two blind OCT-IQA techniques neglected both signal effectiveness and completeness, which are critical for retinopathy detection.
In this study, we first develop a multi-class deep neural network for pre-filtering a retinopathy detection CADS. This approach pays attention to signal location, effectiveness and completeness, which can automatically assess the quality of retinal OCT images, including signal occlusion, signal centering, and the position of the region of interest. Deep neural networks are proficient in extracting image features, which become increasingly abstract as the layer depth increases. However, deep neural networks characteristically generate multiple parameters and require large quantities of data to avoid over-fitting during the training process. As such, we adopted transfer learning to develop an OCT-IQA network and avoid high computational costs. Four pre-trained CNN architectures (VGG, ResNet-18, ResNet-50, and Inception-V3) were implemented in the study, each of which won the ImageNet Large Scale Visual Recognition Challenge (ILSVRC). We fine-tuned the learned networks for our specific classification task and adopted the highest performing ResNet-50. In addition, a separate retinopathy detection model was developed by fine-tuning the Inception-V3 to test the influence of unqualified images on further CADS and demonstrate the necessity of IQA. Two test datasets collected from the original dataset were adopted for retinopathy detection, one of which was first fed to the OCT-IQA network to eliminate unqualified images and produce a ‘pure’ dataset. The other was composed of acceptable and unacceptable images with a 1:1 ratio, and labeled the ‘mixed’ set. Test results showed that retinopathy detection accuracy and area under curve (AUC) were 3.75% and 1.56% higher, respectively, for the pure data (compared with the mixed data), which demonstrated that image quality is a vital element in automatic retinopathy detection.
2. Materials and methods
2.1. Database
We acquired 15,379 original retinal OCT images using a Zeiss Cirrus device (Carl Zeiss Meditec, Inc., Dublin, CA) from 710 persons of ages ranging from 47 to 85 years and stored them as JPG files at a resolution of 1536 × 1024 pixels. A minimum of 5 B-scans from this area were selected for each patient, to thoroughly observe the retinal macular area.
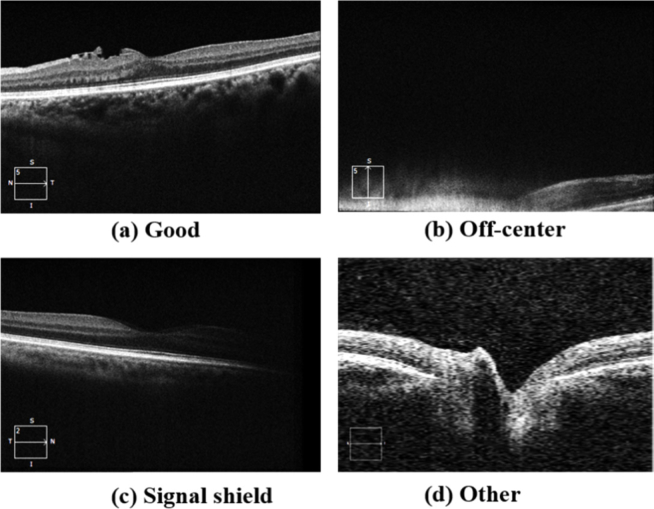
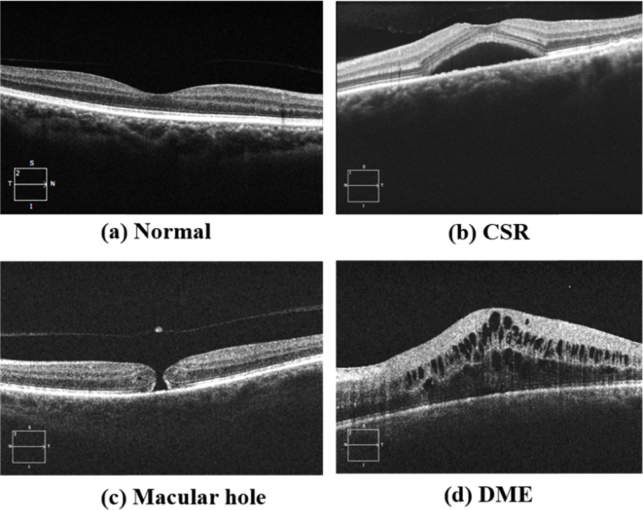
Data annotation was conducted after the images were collected. Two medical students manually screened the data and removed unclassifiable images (i.e. complete signal obstruction). As a result, 781 images were excluded in this first step. The remaining images were separately assessed by two specialists with more than five years of clinical experience. This evaluation included four quality categories: ‘good,’ ‘off-center,’ ‘signal-shielded,’ and ‘other,’ as well as two clinical categories: ‘abnormal’ and ‘normal.’ This reference standard complies with the situation detailed in Table 1, as 1063 images were eliminated due to a lack of consensus between the two specialists. Typical examples from each category are shown in Fig. 1 and representative ‘normal’ and ‘abnormal’ retina images are shown in Fig. 2.
Table 1. A description of quality annotation standards.
| Quality label | Description |
|---|---|
| Good | The complete structure of retina can be clearly observed in the image, and signal is useful for retinopathy diagnosis. |
| Off-center | The retinal signal is placed too high or too low on the image where the signal cannot be fully displayed. |
| Signal-shield | Total or partial loss of retinal signal. |
| Other | Poor quality under other circumstances, such as images with good signal quality but without useful signal information, or images with serious artifacts. |
|
| |
| Anomaly label | |
| Normal | The retina is healthy and without any deformation or defect. |
| Abnormal | The retina is unhealthy because of deformation, edema, bleeding, hiatus, or other anomalies. |
Fig. 1.
Examples of images with different qualities, including: (a) good, (b) off-center, (c) signal-shielded, and (d) other.
Fig. 2.
Examples of normal and abnormal images, including: (a) the normal retina, (b) central serous retinopathy (CSR), (c) a macular hole, and (d) diabetic macular edema (DME).
Following annotation, the database distribution was as follows: good (11804, 56.27% abnormal and 43.72% normal), off-center (647, 17.16% unrecognizable anomaly, 34% abnormal, and 48.84% normal), signal-shielded (710, 36.06% unrecognizable anomaly, 27.04% abnormal, and 36.9% normal), and other (351, 100% unrecognizable anomaly). All poor quality images (including unrecognizable and recognizable anomaly) and 20% of the randomly selected high quality images were used to train the OCT-IQA classifier to make the image numbers of high and low quality balanced. The included dataset exhibited an imbalance problem as fewer poor quality images (including ‘off-center,’ ‘signal-shielded,’ and ‘other’ categories) were available compared with high quality. This is primarily due to a limited sample size. This uneven sample distribution can have a significant influence on classification results and the number of poor-quality images is too small to train a model without overfitting. As such, data augmentation was applied to resolve these issues.
2.2. Data augmentation
Data augmentation is used to produce new synthetic samples from simple transformations of original images [24]. This study included few poor quality images, which were augmented to compensate for low quantities. Horizontal mirroring, rotations through random angles (± 10 degrees), and a contrast enhancement defined by:
| (1) |
were applied. Here, I denotes the destination image, i is the source image, and v (=10 in this study) indicates the degree of contrast enhancement. Before augmentation, one hundred images were randomly selected from the original dataset for each category to test the model, the remaining samples were randomly divided into training and validation sets (scans from the same patients were kept in the same set). Augmentation was then applied to each, to produce sufficient samples while preserving the fraction of images in each category (i.e., fewer samples in the ‘other’ class). The final data distribution is shown in Table 2.
Table 2. Datasets used for training, evaluating, and testing the model.
| Good | Off-center | Signal-shield | Other | |
|---|---|---|---|---|
| Training set | 3427 | 2973 | 3230 | 2133 |
| Validation set | 107 | 104 | 76 | 83 |
| Test set | 100 | 100 | 100 | 100 |
| Total | 3634 | 3177 | 3460 | 2316 |
2.3. Convolutional neural network (CNN)
CNNs are a common framework used for deep learning. VGG, ResNet, and Inception are typical CNNs which have been successfully applied to medical image classification problems such as skin cancer classification [25], early diagnosis of Alzheimer’s disease [26], and retinal vessel detection in fundus images [27].
A CNN is typically composed of convolutional, pooling, and fully connected layers. Convolutional layers are used to calculate convolutions between specific kernels and the input data. An activation function is then applied to produce a new feature map. The convolutional operation for a single channel can be expressed as:
| (2) |
where k is the convolutional kernel and W, H, and S represent the dimensions of k. The kernel convolves the input along its dimensions of width and height to produce the output at the location . The nonlinear activation function F is given by:
| (3) |
The feature map is then sent to the pooling layer for feature selection and information filtering. Finally, every output unit is connected to all units of the previous feature map in the fully connected layer. VGG-16, Inception-V3, and ResNet were adopted in this study, as described below.
VGG-16 [28]: a plain CNN network consisting of 13 convolutional layers, 5 max-pooling layers, and 3 fully connected layers. All convolutional layers in VGG-16 featured a small 3 × 3 kernel. The max-pooling layer included a 2 × 2 kernel to decrease the number of parameters.
Inception-V3 [29]: a deeper network consisting of 22 layers and fewer parameters. An ‘Inception’ module was utilized in this network architecture, which factored 3 × 3 convolutions into two smaller convolutions, such as 1 × 3 and 3 × 1. This was beneficial for reducing parameters, accelerating calculations, and preventing over-fitting.
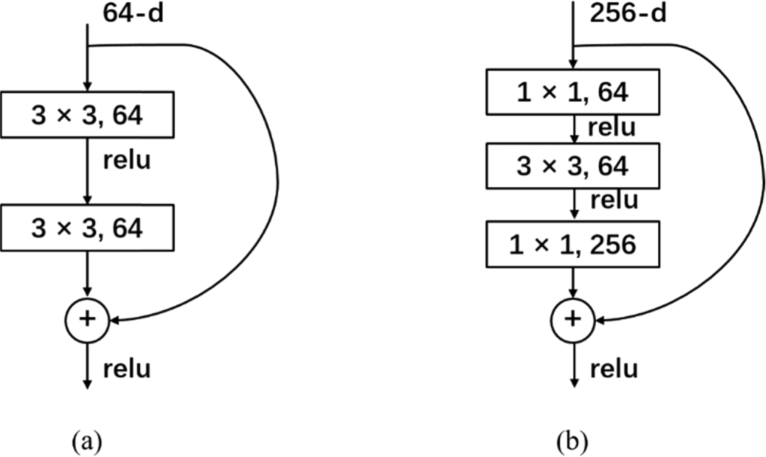
ResNet (ResNet-18, ResNet-50) [30]: a residual block with a skip connection bypass to resolve the difficulties of training deeper networks, allowing for higher accuracy. This architecture exhibits varying depths of 18, 50, 101, and 152 layers. In this study, we evaluated the performance of ResNet-18 and ResNet-50 because the residual block architecture in ResNet-50 has made some adjustments to improve performance for ImageNet tasks, as shown in Fig. 3. This performance was then tested separately using our dataset. ResNet-18 and ResNet-50 both consist of six modules denoted by conv1, conv2 x, conv3 x, conv4 x, conv5 x, and FC. Conv1 is a convolutional layer. Conv2 x, conv3 x, conv4 x, and conv5 x include residual blocks numbered as 2, 2, 2, and 2 in ResNet-18 and 3, 4, 6, and 3 in ResNet-50, respectively. FC is the fully connected layer.
Fig. 3.
Residual blocks for (a) ResNet-18 and (b) ResNet-50
2.4. A transfer learning framework for OCT-IQA
Deep CNNs are invariant to shifts, rotations, and scaling. They also include large quantities of trainable parameters, providing them with a high capacity for generalization. However, large amounts of labeled data are necessary to avoid under-fitting and over-fitting, which is a challenge with medical images. Furthermore, adjustments to the training parameters are required to improve the convergence.
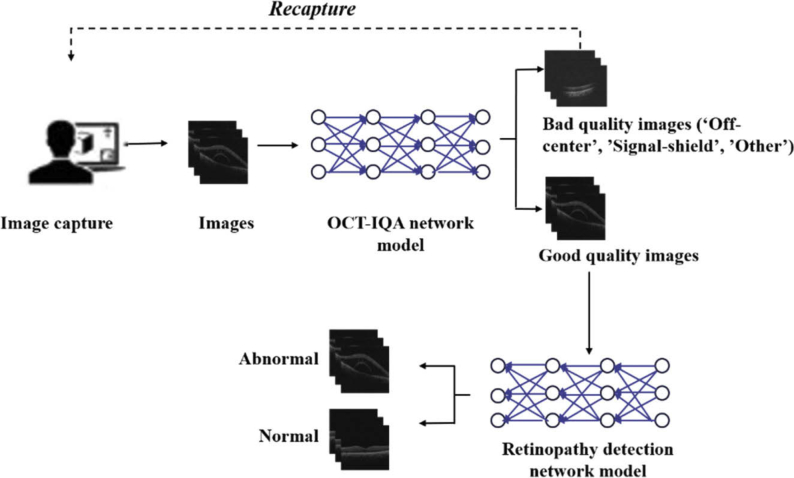
Transfer learning is a useful method for resolving these issues, having been used in a variety of fields [9,31–32]. The basic idea of transfer learning is that features extracted by the pre-trained model can be reused in specific classification tasks. The architecture proposed in this study, which consists of an OCT-IQA network and a retinopathy network, was trained using transfer learning (see Fig. 4). The workflow for this architecture is described as follows.
-
1)
The OCT-IQA network model was trained to remove unqualified images, including off-center, signal-shielded, and other quality abnormalities. Four CNNs introduced previously I(VGG, ResNet-18, ResNet-50, and Inception-V3) were fine-tuned to identify the most suitable network for OCT-IQA in two steps. The first step was network initialization where convolutional layers in each CNN were initialized by loaded weights, pre-trained on the ImageNet dataset by the corresponding network [33]. The second step included redesigning new top layers for the network because these architectures were originally designed for 1000-category classification task. A final layer and a softmax layer were then added to the pre-trained networks and retrained to recognize specific classes. In this study, images were classified into four categories during OCT-IQA. A testing dataset was randomly selected to evaluate four fine-tuned networks and the architecture with the best performance was selected.
-
2)
The OCT-IQA model was used to classify the entire dataset into unqualified images, where images needing to be retaken, and acceptable images.
-
3)
Images with serious quality issues were removed. The remaining samples, which had been previously labeled by ophthalmologists, were used to train the retinopathy detection network to classify acceptable images into normal and abnormal categories.
Fig. 4.
The transfer learning architecture for OCT-IQA (optical coherence tomography image quality assessment) and retinopathy detection.
3. Experimental results
3.1. Experimental setup
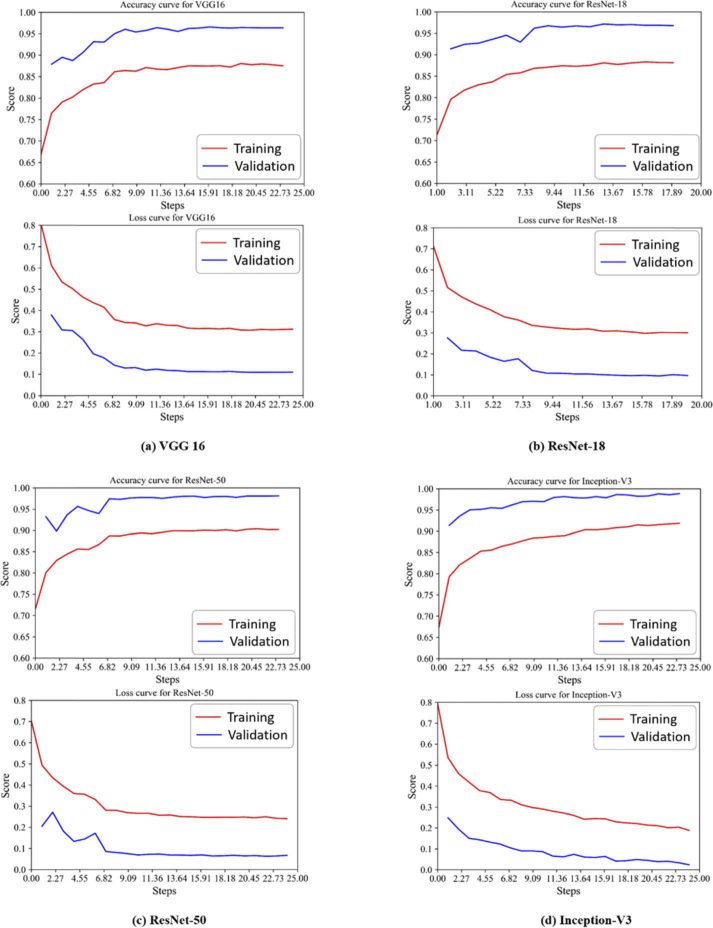
Four CNNs were fine-tuned during the OCT-IQA process. To reduce computational complexity, input images were resized to 299 × 299 × 3 for Inception-V3 and to 224 × 224 × 3 for VGG, ResNet-18 and ResNet-50. A learning rate of 0.001, stochastic gradient decent [34] with Nesterov momentum 0.9 was applied to fine-tune the four CNNs. The training process was completed when the cross-entropy cost function and the accuracy converged. Corresponding training and loss curves are shown in Fig. 5. This result required 18 epochs for ResNet18 and 24 epochs for the other architectures with batch sizes of 32. The training data were directly fed to the network with pre-trained weight parameters and processed using a desktop computer with an Intel Xeon E5-2620 CPU, 32 GB RAM, and two NVIDIA GeForce GTX 1080Ti GPUs. The cross entropy loss can be expressed as:
| (4) |
where is the ground truth and is the predicted output.
Fig. 5.
Accuracy and loss curves for (a) VGG16, (b) ResNet-18, (c) ResNet-50, and (d) Inception-V3
3.2. Experimental results for OCT-IQA
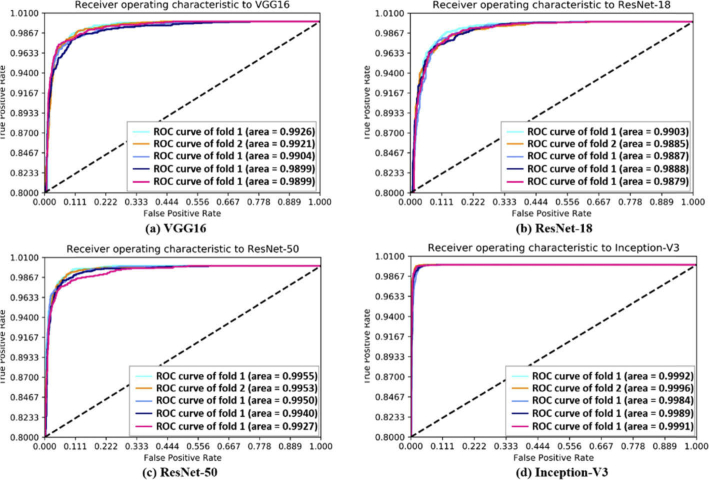
Images labelled as ‘off-center,’ ‘signal-shielded,’ or ‘other’ were considered unqualified, while those with high quality were classified as acceptable. The OCT-IQA classifier was trained using five-fold cross-validation on the training and validation sets, as demonstrated by Table 2. The data were divided into five separate, equally stratified sets. Each subset was used to evaluate the model while the remaining four subsets were used to train the model. The final assessment was made using the test set. Following this five-fold cross-validation, the area under the receiver operating characteristic curve (AUC) was calculated and used to determine the model’s ability to distinguish poor quality images (off-center, signal-shielded, or other) from good quality images. The model with the highest AUC score was selected as the final model and was evaluated using the test set. The AUCs of various architectures used for five-fold validation are shown in Fig. 6. The mean (SD) AUCs for VGG-16, ResNet-18, ResNet-50, and Inception-V3 were 0.99122 (0.0023), 0.9888 (0.0018), 0.9932 (0.0026), and 0.9983 (0.0008), respectively. These results indicate that the standard deviation (SD) of AUC values were small (max: 0.0026, min: 0.0008) for each model, which demonstrate their stability and robustness.
Fig. 6.
ROC curves and AUC values for five-fold cross-validation experiments on VGG16, ResNet-18, ResNet-50 and Inception-V3.
The highest AUCs model of each architecture were tested using the test dataset. The specificity (SP), recall (Re), and precision (PR) were calculated for the independent classes to assess model performance. In this four-category classification problem, true positive and true negative values were determined by correctly dividing the test images into positive and negative classes. The positive class was the appointed class and the negative class included any samples not in the selected class. False positives and false negatives were determined by incorrectly dividing the test images into negative and positive classes, respectively. The recall indicates the proportion of true positives in the sum to the number of true positives and false negatives. SP is the proportion of true negatives in the sum to the number of true negatives and false positives. PR is defined as the proportion of true positives in the sum to true positives and false positives. In addition, the overall accuracy (OA), overall recall (OR), overall specificity (OS), overall precision (OP), and F1 score (F1) were included, as shown in Table 3. These parameters were calculated using Eqs. (5)–(8), where TP, TN, FP, and FN represent true positive, true negative, false positive, and false negative. Evaluation metrics were defined as follows:
| (5) |
| (6) |
| (7) |
| (8) |
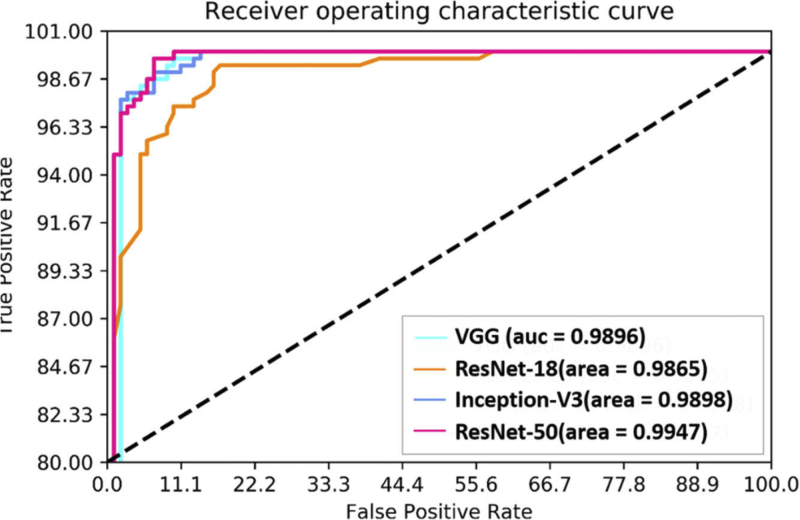
These results suggest that networks with deeper layers (e.g., ResNet-18, ResNet-50, and Inception-V3) and improved architectures (e.g., residual and inception modules) outperformed networks with basic structures (VGG16). Specifically, ResNet-50 achieved better results for ‘good’ and ‘other’ cases, though its performance was not ideal for ‘signal-shielded’ or ‘off-center’ images. In contrast, Inception-V3 and ResNet-18 achieved better results in these two categories, suggesting these networks may focus on different features. ResNet-50 achieved the highest OA, OR, OS, and F1 scores, while its OP was slightly lower than that of ResNet-18. ROC curves were also used to determine the most suitable architecture for OCT-IQA. These curves plot the true positive rate against the false positive rate, which represents the overall classification abilities of architectures across four classes. Values closer to the upper-left corner indicate better performance. Figure 7 suggests that ResNet-50 performed better than the other four models, achieving the highest AUC (0.9947).
Table 3. Accuracy, recall, specificity, precision and F1 score for different network architectures used for classification of image quality into “good,” “off-center,” “signal-shielded,” and “other.” The best option within each metric is in bold.
| Network | class | Re (%) | SP (%) | PR (%) | OA (%) | OR (%) | OS (%) | OP (%) | F1 score (%) |
|---|---|---|---|---|---|---|---|---|---|
| VGG | Good | 97 | 95.33 | 87.39 | 95 | 95.33 | 97 | 98.96 | 97.11 |
| Off-center | 94 | 98.33 | 94.95 | ||||||
| S-shield | 92 | 99.33 | 97.87 | ||||||
| Other | 95 | 99.67 | 98.96 | ||||||
|
| |||||||||
| ResNet-18 | Good | 98 | 96.67 | 90.74 | 95.75 | 96.67 | 98 | 99.32 | 97.98 |
| Off-center | 97 | 98.33 | 95.1 | ||||||
| S-shield | 92 | 99.67 | 98.93 | ||||||
| Other | 96 | 99.67 | 98.97 | ||||||
|
| |||||||||
| ResNet-50 | Good | 97 | 97.33 | 92.38 | 96.25 | 97 | 98.98 | 98.15 | 98.15 |
| Off-center | 92 | 98.67 | 95.83 | ||||||
| S-shield | 96 | 98.33 | 95.05 | ||||||
| Other | 97 | 99.67 | 98.98 | ||||||
|
| |||||||||
| Inception-V3 | Good | 95 | 96.67 | 90.48 | 96.25 | 96.67 | 95 | 98.31 | 97.48 |
| Off-center | 93 | 99.33 | 97.89 | ||||||
| S-shield | 99 | 98.33 | 95.19 | ||||||
| Other | 95 | 99.67 | 98.96 | ||||||
S-shield: Signal-shield
Fig. 7.
A comparison of receiver operating characteristic (ROC) curves and AUC values for poor quality images (defined as off-center, signal-shielded, and other) using (a) VGG16 (AUC = 0.9896), (b) ResNet-18 (AUC = 0.9865), (c) ResNet-50 (AUC = 0.9947), and (d) Inception-V3 (AUC = 0.9898)
As such, we selected the ResNet-50 model for OCT-IQA, with an OA of 96.25%, an OR of 97%, an OS of 98.98%, and an AUC of 99.47%.
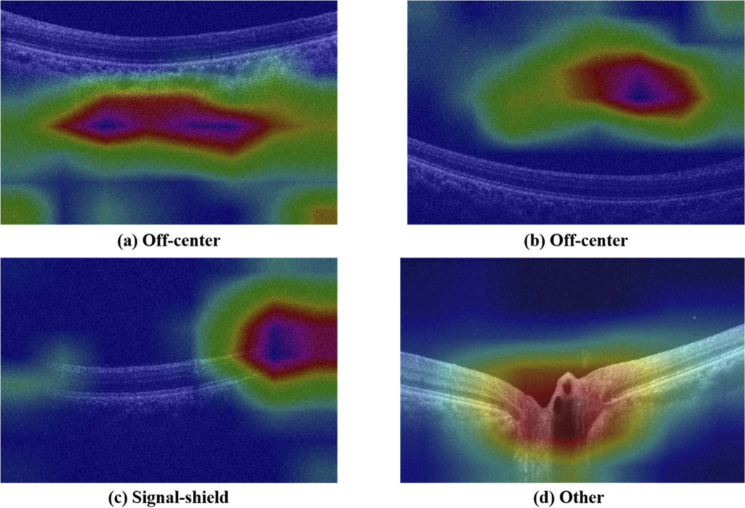
Heat maps were developed during the training phase to determine which regions of an image were being paid the most attention. Figure 8 shows a heat map generated from the retrained ResNet-50 model. The images in Fig. 8(a) and 8(b) were classified as off-center, with regions above and below the retina highlighted. The image in Fig. 8(c) was classified as signal-shielded and the regions with a signal hiatus were highlighted. The image in Fig. 8(d) was classified as ‘other’ and the region around the optic disk was highlighted. These heat map results demonstrate that key features used in OCT-IQA (i.e., signal location and signal appearance) were successfully learned by the network.
Fig. 8.
Image quality heat maps showing (a) (b) off-center, (c) signal-shielded, and (d) ‘other’ categories.
3.3. Results of retinopathy detection
A second subnetwork was trained to demonstrate the necessity of IQA in retinopathy detection and construct a more robust retinopathy detection model. Inception-V3 has been shown to perform well in retinopathy classification (i.e., drusen, CNV, and DME [9]). As such, we fine-tuned this architecture to train the retinopathy detection model, which was designed to classify lesion images into ‘normal’ and ‘abnormal’ categories. Normal indicated the retina was healthy and abnormal implied the retina suffered from a retinopathy (e.g., drusen, macular edema, neovascularization, etc.), causing retinal distortion. The retinopathy detection dataset was established by eliminating all images belonging to the ‘other’ category and some images in the signal-shielded and off-center categories, since retinopathies in these images could not be recognized during anomaly grading. Afterward, 12,794 images consisting of 7,096 abnormal (6,644 good, 220 off-center, and 192 signal-shielded) and 5,738 normal (5,160 good, 316 off-center, and 262 signal-shielded) samples were selected from 13,535 images. The dataset was separated into training, validation, and testing sets in a process similar to that of the network described above. Only the training data were augmented using contrast enhancement (defined by Eq.(1)) and horizontal flipping. The final dataset consisted of 23,602 images including 22,530 training, 472 validation, and 600 test samples (200 poor and 400 good quality). The experimental setting (i.e. optimizer, batch size and learning rate) was the same as Inception-V3 used in the first sub-network.
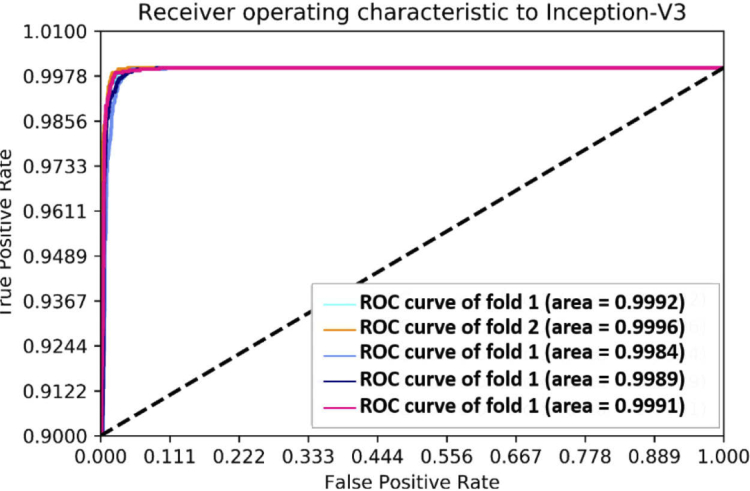
Five-fold cross-validation was applied to select hyper-parameters and confirm the robustness and stability of the Inception-V3 model, the training and validation sets were involved in. Results showed slight variability in the performance of the network with a mean AUC of 99.90%. The model with the highest AUC score (99.96%) was selected as the final model. Corresponding five-fold ROC curves are shown in Fig. 9. We have also tested the generalizability of proposed model by public dataset in study [9], which captured from Spectralis OCT (Heidelberg Engineering, Germany) and had different signal distribution and image size from ours. The public dataset has classified images into four categories: choroidal neovascularization, diabetic macular edema, drusen and normal. We tested our retinopathy detection model on their open test dataset (1000 images, 250 from each category). As our model is a two-class model, we put the choroidal neovascularization, diabetic macular edema, drusen together to form the abnormal category, and images of normal form the normal category. Finally, excellent results of 99.5% AUC and 99.87% sensitivity were obtained, which proved that the proposed model can be generalized.
Fig. 9.
Five-fold cross-validation receiver operating characteristic (ROC) curves used to differentiate normal and abnormal retinas.
The effect of unqualified images on retinopathy detection was evaluated using ‘pure’ and ‘mixed’ test datasets. The dataset was fed into the OCT-IQA first to get quality label. Then the ‘pure’ set consisted only of images in good quality (400 images, 200 from each category), the mixed dataset consisted of 100 poor-quality images (50 off-center and 50 signal-shielded) and 100 acceptable-quality images (400 images). Corresponding test results are shown in Table 4.
Table 4. Test results for the retinopathy detection model with pure and mixed datasets.
| Database | Image number | Accuracy (%) | Sensitivity (%) | Specificity (%) | AUC (%) |
|---|---|---|---|---|---|
| Pure | 400 | 97 . 5 | 97.5 | 97.5 | 99.74 |
| Mixed | 400 | 93.75 | 93.5 | 94 | 98.18 |
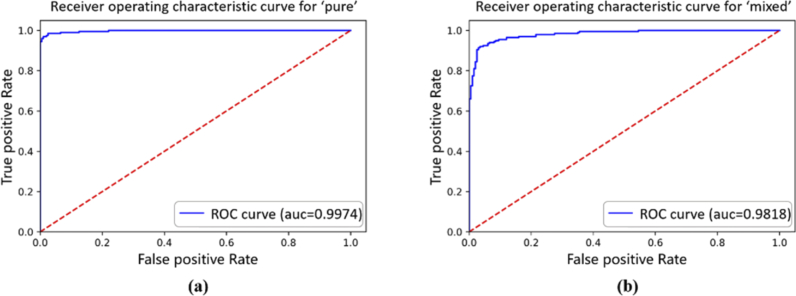
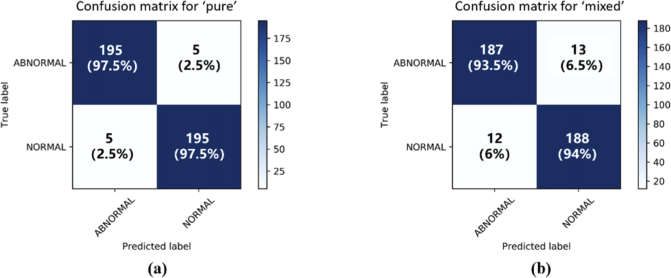
As seen in the table, retinopathy detection accuracy for the pure dataset was 97.5%, higher than that of the mixed dataset at 93.75%. The sensitivity and specificity values were also higher in the pure dataset. ROC (Fig. 10) and confusion matrices (Fig. 11) were generated to evaluate model performance. The resulting AUC values were 99.74% and 98.18% for the pure and mixed sets, respectively, suggesting that model classification performance was compromised by unqualified images. The confusion matrices imply that the true positives and true negatives for the pure dataset improved significantly.
Fig. 10.
AUC for retinopathy detection of (a) pure and (b) mixed datasets (right).
Fig. 11.
Confusion matrices for (a) pure and (b) mixed retinopathy detection datasets.
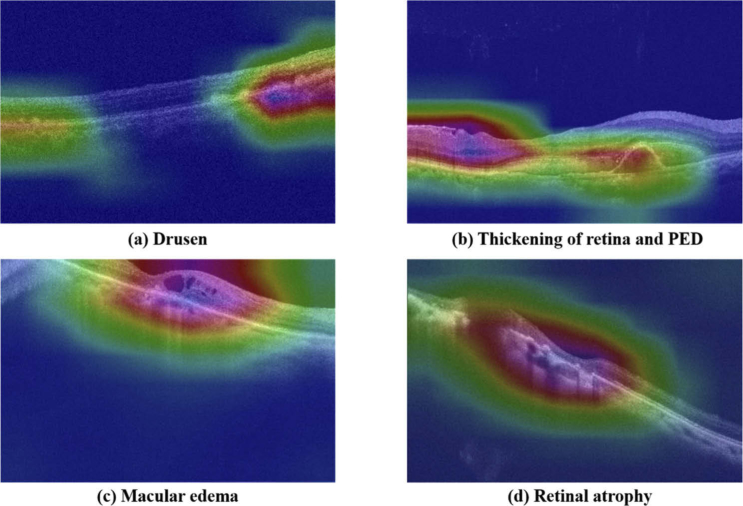
Heat maps were also generated during the test to determine whether lesions were discovered by the network. The images shown in Fig. 12(a) and 12(b) are of good quality, 12(c) is off-center, and 12(d) is signal-shielded. Drusens were highlighted in Fig. 12(a) and retina thickening and pigment epithelial detachment are evident in Fig. 12(b). Figure 12(c) demonstrates macular edema and a retinal atrophy is visible in 12(d). It is evident that the network classified the retina as either normal or abnormal based on the lesion. The network was able to form the correct conclusion, even for poor quality images, as long as the lesion could be observed. As such, lesion visibility is critical in retinopathy detection. If the retina structure or lesion is severely shielded, the model cannot acquire sufficient information to draw accurate conclusions.
Fig. 12.
Heat maps for a retinopathy classifier showing: (a) a drusen structure, (b) thickening of the retina and pigment epithelial detachments (PED), (c) macular edema, and (d) retinal atrophy.
These experimental results indicate that unqualified images can negatively affect retinopathy detection. Poor quality images often exhibit signal-shielding or signal deficiency, which can cause difficulties for identifying lesions. OCT-IQA can detect unqualified images in real-time and recapture them after they have been eliminated. This reduces processing time and is useful for improving the accuracy of retinopathy detection.
4. Conclusion and discussion
In this study, an architecture based on a deep CNN was proposed to classify the quality of OCT images and identify the existence of retinopathies. The system consisted of an OCT-IQA classifier and a retinopathy detector. Several extant CNNs, including VGG, ResNet-18, ResNet-50, and Inception-V3 were fine-tuned by replacing the final layers and retraining on our dataset to determine the proper CNN for the proposed architecture. ResNet-50 achieved the best performance in classifying OCT image quality, with an overall accuracy of 96.25%, an OR of 97.33%, and an AUC of 99.47%. We confirmed the influence of image quality on retinopathy detection by constructing a separate model, which adopted the Inception-V3 architecture and was tested using ‘pure’ and ‘mixed’ datasets. The pure dataset was classified by OCT-IQA and only included images with good quality. The mixed dataset was mixed with high quality images and unqualified images. The model achieved better classification results with the dataset that passed OCT-IQA, where testing accuracy was 3.75% higher for the pure dataset than the mixed dataset. In summary, a trained IQA model was used to reduce non-beneficial images during CADS preprocessing. In addition, a CNN model was developed and tested, achieving excellent performance for retinopathy detection. This suggests that the models discussed above could be advantageous in the design of a computer-aided diagnostic system (CADS) for automatic lesion detection.
Furthermore, the proposed OCT-IQA model demonstrate ability to classify images into four specified quality categories, which can be further applied to hardware control system to assist the automatic reacquisition of poor-quality images in the future.
Acknowledgment
We would like to thank LetPub (www.letpub.com) for providing linguistic assistance during the preparation of this manuscript.
Funding
National Basic Research Program of China (973 Program)10.13039/501100012166 (2017YFC0108201, 2016YFE0107700); Jiangsu Provincial Key Research and Development Program10.13039/501100013058 (BE2019682, BE2018667); National Natural Science Foundation of China10.13039/501100001809 ( 61605210, 61675226); Youth Innovation Promotion Association of the Chinese Academy of Sciences10.13039/501100004739 (2019320).
Disclosures
The authors declare that there are no conflicts of interest related to this article.
References
- 1.Velthoven M. E., Faber D. J., Verbraak F. D., van Leeuwen T. G., de Smet M. D., “Recent developments in optical coherence tomography for imaging the retina,” Prog. Retinal Eye Res. 26(1), 57–77 (2007). 10.1016/j.preteyeres.2006.10.002 [DOI] [PubMed] [Google Scholar]
- 2.Lang A., Carass A., Hauser M., Sotirchos E. S., Calabresi P. A., Ying H. S., Prince J. L., “Retinal layer segmentation of macular OCT images using boundary classification,” Biomed. Opt. Express 4(7), 1133–1152 (2013). 10.1364/BOE.4.001133 [DOI] [PMC free article] [PubMed] [Google Scholar]
- 3.Swanson E. A., Fujimoto J. G., “The ecosystem that powered the translation of OCT from fundamental research to clinical and commercial impact,” Biomed. Opt. Express 8(3), 1638–1664 (2017). 10.1364/BOE.8.001638 [DOI] [PMC free article] [PubMed] [Google Scholar]
- 4.Mookiah M. R. K., Acharya U. R., Chua C. K., Lim C. M., Ng E. Y. K., Laude A., “Computer-aided diagnosis of diabetic retinopathy: A review,” Comput. Biol. Med. 43(12), 2136–2155 (2013). 10.1016/j.compbiomed.2013.10.007 [DOI] [PubMed] [Google Scholar]
- 5.Farsiu S., Chiu S. J., O’ Connell R. V., Folgar F. A., Yuan E., Izatt J. A., Toth C. A., “Quantitative classification of eyes with and without intermediate age-related macular degeneration using optical coherence tomography,” Ophthalmology 121(1), 162–172 (2014). 10.1016/j.ophtha.2013.07.013 [DOI] [PMC free article] [PubMed] [Google Scholar]
- 6.Wang Y., Zhang Y., Yao Z., Zhao R., Zhou F., “Machine learning based detection of age-related macular degeneration (AMD) and diabetic macular edema (DME) from optical coherence tomography (OCT) images,” Biomed. Opt. Express 7(12), 4928–4940 (2016). 10.1364/BOE.7.004928 [DOI] [PMC free article] [PubMed] [Google Scholar]
- 7.Rasti R., Rabbani H., Mehridehnavi A., Hajizadeh F., “Macular OCT classification using a multi-scale convolutional neural network ensemble,” IEEE Trans. Med. Imaging 37(4), 1024–1034 (2018). 10.1109/TMI.2017.2780115 [DOI] [PubMed] [Google Scholar]
- 8.Treder M., Lauermann J. L., Eter N., “Automated detection of exudative age-related macular degeneration in spectral domain optical coherence tomography using deep learning,” Graefe’s Arch. Clin. Exp. Ophthalmol. 256(2), 259–265 (2018). 10.1007/s00417-017-3850-3 [DOI] [PubMed] [Google Scholar]
- 9.Kermany D. S., Goldbaum M., Cai W., Valentim C. C. S., Liang H., Baxter S. L., McKeown A., Yang G., Wu X., Yan F., Dong J., Prasadha M. K., Pei J., Ting M. Y. L., Zhu J., Li C., Hewett S., Dong J., Ziyar I., Shi A., Zhang R., Zheng L., Hou R., Shi W., Fu X., Duan Y., Huu V. A. N., Wen C., Zhang E. D., Zhang C. L., Li O., Wang X., Singer M. A., Sun X., Xu J., Tafreshi A., Anthony Lewis M., Xia H., Zhang K., “Identifying medical diagnoses and treatable diseases by image-based deep learning,” Cell 172(5), 1122–1131.e9 (2018). 10.1016/j.cell.2018.02.010 [DOI] [PubMed] [Google Scholar]
- 10.Ishikawa H., Wollstein G., Aoyama M., Stein D., Beaton S., Fujimoto J. G., Schuman J. S., “Stratus OCT image quality assessment,” Invest. Ophthalmol. Visual Sci. 45(13), 3317 (2004). [Google Scholar]
- 11.Stein D. M., Ishikawa H., Hariprasad R., Wollstein G., Noecker R. J., Fujimoto J. G., Schuman J. S., “A new quality assessment parameter for optical coherence tomography,” Br. J. Ophthalmol. 90(2), 186–190 (2006). 10.1136/bjo.2004.059824 [DOI] [PMC free article] [PubMed] [Google Scholar]
- 12.Liu S., Paranjape A. S., Elmaanaoui B., Dewelle J., Rylander H. G., Markey M. K., Milner T. E., “Quality assessment for spectral domain optical coherence tomography (OCT) images,” In Multimodal Biomedical Imaging IV (Vol. 7171, p. 71710X). International Society for Optics and Photonics (2009). [DOI] [PMC free article] [PubMed] [Google Scholar]
- 13.Huang Y., Gangaputra S., Lee K. E., Narkar A. R., Klein R., Klein B. E. K., Meuer S. M., Danis R. P., “Signal Quality Assessment of Retinal Optical Coherence Tomography Images. Signal quality assessment of retinal optical coherence tomography images,” Invest. Ophthalmol. Visual Sci. 53(4), 2133–2141 (2012). 10.1167/iovs.11-8755 [DOI] [PMC free article] [PubMed] [Google Scholar]
- 14.Gao X., Gao F., Tao D., Li X., “Universal blind image quality assessment metrics via natural scene statistics and multiple kernel learning,” IEEE Trans. Neural Netw. Learning Syst. 24(12), 2013–2026 (2013). 10.1109/TNNLS.2013.2271356 [DOI] [PubMed] [Google Scholar]
- 15.Gu K., Zhai G., Yang X., Zhang W., “Deep learning network for blind image quality assessment,” In 2014 IEEE International Conference on Image Processing (ICIP), (2014, October), pp. 511–515. IEEE. [Google Scholar]
- 16.Tennakoon R., Mahapatra D., Roy P., Sedai S., Garnavi R., “Image Quality Classification for DR Screening Using Convolutional Neural Networks,” In: Chen X., Garvin M. K., Liu J., Trucco E., Xu Y., eds. Proceedings of the Ophthalmic Medical Image Analysis Third International Workshop, OMIA 2016, Held in Conjunction with MICCAI 2016, Athens, Greece, (October 21, 2016), 113–120. [Google Scholar]
- 17.Saha S. K., Fernando B., Cuadros J., Xiao D., Kanagasingam Y., “Deep Learning for Automated Quality Assessment of Color Fundus Images in Diabetic Retinopathy Screening,” arXiv preprint arXiv:1703.02511. (2017). [DOI] [PMC free article] [PubMed]
- 18.Sun J., Wan C., Cheng J., Yu F., Liu J., “Retinal image quality classification using fine-tuned CNN,” In Fetal, Infant and Ophthalmic Medical Image Analysis, (2017), pp. 126–133. Springer, Cham. [Google Scholar]
- 19.Yu F., Sun J., Li A., Cheng J., Wan C., Liu J., “Image quality classification for DR screening using deep learning,” In 2017 39th Annual International Conference of the IEEE Engineering in Medicine and Biology Society (EMBC) (IEEE, 2017), pp. 664–667. [DOI] [PubMed] [Google Scholar]
- 20.Zhang Y., Wang L., Wu Z., Zeng J., Chen Y., Tian R., Zhao J., Zhang G., “Development of an Automated Screening System for Retinopathy of Prematurity Using a Deep Neural Network for Wide-angle Retinal Images,” IEEE Access 7, 10232–10241 (2019). 10.1109/ACCESS.2018.2881042 [DOI] [Google Scholar]
- 21.Zago G. T., Andreão R. V., Dorizzi B., Salles E. O. T., “Retinal image quality assessment using deep learning,” Comput. Biol. Med. 103, 64–70 (2018). 10.1016/j.compbiomed.2018.10.004 [DOI] [PubMed] [Google Scholar]
- 22.Kauer J., Gawlik K., Zimmermann H. G., Kadas E. M., Bereuter C., Paul F., … & Beckers I. E., “Automatic quality evaluation as assessment standard for optical coherence tomography,” In Advanced Biomedical and Clinical Diagnostic and Surgical Guidance Systems XVII, (2019, February), Vol. 10868, p. 1086814. International Society for Optics and Photonics. [Google Scholar]
- 23.Zhang M., Wang J. Y., Zhang L., Feng J., Lv Y., “Deep residual-network-based quality assessment for SD-OCT retinal images: preliminary study,” In Medical Imaging 2019: Image Perception, Observer Performance, and Technology Assessment, (2019, March), Vol. 10952, p. 1095214. International Society for Optics and Photonics. [Google Scholar]
- 24.Courville A., Goodfellow I., Bengio Y., “Deep Learning Book,” Deep learning, 21(1), 111–124. arXiv:arXiv:1011. (2015). [Google Scholar]
- 25.Esteva A., Kuprel B., Novoa R. A., Ko J., Swetter S. M., Blau H. M., Thrun S., “Dermatologist-level classification of skin cancer with deep neural networks,” Nature 542(7639), 115–118 (2017). 10.1038/nature21056 [DOI] [PMC free article] [PubMed] [Google Scholar]
- 26.Liu S., Cai W., Pujol S., Kikinis R., Feng D., “Early Diagnosis of Alzheimer’s Disease with Deep Learning,” in IEEE International Symposium on Biomedical Imaging: From Nano to Macro (ISBI), Beijing, (2014), pp. 1015–1018. [Google Scholar]
- 27.Maji D., Santara A., Mitra P., Sheet D., “Ensemble of deep convolutional neural networks for learning to detect retinal vessels in fundus images,” arXiv preprint arXiv:1603.04833. (2016).
- 28.Simonyan K., Zisserman A., “Very deep convolutional networks for large-scale image recognition,” arXiv preprint arXiv:1409.1556. (2014).
- 29.Szegedy C., Vanhoucke V., Ioffe S., Shlens J., Wojna Z., “Rethinking the inception architecture for computer vision,” In Proceedings of the IEEE conference on computer vision and pattern recognition, (2016), pp. 2818–2826. [Google Scholar]
- 30.He K., Zhang X., Ren S., Sun J., “Deep residual learning for image recognition,” In Proceedings of the IEEE conference on computer vision and pattern recognition, (2016), pp. 770–778. [Google Scholar]
- 31.Karri S. P. K., Chakraborty D., Chatterjee J., “Transfer learning based classification of optical coherence tomography images with diabetic macular edema and dry age-related macular degeneration,” Biomed. Opt. Express 8(2), 579–592 (2017). 10.1364/BOE.8.000579 [DOI] [PMC free article] [PubMed] [Google Scholar]
- 32.Burlina P. M., Joshi N., Pekala M., Pacheco K. D., Freund D. E., Bressler N. M., “Automated grading of age-related macular degeneration from color fundus images using deep convolutional neural networks,” JAMA Ophthalmol. 135(11), 1170–1176 (2017). 10.1001/jamaophthalmol.2017.3782 [DOI] [PMC free article] [PubMed] [Google Scholar]
- 33.Deng J., Dong W., Socher R., Li L. J., Li K., Fei-Fei L., “Imagenet: A large-scale hierarchical image database,” IEEE conference on computer vision and pattern recognition (2009). pp. 248–255. [Google Scholar]
- 34.Bottou L., “Large-scale machine learning with stochastic gradient descent,” In Proceedings of COMPSTAT”2010, (2009, June), pp. 177–186. Physica-Verlag HD. [Google Scholar]


