Abstract
Visual stimulation is one of the most commonly used paradigms for cerebral cortex function investigation. Experiments typically involve presenting to a volunteer a black-and-white checkerboard with contrast-reversing at a frequency of 4 to 16 Hz. The aim of the present study was to investigate the influence of the flickering frequency on the amplitude of changes in the concentration of oxygenated and deoxygenated hemoglobin. The hemoglobin concentrations were assessed with the use of a high resolution diffuse optical tomography method. Spatial distributions of changes in hemoglobin concentrations overlaying the visual cortex are shown for various stimuli frequencies. Moreover, the hemoglobin concentration changes obtained for different source-detector separations (from 1.5 to 5.4 cm) are presented. Our results demonstrate that the flickering frequency had a statistically significant effect on the induced oxyhemoglobin changes (p < 0,001). The amplitude of oxy hemoglobin concentration changes at a frequency of 8 Hz was higher in comparison with that measured at 4 Hz :[median(25th-75thpercentiles) 1.24 (0.94–1.71) vs. 0.92(0.73–1.28)µM, p < 0.001]; 12 Hz:[1.24 (0.94–1.71) vs. 1.04 (0.78–1.32) µM, p < 0.001]; and 16 Hz:[1.24 (0.94–1.71) vs. 1.15(0.87–1.48) µM, p < 0.001]. No significant differences were observed between the size of an area of activation for various frequencies. The demonstrated superiority of 8 Hz over other frequencies can advance understanding of visual stimulations and help guide future fNIRS protocols.
1. Introduction
During a functional stimulation of a visual cortex an electrical activation is followed by an increase in concentration of oxy- and decrease in concentration of deoxyhemoglobin, which are related to an increased demand of oxygen in the stimulated cortical area [1,2]. Such response in the visual cortex was reported in many studies in which volunteers have been watching a checkerboard flashing at frequencies higher than 1 Hz [1,3]. The area of activation on the cortex is usually located in occipital lobe [4]. Effects of stimulation can spread also through parietal, temporal, frontal and prefrontal areas [1]. It was reported that the stimulation at frequencies below 30 Hz can effectively induce a strong response in the visual cortex, whereas stimuli at higher frequencies lead to weaker responses. Furthermore, for frequencies higher than 70 Hz the responses to flickering light and non-flickering light cannot be distinguished [5]. It was demonstrated that the amplitude of the cortical response to a flickering stimulus depends on its frequency [6,7]. Even though various techniques have been used for studying this phenomenon [3,8,9] the neurovascular mechanism which leads to this dependence is still not well understood.
Several neuroimaging techniques have been used in order to study the dependency of change in amplitude of signals related to electrical (using electroencephalography - EEG), metabolic (using positron emission tomography PET) and vascular (using functional magnetic resonance-fMRI) responses on the checkerboard flashing frequency. In the research conducted by Hermann et al. [3] with the use of EEG on the group of healthy volunteers an increased power in the steady state potentials was observed within the frequency range from 6 to 20 Hz, whereas a weaker response was reported at around 40 Hz. Many researchers utilized fMRI technique in which blood oxygenation level dependent signals (BOLD) are acquired to study a correlation between amplitude of vascular response and frequency of flickering stimulus [7–13]. Similar studies were performed also with the PET technique [14,15], where regional cerebral blood flow (rCBF) was indirectly measured by monitoring of radionuclid (H2150) uptake. All these studies demonstrate a steady increase in the amplitude of the cortical response up to 8 Hz and a decrease or plateau for higher stimulation frequencies. A different tendency is showed in studies carried out by Emir et al. [16] using fMRI. The first peak in BOLD signal amplitude was observed at 8 Hz and next peaks for stimulation frequencies at 16 and 24 Hz. Furthermore, Parkes et al. [17] used periodic and aperiodic checkerboard flashes at the range of frequencies from 4 to 20 Hz. They found that for frequencies of 10 Hz and 15 Hz the aperiodic stimulus induced a greater BOLD response in comparison with periodic paradigm. Kaufmann et al. [7] reported that the BOLD signal amplitude increases similarly in groups of men and women up to 8 Hz with a plateau above this frequency. The amplitude is about 30% lower in woman than in men at frequencies of 4, 8 and 12 Hz.
Near-infrared spectroscopy (NIRS) is a non-ivansive brain imaging method that measures light absorption at numerous wavelengths and can detect changes in oxygenated and deoxygenated hemoglobin concentration. The advantages of the NIRS technique over other neuroimaging methods is its non-invasiveness, ease of application at the bedside and ability to monitor both forms of hemoglobin (oxygenated and deoxygenated) [18,19] . NIRS has been applied to study the effects of visual [20,21], auditory [22,23], and motor stimuli [24] to identify areas of the brain associated with a certain cognitive function [25,26]. The NIRS technique may provide also a topographic distribution of cortical responses and can be applied in assessment of cortical hemodynamic reactions in freely moving subjects [27]. High density diffuse optical tomography systems allow to image the brain cortex with high spatial resolution overlapping with fMRI [28,29]. Takahashi et al. [30] applied a near infrared spectroscopy technique for an estimation of changes in oxy- and deoxyhemoglobin concentrations at different frequencies of visual stimulus. Surprisingly, the reported changes did not follow patterns reported in studies carried out using other neuromonitoring techniques. Toronov et al. [31] conducted measurements simultaneously with the use of fMRI and NIRS during visual stimulation. The stimulation was induced by checkerboard pattern reversing at three frequencies (1, 2 and 6 Hz). They found that time-courses of changes in oxy-, deoxy, and total hemoglobin concentration are highly correlated with the BOLD responses. Moreover, the highest hemodynamic response and area of activation was observed at a checkerboard flickering frequency of 6 Hz.
The aim of the present study is to investigate the influence of variable visual stimulus frequency on the amplitude and spatial distribution of hemoglobin concentration changes with the use of NIRS technique. We will use a high density diffuse optical tomography (HD-DOT) technique which allows to measure changes in oxy- and deoxyhemoglobin by monitoring changes in amplitude of optical signals at two wavelengths. Furthermore, the measurements for multiple source-detector pairs distributed on a defined area of the head enable to create activation maps. Moreover, measurements carried out at different source-detector separations can provide not only the spatial distribution of hemoglobin changes, but also allows to separate extra- and intracerebral signals. Classical NIRS technique is used for monitoring the hemodynamic responses at several spots on the surface of the brain cortex [32]. Low resolution topography images of the brain cortex activity can be also obtained with this technique [32]. In the present study an advanced high-density NIRS method, similar to the one reported recently by Eggebrecht et al. [33], will be applied. We will show that the HD-DOT technique can be successfully applied in such studies and does not suffer from restrictions related to immobilization and positioning of the subject in fMRI scanner tunnel. Thus, we will show that HD-DOT can be used for studies leading to better understanding of the relationship between visual stimulus frequency and amplitude of functional response and can help to select the checkerboard flickering frequency for future optimized fNIRS protocols. In the paper, two names of frequencies were used and should be distinguished. The visual stimulation frequency was calculated based on block design protocol (sum of time period: 15 seconds of stimulation and 30 seconds of rest). Whereas, the flickering frequency is related to contrast reversals between black and white checkers and it is ranging from 4 to16 Hz.
2. Methods
2.1. Measurement system
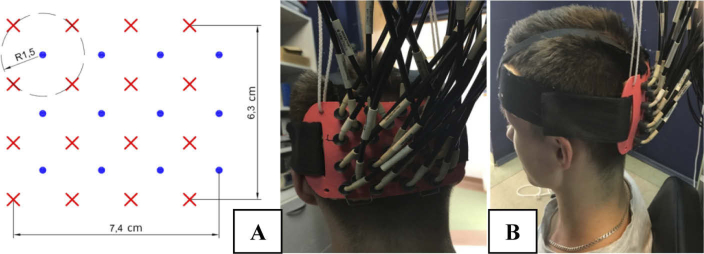
The cortical activity was recorded with a continuous wave HD-DOT system. This instrument collects optical signals at wavelengths of 750 nm and 850 nm for a set of 16 sources and 12 detectors and allows to acquire data from a dense mesh of sources and detectors located on a head’s surface. The system records signals for all combinations of source-detector pairs within the mesh. The pairs are distinguished by modulation of the intensity of sources at different frequencies (frequency coding) and sequential switching of the sources (spatial coding). Due to a high dynamic range of photodetecting systems based on avalanche photodiodes, signals of diffuse reflectance can be acquired at source-detector separations between 1.5 cm and 9 cm [34]. Changes in the light intensities corresponding to all combinations of 12 detectors and 16 sources (384 source-detector pairs at 2 wavelengths) can be registered with the 15.25 Hz repetition rate. Light was transmitted from sources to the tissue and from the tissue to detectors using fiber optic bundles. The optical fiber bundles were build based on our design by the CeramOptec (Germany). The length is 8 meters long and the diameter of the active area is 2.5 millimeters. Source bundles are furcated close to the emission module and deliver the light at two wavelengths to an individual emission point on a head. The ferrules placed on the head are 3D-printed using the ABS-plastic. Moreover, a plastic cap was designed to allow quick mounting of all fibers and brushing the tips of the fiber bundles through the hair. The fibers are divided into groups and mounted in a circular ring in order to reduce the weight of the cap above the subject. The optical fibersbundles fixing system including 12 detecting fiber bundles and 16 source fibers was positioned on the surface of the head above the occiput symmetrically on both hemispheres as shown in Fig. 1. The inion was used as a landmark to center vertically the plastic pad. The center of the plastic pad was located around 2 cm above this point. Additionally, the distance between nasion and top optode row was measured to preserve repeatable positioning between sessions of measurements.
Fig. 1.
Geometry of the pad (A) and its location on the head surface (B).
The visual stimulus presentation was synchronized with acquisition of the light attenuation data by simultaneous recording of a TTL-trigger signal generated by HD-DOT system and an electrical signal, sent via audio input, which triggered periods of the visual stimulation. A LabView (National Instruments, USA) application was developed allowing for acquisition of these signals together with signals from photodetector (PDA36A-EC, Thorlabs, USA) mounted in front of the screen (20.1 Inch Sony SDM- S205K LCD Display, Japan) using analog-digital converter card National Instruments Card USB-6211(NI, USA).
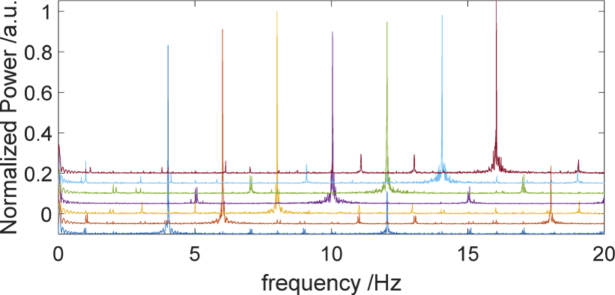
The 20.1 inch LCD screen refresh frequency was set at 60 Hz (SDM- S205K, Sony, Japan). The stimulus was generated using the custom-designed software. The physical ability of the screen to present checkerboard contrast-reversing of various frequencies was validated by acquision of the signal with the photodetector located on the screen. The signals were analyzed in Matlab environment (Mathworks, USA). In Fig. 2, a strong peak for a given checkerboard flashing frequency and smaller peak at first harmonics can be observed. This result confirms that the visual stimulus was presented with proper checkerboard flickering frequency.
Fig. 2.
The frequency spectra corresponding to measurements of checkerboard flickering frequency. The frequency spectra were shifted by 0.05 vertically in order to achieve the better visibility.
2.2. Experimental protocol
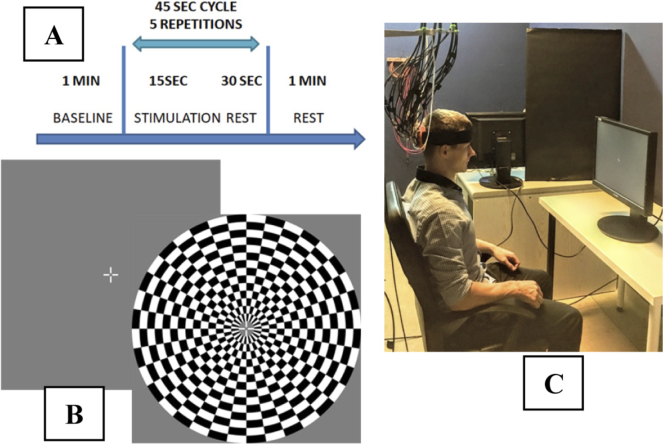
The stimulation of visual cortex was induced by a checkerboard contrast-reversing at the frequencies of 4 to 16 Hz with 2 Hz steps. The contrast-reversing frequency used in the measurement session was selected in a randomized order. The subjects were not informed at which frequency the checkerboard flickers in current measurement. Each measurement consisted of four blocks: 60 seconds of baseline, 5 repetitions of 15 seconds of stimulation preceded by 30 seconds of rest and 60 seconds of rest at the end.
The length of stimulation period was selected based on measurements conducted by Wobst et al. [35]. Moreover, we conducted our own measurements for a different stimulation time period from 30 to 15 seconds in order to assess the magnitude of the hemodynamic response and try to reduce the duration of experimental protocol as much as possible. The stimulation of visual cortex was induced by blinking checkerboard at the frequency of 8 Hz with 5 repetitions of 30, 20, 15-second stimulations separated by 30-second of rest. Because the observed amplitudes of hemodynamic responses did not differ significantly, we decided to use 15 seconds long stimulation period, what enabled us to shorten and optimize the experimental protocol.
The total duration of each measurement was 5 min and 45 s. Participants had a 5 minute break after each stimulation cycle. The measurements were performed in a sitting position, with both eyes open (binocular observation). The head of the subject was located at the distance of 65 cm from a 20.1-inch screen (Fig. 3(C)). The diameter of the flashing checkerboard was 29 cm. Since our experimental procedure requires stable eye fixation, a cross hair (2 by 2 cm) with a central gap was presented in the middle of the screen during the whole experiment [36]. Studies were performed in a quiet and dark room. Volunteers were instructed to maintain visual fixation at the white cross hair (Fig. 3(B)). The stimulation protocol needs long term gaze focus, therefore, the experiment was divided into two sessions –3 measurements in first session and 4 measurements in second session. After each measurement the perception of the illusions after stimulation was assessed by asking the volunteers to describe what they had seen during the rest periods between the stimulation periods.
Fig. 3.
Experimental design showing the measurement protocol (A), the patterns of visual stimulus (B) and the measurement stand (C).
2.3. Data processing
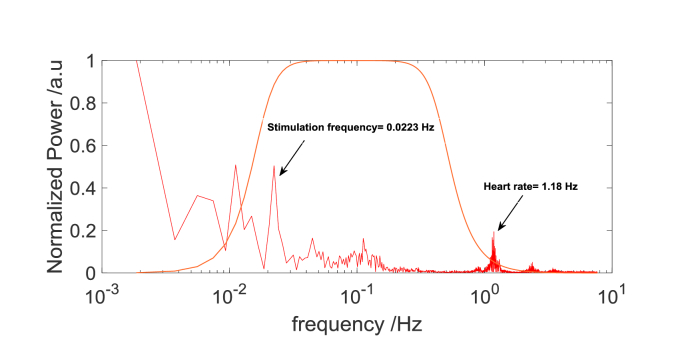
The signals of light intensity acquired for each person and stimulation frequency was analyzed separately. The analysis was carried out in MATLAB environment (Mathworks, USA). First, based on spectral analysis of the signal (Fig. 4), the low frequency drift was removed using a zero phase digital high-pass filter (0.018 Hz cutoff). An average of all light intensity measurements obtained from all source-detector pairs at distance 1.5 cm (related to the changes in scalp and skull) was removed from source-detector pair data by linear regression [37,38]. Next, a zero phase digital low pass filter (0.5 Hz cutoff) was used to remove physiological components of the signal including a heart beating frequency. Furthermore, for each source-detector pair a ratio of standard deviation and mean of the baseline signal was calculated. The signals for which this ratio was greater than 10% were excluded from further analysis.
Fig. 4.
The frequency spectra of signals of light intensity (detector output) for selected source-detector pair at the source-detector distance of 3.4 cm for 850 nm. The first peak marked with arrow is related to stimulation frequency (1/45 seconds) and its surrounded by noise. The second peak marked with arrow corresponds to heart rate. The orange lines show the frequency response of the highpass and lowpass filter.
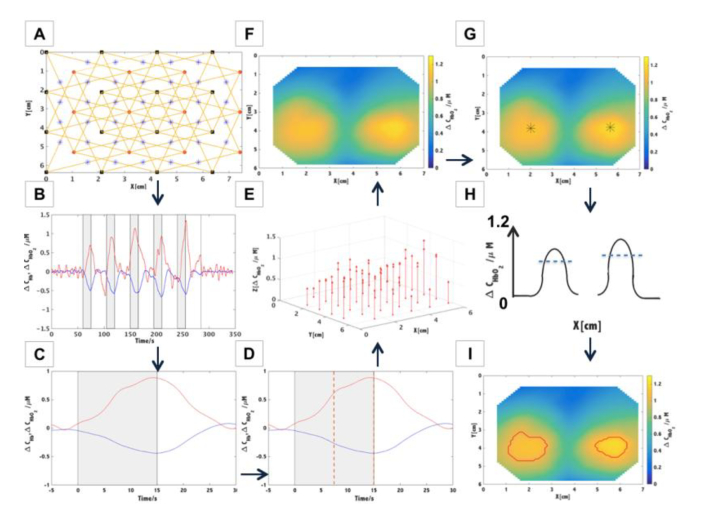
Next, the signals of light intensity changes were converted to hemoglobin concentration changes using the modified Beer-Lambert law and extinction coefficients taken from [39]. The optical pathlength was taken as the product of the differential pathlength factor (DPF) and the selected source-detector distance. For these calculations it was assumed that DPF = 6 [40]. The obtained changes in hemoglobin concentrations were averaged for each cycle: rest before the stimulation period, stimulation period itself and rest after the stimulation period. Afterwards, the results were normalized by subtracting average rest value. For each source-detector pair, the amplitudes of changes in concentration (ΔCHb and ΔCHbO2) related to visual stimulus were determined by taking the median value of the last 7.5 seconds of 15 seconds stimulation period (during this time period, the changes reached a plateau- Fig. 5(D)).
Fig. 5.
Schematic of the data analysis algorithm. A. Preparing the set of sources (x,y) and detectors (x,y) coordinates and indication of the set of source- detector couples at selected source-detector separation (in this example 3.4 cm). The midpoints between source and detector position were marked with blue stars. B. Calculation of hemoglobin concentration changes for a selected source-detector pair. C. Block averaged changes in concentration of oxy- and deoxyhemoglobin. D. Calculation of the median value of the last 7.5 seconds of 15-seconds long stimulation period (marked with orange dashed lines). E. Assignment of the values of amplitudes of the oxyhemoglobin concentration changes to the positions of midpoints between source and detector positions. F. Visualization of spatial distributions of the oxyhemoglobin concentration changes with the use of interpolation - triangulation-based cubic technique. G. Calculation of the maximum amplitude of hemoglobin changes for each hemisphere. The maximum is marked with black star. H. The blue dashed line indicates the threshold representing 75% of the amplitude of hemoglobin change for each hemisphere. The image shows activation map (F) in cross section. I. Visualization of spatial distributions of the oxyhemoglobin concentration changes, where the area of the stimulation is marked with a red line.
In order to visualize spatial distributions of the changes related to the stimulus, amplitudes of signals changes acquired at a defined source-detector separation were assigned to the position of a midpoint between source and detector. Furthermore, the spatial distributions were obtained by interpolation using triangulation-based cubic technique. The stimulation areas were considered as regions where the amplitude of change in hemoglobin concentration was exceeding a defined threshold. The threshold was taken as 75% of the maximum of amplitude of hemoglobins changes ΔCHbO2 and ΔCHb. The effects of stimulation were visible in both left and right hemispheres and the maximum in ΔCHbO2 and ΔCHb were calculated for each side separately. The amplitudes of changes in concentration of hemoglobin obtained from each area of stimulation were then used for comparison between all subjects for each checkerboard flickering frequency. Furthermore, a spectral analysis was carried out of a non-averaged signals of hemoglobin changes for various source-detector separations (1.5, 3.4, 4.5 and 5.4 cm) in order to compare the amplitude of change.
2.4. Participants
The group of 8 healthy volunteers (3 man and 5 women) were recruited. Age of volunteers ranged from 22 to 40 with median age 28. The exclusion criteria (based on medical interview) included systemic diseases, neurological disorders and major visual impairment such as strabismus, amblyopia, nystagmus, age-related macular degeneration (AMD) or high and uncorrected refractive errors. All volunteers with minor visual acuity deficits were asked to bring their glasses or contact lenses and wear them throughout the whole process of measurement. Before the experiments the volunteers were introduced with the stimulation protocol and informed on potential reactions to the checkerboard contrast-reversing procedure. All volunteers provided a written consent before participation and were treated in accordance with the Declaration of Helsinki. Ethical approval was obtained from the Commission of Bioethics at Military Institute of Medicine, Poland (permission no.90/WIM/2018) before commencing the study.
2.5. Statistical analysis
Changes in concentrations of oxy and deoxy hemoglobin obtained for various checkerboard flickering frequencies were used as dependent variables. For all statistical analyses, p value of 0.05 was used as the cut off for significance. Normality of distribution and homogeneity of variances of the variables were verified by using a Shapiro–Wilk test with a Lilliefors correction and Mauchley’s test. The assumption of normal distribution was rejected, therefore ANOVA Friedman’s test was applied for the model consisting of data from 8 healthy volunteers, 7 checkerboard flickering frequencies (4/6/8/10/12/14/16 Hz) and 2 chromophore concentrations (oxy- and deoxy-hemoglobin). Significance of differences between changes in chromophores concentrations were analyzed using a Wilcoxon signed-rank post-hoc test with a Bonferroni adjustment. The significance level for post hoc test was set to p post_hoc <0.007. The changes of area of the stimulation for different flickering frequencies were compared as well with ANOVA Friedman’s test. The relationship between frequency and changes in concentrations of oxy- and deoxy-hemoglobin was tested using a non parametric (Spearman) correlation. All statistical analyses were performed using the Statistica 10 Software (StatSoft, Inc., Tulsa, USA).
3. Results
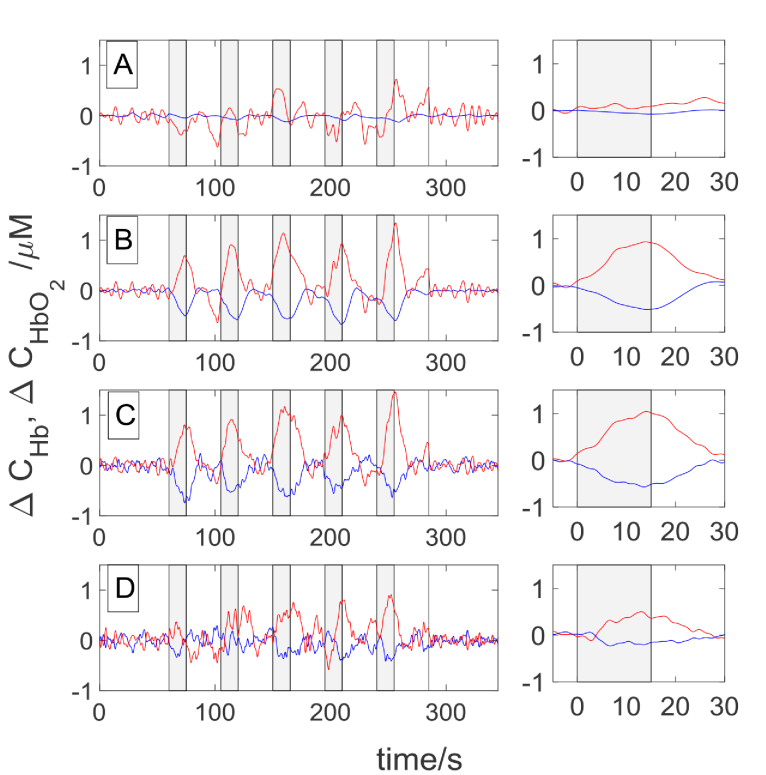
The signals of changes in hemoglobin concentrations obtained in Subject 1 during a visual stimulation carried out with a flickering frequency of 8 Hz are presented in Fig. 6. Signals revealing reactions to consecutive cycles of the measurement are shown in the left column, whereas the time courses of changes in oxy- and deoxyhemoglobin concentrations averaged from all 5 cycles of the task are presented in the right column. As expected, an increase in oxyhemoglobin and a decrease in deoxyhemoglobin concentration are observed during the visual stimulation period. In the non-averaged signals every repetition of stimulation can be distinguished in concentration changes of both forms of hemoglobin. This effect can be noted for signals acquired at source-detector separations of 3.4 cm, 4.5 cm and 5.4 cm. Such changes cannot be observed at source-detector separation of 1.5 cm. Amplitude of changes in hemoglobin concentrations are high for source-detector separations of 3.4 cm, 4.5 cm whereas at 5.4 cm the amplitude is reduced.
Fig. 6.
The signals obtained for Subject 1 during visual stimulation for flickering frequency 8 Hz at the source-detector distance of 1.5 cm (A), 3.4 cm (B), 4.5 cm (C) and 5.4 cm (D). Grey highlighted rectangles indicate the stimulation periods. The colors correspond to oxyhemoglobin (red) and deoxyhemoglobin (blue) concentrations. In the right column the signals averaged for the five cycles of measurement were presented.
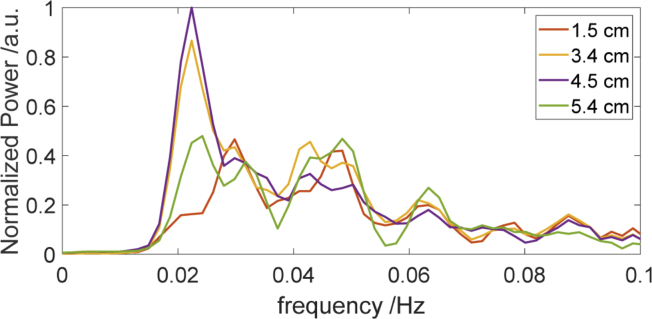
Results of spectral analysis of the signals acquired during visual stimulation (Fig. 7) show the different amplitudes of oxy hemoglobin concentration changes for different source-detector distances. The frequency spectra (Fig. 7) were obtained for the signals of oxyhemoglobin for the different source-detector separations and for selected source-detector pairs for which the amplitudes of changes are maximal.
Fig. 7.
The frequency spectra of ΔCHbO2 signals for selected source-detector pairs at the source-detector distances of 1.5 cm, 3.4 cm, 4.5 cm and 5.4 cm (respective time traces are shown in the Fig. 6.) The first strong peak is related to visual stimulation frequency (1/45 sec = 0.0223 Hz). The time period of 45 seconds is related to duration one block of rest and stimulation.
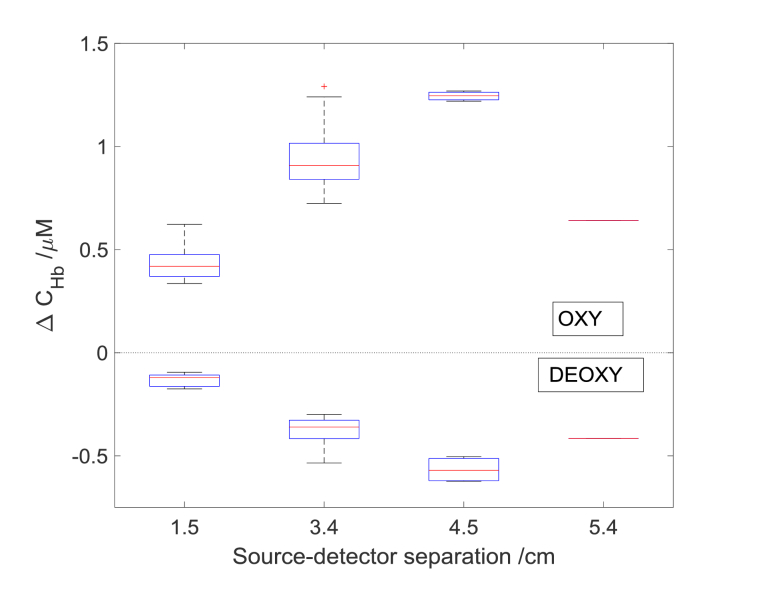
In Fig. 8 the hemoglobins concentration changes as a function of source detector separations for checkerboard flickering frequency 8 Hz were presented. The calculated before areas of stimulation (see areas marked by red lines in Fig. 5) were used to calculate the values of amplitude of hemoglobins changes for various source detector separations. The amplitude has increased with an increase of source-detector separation up to 4.5 cm, furthermore, it decreased for 5.4 cm. The lowest amplitude of changes was noted for source-detector separation 1.5 cm. For every source-detector pair the amplitudes of change in oxy- and deoxyhemoglobin at 3.4 cm and 4.5 cm were higher in comparison with the results obtained at source-detector distance 1.5 cm. The highest amplitudes of hemoglobins changes among the different source detector separation were obtained at the distance of 4.5 cm.
Fig. 8.
Averaged amplitudes of changes in concentrations of oxy- and deoxy-hemoglobin from area of stimulation as a function of source detector separation for one subject at the checkerboard reversing frequency of 8 Hz. A central red line in each box corresponds to the median, lower and upper boundary of the box correspond to 25th (q1) and 75th (q3) percentiles respectively and the whiskers represent interquartile range.
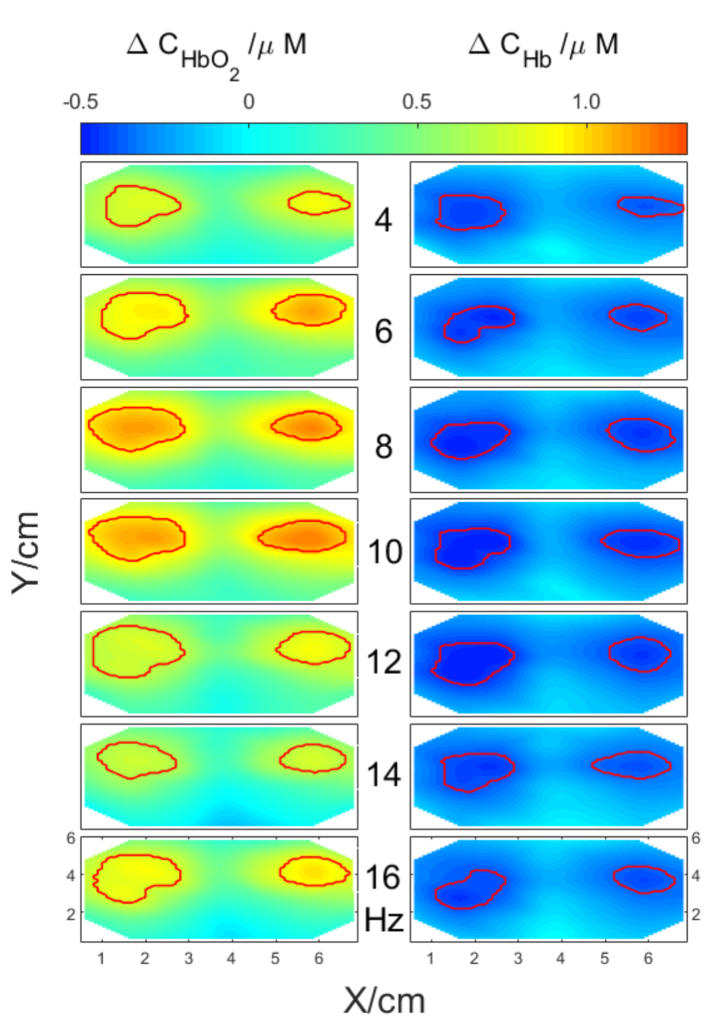
For a selected subject and a selected source-detector separation of 3.4 cm spatial distributions of averaged oxy- and deoxy hemoglobin concentration changes were computed and are presented in Fig. 9. For this source-detector separation the greatest number of source–detector pairs is available for analysis considering the pad’s geometry. The spatial distributions of changes in hemoglobin concentrations were presented for different flickering frequencies ranging from 4 Hz to 16 Hz. The area of stimulation is marked with red lines and was calculated based on algorithm described in Paragraph 2.3.
Fig. 9.
Spatial distributions of averaged changes in concentrations of oxy- and deoxy-hemoglobin related to visual stimulation for different frequencies of checkerboard contrast-reversing (from 4 Hz to 16Hz). Red lines mark areas of high stimulation amplitude.
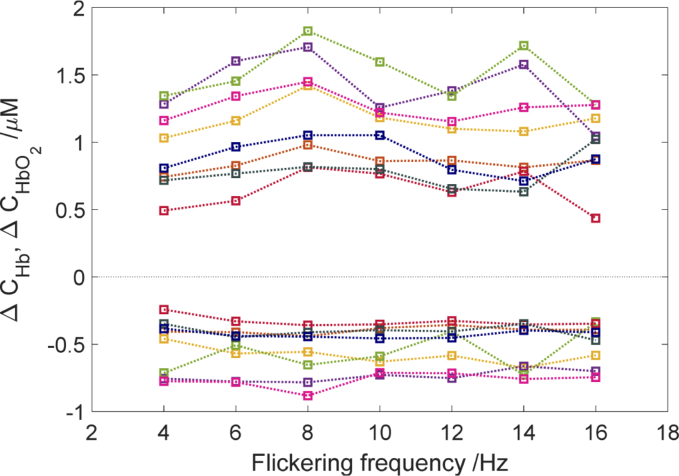
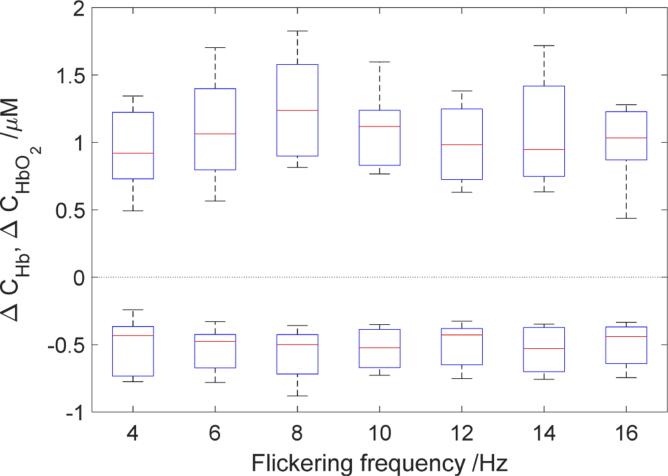
Since there were minor differences between sides (left and right hemisphere) in amplitudes of oxy- and deoxy hemoglobin changes, the averaged data from both sides were used for further analysis. The amplitudes of oxy and deoxy hemoglobin changes at different checkerboard flickering frequencies for each subject are illustrated in Fig. 10 and 11. In Fig. 10. similar trend of amplitude changes from 4 to 8 Hz for the whole group is observed. After that the second peak is observed for 14 Hz or 16 Hz is some of the subjects. The flickering frequency had a statistically significant effect on oxyhemoglobin concentration changes χ2(6) = 23.035, (p < 0.001). However, no statistically significant effect was observed for deoxyhemoglobin changes χ2(6) = 7.82, (p > 0.05). Our results demonstrate that the amplitude of oxyhemoglobin change for checkerboard flickering frequency 8 Hz is significantly different in comparison with some of the adjacent frequencies (Fig. 10). The amplitude of oxyhemoglobin concentration change at checkerboard flickering frequency of 8 Hz was higher in comparison with that noted at 4 Hz [medians (25th–75th percentiles) [1.24 (0.94–1.71) vs. 0.92 (0.73–1.28) µM, p < 0.001]; 12 Hz:[1.24 (0.94–1.71) vs. 1.04(0.78–1.32) µM, p < 0.001]; and 16 Hz:[1.24 (0.94–1.71) vs. 1.15(0.87–1.48) µM, p < 0.001]. As shown in averaged data (Fig. 11.) the amplitude of changes in oxyhemoglobin concentration rises steadily up to 8 Hz and then decreases to 12 Hz. There was no statistically significant correlation between amplitudes of changes in oxy- (r = 0.23, p >0.05). and deoxyhemoglobin (r = 0.04, p > 0.05) concentrations with flickering frequency.
Fig. 10.
Comparison of averaged amplitudes of oxy- (positive changes)— and deoxy hemoglobin (negative changes) concentration changes as a function of checkerboard flickering frequency. The symbols of different colors correspond to the averaged changes in hemoglobin concentrations obtained for eight subjects calculated from the area of stimulation. The dashed lines have been added in order to facilitate trend focusing. Note that the lines connecting data points are a guide to the eye only.
Fig. 11.
Averaged amplitudes of oxy- (positive changes) and deoxyhemoglobin changes (negative changes) as a function of flickering frequency. A central red line in each box corresponds to the median, lower and upper boundary of the box correspond to 25th (q1) and 75th (q3) percentiles respectively and the whiskers represent interquartile range.
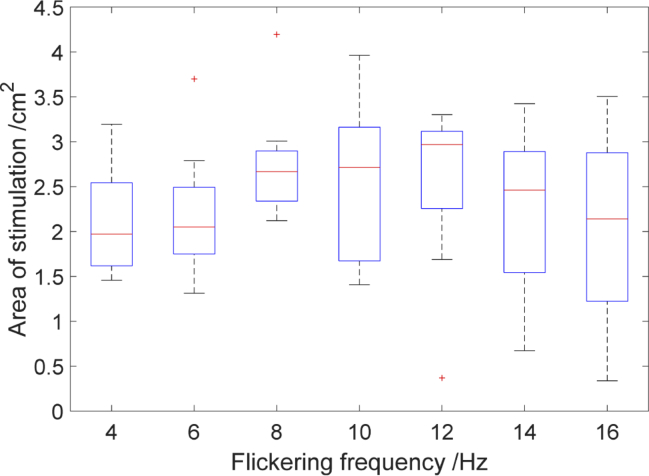
In Fig. 12 the size of the area of stimulation as a function of checkerboard flickering frequency for 8 subjects were shown. The biggest area of stimulation was noticed for the frequency of 8Hz [medians (25th–75th percentiles) [2.66(2.33–2.89) cm2], 10 Hz [2.71(1.67–3.19) cm2], 12 Hz [2.96(2.25–3.11) cm2]. However, no statistically significant differences in the dimension of area of stimulation obtained for different checkerboard frequencies was observed χ2(6) = 8.83, (p > 0.05).
Fig. 12.
Size of the stimulation area as a function of checkerboard flickering frequency. The central red line in each box corresponds to the median, lower and upper boundary of the box correspond to 25th (q1) and 75th (q3) percentiles respectively and the whiskers represent interquartile range.
During the measurements most subjects reported perceiving various forms of illusions like dots, circles, stars and stripes. These illusions were reported for the whole range of checkerboard flickering frequency after the stimulus disappeared from the screen.
4. Discussion and conclusions
The main aim of this study was to investigate the influence of flickering frequencies of visual stimulus in the range 4–16 Hz on amplitudes and spatial distributions of changes in hemoglobin concentration at various source-detector separations. The use of HD-DOT method allowed to derive spatial distributions of hemoglobin concentration changes in the visual cortex, which was not evaluated with NIRS for such wide range of flickering frequencies. Our results demonstrate, that the checkerboard flickering frequency has significant effect on oxyhemoglobin concentration changes. This dependence was not statistically significant for changes in deoxyhemoglobin concentration. In all subjects we observed an increase in the oxyhemoglobin and a decrease in the deoxyhemoglobin during checkerboard-reversing visual stimulation in respect to the rest period in which a grey screen was presented to the subject (see Fig. 5). Our results are in agreement with results obtained with a similar approach with the use of high density optical imaging [33,38].
As expected the highest amplitude of oxy hemoglobin concentration changes was observed at the checkerboard flickering frequency of 8 Hz (see Fig. 10 and 11). A similar phenomenon has been reported for the visual stimulation with the use of checkerboard contrast-reversal in CBF signals obtained by PET [41] and BOLD signals obtained by fMRI technique [11,12]. Many authors report that the BOLD signal increases with stimulation frequency and reaches a plateau at 8 to 12 Hz or higher frequencies, which is called the saturation effect. Moreover, we observed the second peak for checkerboard flickering frequency of 16 Hz for four out of eight healthy volunteers. This observation is in agreement with results of the study reported by Emir et al. [16] in which the second and third peak at 16 Hz and 24 Hz were observed. Parkes et al. also showed that during periodic stimulation the BOLD signal was reduced for frequency range from 10Hz to 15 Hz [17]. This difference in response to flickering frequency stems from the fact that the length, type of stimulation and measured area was different.
We observed the highest amplitude of hemoglobin concentration changes at the source-detector distance of 4.5 cm (see Fig. 7 and Fig. 8), which supports the expectation that a greater distance between source and detector allows the light to penetrate the head tissues more deeply. Moreover for such large interoptode distance a larger area of the cortex is penetrated by the photons and the sensitivity of measurement changes in absorption of tissue located in the cortex is improved [42,43]. We did not observe changes in hemoglobin concentration related to the visual stimulation at the source-detector distance of 1.5 cm. It can be explained by the fact that at the short source-detector distance themeasurement sensitivity to changes in absorption occurring in the grey matter region a is too low to register changes related to the activation [37,44].
We observed the biggest area of stimulation for frequency level 8 Hz,10 Hz and 12 Hz, but the differences in the size of the area of stimulation for various flickering frequency were not statistically significant (see Fig. 12). Furthermore, we check if the contrast to noise ratio (CNR) have an impact on the evaluation of the activation area. Analysis shows that the CNR change is not enough to influence the activation area estimation. Toronov et al. conducted similar measurements during visual stimulation with the use of NIRS and fMRI technique [31]. The BOLD signal change are more in line with oxy- and total hemoglobin concentration changes in comparison with deoxy-hemoglobin. The smallest activation area was reported at checkerboard flickering frequency of 1 Hz, and the largest at 6 Hz for both imaging techniques. In the study by Singh et al. [12]. the biggest area of activation was noted at 8 Hz. For higher frequencies the area of activation decreases slowly.
The mode of stimulus presentation may have significant influence on the visual cortex response. Wijeakumar et al. [45] performed the visual stimulation with the use of frequency-domain multidistance near infrared tissue oximetry (FDMD NIRS) in three different modes: contrast reversal at the frequency of 7.5 Hz, ON/OFF presentation and a static checkerboard. They observed changes for all three stimulus presentations but, a dynamic pattern presentation produce larger hemodynamic responses. Moreover, Parkes et al. [17] found out that for frequencies of 10 Hz and 15 Hz the aperiodic stimulus induced a greater BOLD response in comparison with periodic paradigm.
The visual stimulation paradigm was applied to validate usefulness of neuroimaging methods like PET [14] and fMRI in neurophysiological studies [46]. The results of imaging human visual cortex were well described in adults [47] and infants [48,49]. Interpretation of retinotropic maps is simpler in comparison with regions of the brain that are responsible for higher cognitive function. It is expected that information on respositivity of visual cortex to functional stimulation can be used for clinical diagnosis of neurological disorders and monitoring of a course of disease. In comparison with previously mentioned neuroimagimng methods, NIRS technique shows particular potential of such diagnostic approach because of rather simple instrumentation and ease of its utilization in clinical populations. Processing of visual stimulus from eye to the cortex is a complicated process. In many diseases the visual pathway is damaged or is at risk of injury, which may cause visual impairment or blindness. Ward et al. [50] conducted the measurement with FDMD NIRS to indicate the influence of glaucoma and snoring on cerebral oxygenation. They found that glaucoma patients and snores showed the attenuated hemodynamic response in primary visual cortex. Interestingly, an opposite effect on cerebral oxygenation was found by Aitchison et al. [20], during the measurements of visual cortical oxygenation in diabetic patients in which a statistically significant higher amplitude of the hemodynamic response was noted in diabetic patients than in non-diabetic group.
Human visual system has limited temporal and spatial resolutions. Critical flicker fusion frequency (CFF), the frequency at which the flickering light is perceived as to be completely steady, is widely used for evaluating temporal processing in visual system [51]. The CFF may be affected by a number of physical factors such as stimulus luminance [51,52], color [52], size, retinal eccentricity [51] as well as diseases e.g. hepatic encephalopathy [53], multiple sclerosis [54] or eye diseases such as age related macular degeneration), cataract [55], glaucoma [56,57] or amblyopia [58]. For healthy humans, critical flicker fusion frequency is typically between 40 Hz and 60 Hz [51,59] – in a range of frequencies much higher than frequency stimulation used in our study (between 4 Hz and 16 Hz). Thus, for the whole range of frequencies used in our stimulation volunteers reported perception of the flickering.
During the rest period between the cycles of checkerboard flicker stimulation, some volunteers reported optical illusions such as wave interference, rotating stripes, stars and dots. It is well known that the presence of flicker may affect visual perception. Especially, the flickering light may evoke color illusions [60], illusory visual objects [61] or alter brightness of light (Brucke–Bartley effect) [62]. Herrmann et al. also reported illusions in form of stars or stripes as well as color illusions at frequencies between 12 and 16 Hz [3]. Moreover, Herrmann et al. found that for flickering frequencies lower than 40 Hz all of the investigated volunteers reported experiencing both form and color illusions [40]. The authors concluded that flickering of monochromatic light (white LEDs) is sufficient to induce perceptual phenomena analogous with Fechner’s colors [40]. Thus, based on above findings, one may expect that any rhythmic stimulation of visual system may induce optical illusions, especially for stimulation frequencies below the critical flicker fusion threshold.
The researchers are struggling with a convenient frequency choice. In most of the reported NIRS measurement protocols the frequency choice was based on previous fMRI studies. Typically, checkerboard flickering frequency of 8 Hz is considered as an optimal frequency for visual stimulation paradigm. However, in the study by Ozus et al. [11] it is suggested that flickering frequency of 4 Hz was optimal. This result was supported by the research by Hoge et al. [10], in which BOLD fMRI visual response of high stability was was obtained at flicker frequency of 4 Hz. Furthermore, this flickering frequency of 4 Hz was successfully used in fNIRS studies [63]. Our results might give a rise to an assumption that with the use of 4 or 6 Hz flickering frequency it is possible to obtain the visible response, as shown in the Fig. 8.
Monitoring and imaging of the visual cortex oxygenation during flickering stimulation may provide a clinically valuable information about the neural processing of visual inputs in many conditions associated with optic nerve or visual pathway dysfunction (e.g. glaucoma, multiple sclerosis) or abnormal higher cortical processing (e.g. amblyopia). Moreover, HD-DOT with its non-invasiveness and ease of application at the bedside, make this method potentially useful in evaluating the neural responses to visual stimulation in infants or uncooperative patients, where often more informations are needed in order to better diagnose the observed visual deficits during routine eye examination. Visual stimulations are used in therapy of hemianopic stroke patients [64]. We show that the flickering frequencies can be used to modulate strength of the brain response and as such utilized in neuro-rehabilitation or give a basic human-computer interface.
Funding
Narodowe Centrum Nauki10.13039/501100004281 (2016/21/N/ST7/03117, 2012/05/B/ST7/01162); H2020 Marie Skłodowska-Curie Actions10.13039/100010665 (675332).
Disclosures
The authors declare that there are no conflicts of interest related to this article.
References
- 1.Regan D., “Human brain electrophysiology: evoked potentials and evoked magnetic fields in science and medicine,” (1989).
- 2.Wolf M., Wolf U., Toronov V., Michalos A., Paunescu L. A., Choi J. H., Gratton E., “Different time evolution of oxyhemoglobin and deoxyhemoglobin concentration changes in the visual and motor cortices during functional stimulation: a near-infrared spectroscopy study,” NeuroImage 16(3), 704–712 (2002). 10.1006/nimg.2002.1128 [DOI] [PubMed] [Google Scholar]
- 3.Herrmann C. S., “Human EEG responses to 1–100 Hz flicker: resonance phenomena in visual cortex and their potential correlation to cognitive phenomena,” Exp. Brain Res. 137(3-4), 346–353 (2001). 10.1007/s002210100682 [DOI] [PubMed] [Google Scholar]
- 4.Meek J., Elwell C., Khan M., Romaya J., Wyatt J., Delpy D. T., Zeki S., “Regional changes in cerebral haemodynamics as a result of a visual stimulus measured by near infrared spectroscopy,” Proc. R. Soc. London, Ser. B 261(1362), 351–356 (1995). 10.1098/rspb.1995.0158 [DOI] [PubMed] [Google Scholar]
- 5.Wells E. F., Bernstein G. M., Scott B. W., Bennett P. J., Mendelson J. R., “Critical flicker frequency responses in visual cortex,” Exp. Brain Res. 139(1), 106–110 (2001). 10.1007/s002210100721 [DOI] [PubMed] [Google Scholar]
- 6.Fox P. T., Raichle M. E., “Stimulus rate dependence of regional cerebral blood flow in human striate cortex, demonstrated by positron emission tomography,” J. Neurophysiol. 51(5), 1109–1120 (1984). 10.1152/jn.1984.51.5.1109 [DOI] [PubMed] [Google Scholar]
- 7.Kaufmann C., Elbel G. K., Gössl C., Pütz B., Auer D. P., “Frequency dependence and gender effects in visual cortical regions involved in temporal frequency dependent pattern processing,” Hum. Brain Mapp. 14(1), 28–38 (2001). 10.1002/hbm.1039 [DOI] [PMC free article] [PubMed] [Google Scholar]
- 8.Bayram A., Bayraktaroglu Z., Karahan E., Erdogan B., Bilgic B., Özker M., Kasikci I., Duru A. D., Ademoglu A., Öztürk C., “Simultaneous EEG/fMRI analysis of the resonance phenomena in steady-state visual evoked responses,” Clin EEG Neurosci 42(2), 98–106 (2011). 10.1177/155005941104200210 [DOI] [PubMed] [Google Scholar]
- 9.Hagenbeek R., Rombouts S., Barkhof F., “Interindividual differences in stimulus response curve in the striate cortex as a function of flicker frequency: an FMRI study,” NeuroImage 13(6), 981 (2001). 10.1016/S1053-8119(01)92319-5 [DOI] [Google Scholar]
- 10.Hoge R. D., Atkinson J., Gill B., Crelier G. R., Marrett S., Pike G. B., “Stimulus-dependent BOLD and perfusion dynamics in human V1,” NeuroImage 9(6), 573–585 (1999). 10.1006/nimg.1999.0443 [DOI] [PubMed] [Google Scholar]
- 11.Ozus B., Liu H.-L., Chen L., Iyer M. B., Fox P. T., Gao J.-H., “Rate dependence of human visual cortical response due to brief stimulation: an event-related fMRI study,” Magn. Reson. Imaging 19(1), 21–25 (2001). 10.1016/S0730-725X(01)00219-3 [DOI] [PubMed] [Google Scholar]
- 12.Singh M., Kim S., Kim T. S., “Correlation between BOLD-fMRI and EEG signal changes in response to visual stimulus frequency in humans,” Magn. Reson. Med. 49(1), 108–114 (2003). 10.1002/mrm.10335 [DOI] [PubMed] [Google Scholar]
- 13.Srinivasan R., Fornari E., Knyazeva M. G., Meuli R., Maeder P., “fMRI responses in medial frontal cortex that depend on the temporal frequency of visual input,” Exp. Brain Res. 180(4), 677–691 (2007). 10.1007/s00221-007-0886-3 [DOI] [PMC free article] [PubMed] [Google Scholar]
- 14.Fox P. T., Miezin F. M., Allman J. M., Van Essen D. C., Raichle M. E., “Retinotopic organization of human visual cortex mapped with positron-emission tomography,” J. Neurosci. 7(3), 913–922 (1987). 10.1523/JNEUROSCI.07-03-00913.1987 [DOI] [PMC free article] [PubMed] [Google Scholar]
- 15.Mentis M. J., Alexander G. E., Grady C. L., Horwitz B., Krasuski J., Pietrini P., Strassburger T., Hampel H., Schapiro M. B., Rapoport S. I., “Frequency variation of a pattern-flash visual stimulus during PET differentially activates brain from striate through frontal cortex,” NeuroImage 5(2), 116–128 (1997). 10.1006/nimg.1997.0256 [DOI] [PubMed] [Google Scholar]
- 16.Emir U. E., Bayraktaroglu Z., Ozturk C., Ademoglu A., Demiralp T., “Changes in BOLD transients with visual stimuli across 1–44 Hz,” Neurosci. Lett. 436(2), 185–188 (2008). 10.1016/j.neulet.2008.03.021 [DOI] [PubMed] [Google Scholar]
- 17.Parkes L. M., Fries P., Kerskens C. M., Norris D. G., “Reduced BOLD response to periodic visual stimulation,” NeuroImage 21(1), 236–243 (2004). 10.1016/j.neuroimage.2003.08.025 [DOI] [PubMed] [Google Scholar]
- 18.Scholkmann F., Kleiser S., Metz A. J., Zimmermann R., Pavia J. M., Wolf U., Wolf M., “A review on continuous wave functional near-infrared spectroscopy and imaging instrumentation and methodology,” NeuroImage 85, 6–27 (2014). 10.1016/j.neuroimage.2013.05.004 [DOI] [PubMed] [Google Scholar]
- 19.Pinti P., Tachtsidis I., Hamilton A., Hirsch J., Aichelburg C., Gilbert S., Burgess P. W., “The present and future use of functional near-infrared spectroscopy (fNIRS) for cognitive neuroscience,” Annals of the New York Academy of Sciences; (2018). [DOI] [PMC free article] [PubMed] [Google Scholar]
- 20.Aitchison R. T., Ward L., Kennedy G. J., Shu X., Mansfield D. C., Shahani U., “Measuring visual cortical oxygenation in diabetes using functional near-infrared spectroscopy,” Acta Diabetol 55(11), 1181–1189 (2018). 10.1007/s00592-018-1200-5 [DOI] [PMC free article] [PubMed] [Google Scholar]
- 21.Kacprzak M., Liebert A., Sawosz P. L., Zolek N. S., Maniewski R., “Time-resolved optical imager for assessment of cerebral oxygenation,” J. Biomed. Opt. 12(3), 034019 (2007). 10.1117/1.2743964 [DOI] [PubMed] [Google Scholar]
- 22.Liu Y., Piazza E. A., Simony E., Shewokis P. A., Onaral B., Hasson U., Ayaz H., “Measuring speaker–listener neural coupling with functional near infrared spectroscopy,” Sci. Rep. 7(1), 43293 (2017). 10.1038/srep43293 [DOI] [PMC free article] [PubMed] [Google Scholar]
- 23.Zaramella P., Freato F., Amigoni A., Salvadori S., Marangoni P., Suppjei A., Schiavo B., Chiandetti L., “Brain auditory activation measured by near-infrared spectroscopy (NIRS) in neonates,” Pediatr. Res. 49(2), 213–219 (2001). 10.1203/00006450-200102000-00014 [DOI] [PubMed] [Google Scholar]
- 24.Koch S. P., Habermehl C., Mehnert J., Schmitz C. H., Holtze S., Villringer A., Steinbrink J., Obrig H., “High-resolution optical functional mapping of the human somatosensory cortex,” Front. Neuroenerg. 2, 12 (2010). 10.3389/fnene.2010.00012 [DOI] [PMC free article] [PubMed] [Google Scholar]
- 25.Cui X., Bray S., Bryant D. M., Glover G. H., Reiss A. L., “A quantitative comparison of NIRS and fMRI across multiple cognitive tasks,” NeuroImage 54(4), 2808–2821 (2011). 10.1016/j.neuroimage.2010.10.069 [DOI] [PMC free article] [PubMed] [Google Scholar]
- 26.Quaresima V., Ferrari M., “Functional near-infrared spectroscopy (fNIRS) for assessing cerebral cortex function during human behavior in natural/social situations: a concise review,” Organizational Research Methods 22(1), 46–68 (2019). 10.1177/1094428116658959 [DOI] [Google Scholar]
- 27.Piper S. K., Krueger A., Koch S. P., Mehnert J., Habermehl C., Steinbrink J., Obrig H., Schmitz C. H., “A wearable multi-channel fNIRS system for brain imaging in freely moving subjects,” NeuroImage 85, 64–71 (2014). 10.1016/j.neuroimage.2013.06.062 [DOI] [PMC free article] [PubMed] [Google Scholar]
- 28.Habermehl C., Holtze S., Steinbrink J., Koch S. P., Obrig H., Mehnert J., Schmitz C. H., “Somatosensory activation of two fingers can be discriminated with ultrahigh-density diffuse optical tomography,” NeuroImage 59(4), 3201–3211 (2012). 10.1016/j.neuroimage.2011.11.062 [DOI] [PMC free article] [PubMed] [Google Scholar]
- 29.Eggebrecht A. T., White B. R., Ferradal S. L., Chen C., Zhan Y., Snyder A. Z., Dehghani H., Culver J. P., “A quantitative spatial comparison of high-density diffuse optical tomography and fMRI cortical mapping,” NeuroImage 61(4), 1120–1128 (2012). 10.1016/j.neuroimage.2012.01.124 [DOI] [PMC free article] [PubMed] [Google Scholar]
- 30.Takahashi K., Ogata S., Yamamoto R., Shiotsuka S., Maki A., Yamashita Y., Yamamoto T., Koizumi H., Hirasawa H., Igawa M., “Activation of visual cortex imaged by 24 channel near-infrared spectroscopy,” J. Biomed. Opt. 5(1), 93–97 (2000). 10.1117/1.429973 [DOI] [PubMed] [Google Scholar]
- 31.Toronov V. Y., Zhang X., Webb A. G., “A spatial and temporal comparison of hemodynamic signals measured using optical and functional magnetic resonance imaging during activation in the human primary visual cortex,” NeuroImage 34(3), 1136–1148 (2007). 10.1016/j.neuroimage.2006.08.048 [DOI] [PMC free article] [PubMed] [Google Scholar]
- 32.Hoshi Y., “Functional near-infrared optical imaging: Utility and limitations in human brain mapping,” Psychophysiology 40(4), 511–520 (2003). 10.1111/1469-8986.00053 [DOI] [PubMed] [Google Scholar]
- 33.Eggebrecht A. T., Ferradal S. L., Robichaux-Viehoever A., Hassanpour M. S., Dehghani H., Snyder A. Z., Hershey T., Culver J. P., “Mapping distributed brain function and networks with diffuse optical tomography,” Nat. Photonics 8(6), 448–454 (2014). 10.1038/nphoton.2014.107 [DOI] [PMC free article] [PubMed] [Google Scholar]
- 34.Wojtkiewicz S., Sawosz P., Kacprzak M., Gerega A., Bejm K., Maniewski R., Liebert A., “Towards Optical Tomography of an Adult Human Head,” in Optical Tomography and Spectroscopy, (Optical Society of America, 2016), OM4C. 2. [Google Scholar]
- 35.Wobst P., Wenzel R., Kohl M., Obrig H., Villringer A., “Linear aspects of changes in deoxygenated hemoglobin concentration and cytochrome oxidase oxidation during brain activation,” NeuroImage 13(3), 520–530 (2001). 10.1006/nimg.2000.0706 [DOI] [PubMed] [Google Scholar]
- 36.Thaler L., Schütz A. C., Goodale M. A., Gegenfurtner K. R., “What is the best fixation target? The effect of target shape on stability of fixational eye movements,” Vision Res. 76, 31–42 (2013). 10.1016/j.visres.2012.10.012 [DOI] [PubMed] [Google Scholar]
- 37.Gregg N. M., White B. R., Zeff B. W., Berger A. J., Culver J. P., “Brain specificity of diffuse optical imaging: improvements from superficial signal regression and tomography,” Front. Neuroenerg. 2, 14 (2010). 10.3389/fnene.2010.00014 [DOI] [PMC free article] [PubMed] [Google Scholar]
- 38.Zeff B. W., White B. R., Dehghani H., Schlaggar B. L., Culver J. P., “Retinotopic mapping of adult human visual cortex with high-density diffuse optical tomography,” Proc. Natl. Acad. Sci. 104(29), 12169–12174 (2007). 10.1073/pnas.0611266104 [DOI] [PMC free article] [PubMed] [Google Scholar]
- 39.Prahl S., “Tabulated molar extinction coefficient for hemoglobin in water,” http://omlc.ogi.edu/spectra/hemoglobin/summary.html (1999).
- 40.Duncan A., Meek J. H., Clemence M., Elwell C. E., Tyszczuk L., Cope M., Delpy D., “Optical pathlength measurements on adult head, calf and forearm and the head of the newborn infant using phase resolved optical spectroscopy,” Phys. Med. Biol. 40(2), 295–304 (1995). 10.1088/0031-9155/40/2/007 [DOI] [PubMed] [Google Scholar]
- 41.Fox P. T., Raichle M. E., “Stimulus rate determines regional brain blood flow in striate cortex,” Ann. Neurol. 17, 303–305 (1985). 10.1002/ana.410170315 [DOI] [PubMed] [Google Scholar]
- 42.Dehghani H., White B. R., Zeff B. W., Tizzard A., Culver J. P., “Depth sensitivity and image reconstruction analysis of dense imaging arrays for mapping brain function with diffuse optical tomography,” Appl. Opt. 48(10), D137–D143 (2009). 10.1364/AO.48.00D137 [DOI] [PMC free article] [PubMed] [Google Scholar]
- 43.Boas D. A., Gaudette T., Strangman G., Cheng X., Marota J. J., Mandeville J. B., “The accuracy of near infrared spectroscopy and imaging during focal changes in cerebral hemodynamics,” NeuroImage 13(1), 76–90 (2001). 10.1006/nimg.2000.0674 [DOI] [PubMed] [Google Scholar]
- 44.Obrig H., Villringer A., “Beyond the visible—imaging the human brain with light,” J. Cereb. Blood Flow Metab. 23(1), 1–18 (2003). 10.1097/01.WCB.0000043472.45775.29 [DOI] [PubMed] [Google Scholar]
- 45.Wijeakumar S., Shahani U., Simpson W. A., McCulloch D. L., “Localization of hemodynamic responses to simple visual stimulation: an fNIRS study,” Invest. Ophthalmol. Visual Sci. 53(4), 2266–2273 (2012). 10.1167/iovs.11-8680 [DOI] [PubMed] [Google Scholar]
- 46.Wandell B. A., “Computational neuroimaging of human visual cortex,” Annu. Rev. Neurosci. 22(1), 145–173 (1999). 10.1146/annurev.neuro.22.1.145 [DOI] [PubMed] [Google Scholar]
- 47.Wandell B. A., Dumoulin S. O., Brewer A. A., “Visual field maps in human cortex,” Neuron 56(2), 366–383 (2007). 10.1016/j.neuron.2007.10.012 [DOI] [PubMed] [Google Scholar]
- 48.Liao S. M., Ferradal S. L., White B. R., Gregg N. M., Inder T. E., Culver J. P., “High-density diffuse optical tomography of term infant visual cortex in the nursery,” J. Biomed. Opt. 17(8), 081414 (2012). 10.1117/1.JBO.17.8.081414 [DOI] [PMC free article] [PubMed] [Google Scholar]
- 49.Kusaka T., Kawada K., Okubo K., Nagano K., Namba M., Okada H., Imai T., Isobe K., Itoh S., “Noninvasive optical imaging in the visual cortex in young infants,” Hum. Brain Mapp. 22(2), 122–132 (2004). 10.1002/hbm.20020 [DOI] [PMC free article] [PubMed] [Google Scholar]
- 50.Ward L. M., Aitchison R. T., Hill G., Imrie J., Simmers A. J., Morrison G., Mansfield D., Kennedy G. J., Shahani U., “Effects of Glaucoma and Snoring on Cerebral Oxygenation in the Visual Cortex: a Study Using functional Near Infrared Spectroscopy (fNIRS),” Spectroscopy (fNIRS) 2, 017–025 (2018). [Google Scholar]
- 51.Eisen-Enosh A., Farah N., Burgansky-Eliash Z., Polat U., Mandel Y., “Evaluation of critical flicker-fusion frequency measurement methods for the investigation of visual temporal resolution,” Sci. Rep. 7(1), 15621 (2017). 10.1038/s41598-017-15034-z [DOI] [PMC free article] [PubMed] [Google Scholar]
- 52.Hecht S., Verrijp C. D., “The influence of intensity, color and retinal location on the fusion frequency of intermittent illumination,” Proc. Natl. Acad. Sci. U. S. A. 19(5), 522–535 (1933). 10.1073/pnas.19.5.522 [DOI] [PMC free article] [PubMed] [Google Scholar]
- 53.Kircheis G., Wettstein M., Timmermann L., Schnitzler A., Häussinger D., “Critical flicker frequency for quantification of low-grade hepatic encephalopathy,” Hepatology 35(2), 357–366 (2002). 10.1053/jhep.2002.30957 [DOI] [PubMed] [Google Scholar]
- 54.Salmi T., “Critical flicker frequencies in MS patients with normal or abnormal pattern VEP,” Acta Neurol. Scand. 71(5), 354–358 (2009). 10.1111/j.1600-0404.1985.tb03212.x [DOI] [PubMed] [Google Scholar]
- 55.Shankar H., Pesudovs K., “Critical flicker fusion test of potential vision,” J. Cataract Refractive Surg. 33(2), 232–239 (2007). 10.1016/j.jcrs.2006.10.042 [DOI] [PubMed] [Google Scholar]
- 56.Yoshiyama K. K., Johnson C. A., “Which method of flicker perimetry is most effective for detection of glaucomatous visual field loss,” Invest. Ophthalmol. Visual Sci. 38(11), 2270–2277 (1997). [PubMed] [Google Scholar]
- 57.Tyler C. W., “Specific deficits of flicker sensitivity in glaucoma and ocular hypertension,” Invest. Ophthalmol. Visual Sci. 20(2), 204–212 (1981). [PubMed] [Google Scholar]
- 58.Alpern M., Flitman D. B., Joseph R. H., “Centrally fixed flicker thresholds in amblyopia,” Am. J. Ophthalmol. 49(5), 1194–1202 (1960). 10.1016/0002-9394(60)91635-4 [DOI] [PubMed] [Google Scholar]
- 59.Levin L. A., Nilsson S. F., Ver Hoeve J., Wu S., Kaufman P. L., Alm A., Adler's Physiology of the Eye E-Book: Expert Consult-Online and Print (Elsevier Health Sciences, 2011). [Google Scholar]
- 60.Walter W. G., “Colour illusions and aberrations during stimulation by flickering light,” Nature 177(4511), 710 (1956). 10.1038/177710a0 [DOI] [PubMed] [Google Scholar]
- 61.Shevelev I., Kamenkovich V., Bark E., Verkhlutov V., Sharaev G., Mikhailova E., “Visual illusions and travelling alpha waves produced by flicker at alpha frequency,” International Journal of Psychophysiology 39(1), 9–20 (2000). 10.1016/S0167-8760(00)00105-7 [DOI] [PubMed] [Google Scholar]
- 62.Wu S., Burns S. A., Reeves A., Elsner A. E., “Flicker brightness enhancement and visual nonlinearity,” Vision Res. 36(11), 1573–1583 (1996). 10.1016/0042-6989(95)00226-X [DOI] [PubMed] [Google Scholar]
- 63.Chen C.-H., Ho M.-S., Shyu K.-K., Hsu K.-C., Wang K.-W., Lee P.-L., “A noninvasive brain computer interface using visually-induced near-infrared spectroscopy responses,” Neurosci. Lett. 580, 22–26 (2014). 10.1016/j.neulet.2014.07.042 [DOI] [PubMed] [Google Scholar]
- 64.Marshall R. S., Ferrera J. J., Barnes A., Zhang X., O’Brien K. A., Chmayssani M., Hirsch J., Lazar R. M., “Brain activity associated with stimulation therapy of the visual borderzone in hemianopic stroke patients,” Neurorehabilitation and Neural Repair 22(2), 136–144 (2008). 10.1177/1545968307305522 [DOI] [PubMed] [Google Scholar]


