Abstract
We present a study of the optical second-order nonlinearity of type I collagen fibers grown in vitro via second harmonic generation (SHG) experiments and analyze the observed polarization-resolved SHG signal using previously reported SHG analytical expressions obtained for anisotropic tissue. Our results indicate that the effective second-order nonlinearity measured in the grown fibers is one order of magnitude lower than that of native collagen fibers. This is attributed to the formation of loose and dispersive fibrillar networks of thinner collagen fibrils that constitute the reassembled collagen fibers. This is confirmed by scanning electronic microscopy (SEM) imaging and the polarization dependence of the SHG signal. The measured values of the anisotropy parameter ρ of the reassembled collagen fibers are found to be similar to that obtained for native fibers on the relevant sub-µm scale.
1. Introduction
The study of the self-organization processes of fibrous proteins, responsible for connective tissue formation for example, has been a subject of great interest in medicine for years. Understanding these mechanisms at the molecular structure level is important for gaining knowledge about the origin and development of some pathological processes like those involving alterations of human tissue. Type I collagen is the most prevalent component of the extracellular matrix and thus is the major constituent of connective tissue, muscles, bones, corneas, etcetera, playing a crucial role in tissue homeostasis [1]. It is well known that the basic structure of collagen fibers is tropocollagen, a triple helix molecule (∼1.5 nm in diameter and ∼300 nm in length) composed of three protein chains. Tropocollagen molecules are self-assembled in a staggered way to form microfibrils (∼3.6 nm in diameter), which are subsequently assembled into collagen fibrils (10 to 500 nm in diameter). Fibrils further aggregate to form fibers (1 to 20 µm in diameter) and so on [1–3]. The length of the fibrils can be up to few tenths of microns, while the fibers can extend up to few millimeters in length. In mammals the most typical tissue resulting from this assembly process is tendon, which is composed of highly ordered collagen fibrils.
The collagen assembly process has been studied by growing collagen fibers from different solutions containing collagen monomers (extracted either from rat/mouse tendons or human/bovine dermis). The resulting diameters, lengths and scaffolding structure of the reassembled fibrils (and so the fibers) depend on many factors of the collagen solution during the growth process, including concentration, temperature, pH, and whether the collagen monomers have been pepsinized [4–6].
The hierarchical structure of collagen fibers contributes to their intrinsic ability to produce strong second harmonic generation (SHG) signals. At the molecular level, the non-centro symmetric arrangement of chemical moieties of the polypeptide gives rise to dipolar contributions to the second-order nonlinearity of fibrillar collagens [6–8]. At the supra-molecular level, SHG radiates from individual collagen fibrils of around 50 nm of diameter [9,10]. At the microscopic level, a complex architecture of collagen fibrils arranged in randomly poled nano-domains governs the coherent addition of SHG within the focal volume of the excitation light [11]. These SHG signals have been used as an imaging contrast mechanism to visualize and characterize the architecture of collagen in several tissues such as cornea, skin and bone [9,12–18]. In turn, SHG microscopy has become a powerful tool for disease diagnosis and to perform basic research associated with connected tissues, musculo-skeletal disorders, and epithelial cancers [19]. However, relatively little work has focused on the study of the growth and generation of collagen fibrils (process known as fibrillogenesis) using SHG microscopy [10,12]. In particular, Bancelin and coworkers monitored the three-dimensional (3D) self-assembly of isolated collagen fibrils in solution using SHG microscopy [10].
To our knowledge, the question of whether the second-order nonlinearity from collagen fibers grown in vitro is the same as that of native collagen fibers has not been addressed in detail so far. The aim of this work is to carefully address this question. For this purpose, we performed polarization-resolved SHG experiments to measure the optical second-order nonlinearity of type I collagen fibers grown in vitro from collagen solution, which we will compare to the nonlinearity of native collagen fibers, and that from a lithium niobate (LiNbO3) crystal as a reference material. By using the polarization resolved SHG analytical expressions obtained by Gusachenko et al [20], which take into account the birefringence, polarization cross-talk and diattenuation effects of thick tissues on the SHG signal, we estimated the thickness of the grown collagen fibers by a qualitative comparison between the simulated SHG polarization dependence, and the experimental results obtained from the experiments.
2. Theoretical background of the cylindrical geometry of collagen molecules
The second-order polarization P induced in collagen by the interaction of an incident electric field E is given by [7, 20,21]:
| (1) |
where is the second-order nonlinear susceptibility tensor.
The polarization properties of the SHG intensity from type I collagenous tissues are modeled well with C∞ and/or cylindrical rod symmetry along the fibrillar axis, which matches the principal axis of the collagen molecules [6,7,20–23]. Such symmetry reduces the second-order susceptibility tensor to four nonzero elements. After assuming Kleiman’s symmetry and the fact that the incident electric field E lies in the laboratory coordinate system , the tensor is reduced to just two independent elements: and , where x is the principal axis.
Given the fiber’s direction along the x-axis, the propagation of the excitation laser beam along the z direction (perpendicular to the fibers) and with a linear polarization oriented in the plane xy at an angle α with respect to the fibers, the electric field in the focal volume can be expressed as and . Therefore, the second-order nonlinear polarization (Eq. 1) can be expressed as [20]:
| (2) |
| (3) |
In nonlinear microscopy, the contrast mechanism due to the second-order nonlinearity of collagen fibers is commonly estimated by the ratio , which measures the ratio of the SHG signal along and perpendicular to the fiber direction; i. e. it measures the anisotropy of the SHG signal. The reported value of ranges from 1.4 to 3 [7–9, 20,21] depending on the beam spot size and the excitation wavelength utilized to generate the SHG signal of the collagen fiber. Note that this anisotropy parameter is commonly probed to obtain a measure of the orientational distribution of the collagen molecules within the focal volume, the larger the parameter the higher the homogeneity and self-assembling organization of collagen molecules [9]. The SHG intensity for each polarization is given by:
| (4) |
| (5) |
where K is a constant that depends on the molecule’s geometry and the square intensity of the excitation beam . By using Eqs. (4) and (5) the anisotropy parameter can be obtained if one computes the total intensity, , parallel ( = 0) and perpendicular ( = 90°) to the fiber axis yielding ; where and denote the parallel and perpendicular directions, respectively.
In a more realistic case, birefringence, polarization cross-talk and diattenuation effects need to be considered in order to derive more proper expressions for the SHG intensities. These effects are studied in detail for anisotropic tissue in Ref. [20,24] and will be described here in similar fashion, where the material possesses an intrinsic birefringence with different components of the permittivity tensor along the x- and y-axis, respectively. Therefore, when light propagates through the fiber material, a relative phase retardation is produced between its x (extraordinary wave) and y (ordinary wave) field components, rotating the polarization direction and modifying its polarization state of the linearly polarized excitation light, affecting in turn the polarization distribution of the generated SHG signal. Additionally, the chiral conformation of collagen structures gives rise to circular dichroism in the observed SHG signal [25]. These polarization rotation processes lead to a polarization cross-talk effect in the SHG signal, meaning that some of the SHG signal with an original x-polarization, will be detected on the orthogonal y-direction and vice versa. Finally, form birefringence, which is the birefringence originating from subwavelength alternating structures (such as collagen molecules and fibrils) induce anisotropic light scattering, which, in turn results in a differential attenuation (called diattenuation) of light amplitudes polarized parallel and perpendicular to the fiber axis [24,26]. Diattenuation can lead to an anisotropic nonlinear response in the medium. For the case of collagenous tissues it is assumed that such diattenuation effect varies exponentially with tissue depth for the different attenuation lengths in x and y directions.
Taking into account the birefringence, polarization cross-talk and diattenuation effects that scramble the polarization state as a function of tendon depth [20], Eqs. (4) and (5) can be expressed as
| (6) |
| (7) |
where z represents the depth in the tendon at which the SHG takes place, is the diattenuation coefficient given by , where and are the attenuation lengths in the extraordinary and ordinary axis of the fiber, respectively. In this work we will analyze z values that are on the order of the fibril and fiber diameters. The birefringence, , with and as the extraordinary and ordinary refraction indices, induces a phase change in the excitation propagation given by , while the amount of the polarization cross-talk effect is represented by and . By inspecting Eqs. (6) and (7) it can be seen that these physical effects affect the ratio and therefore the resulting SHG anisotropy may differ from the value of ρ when such effects are not taken into account [20].
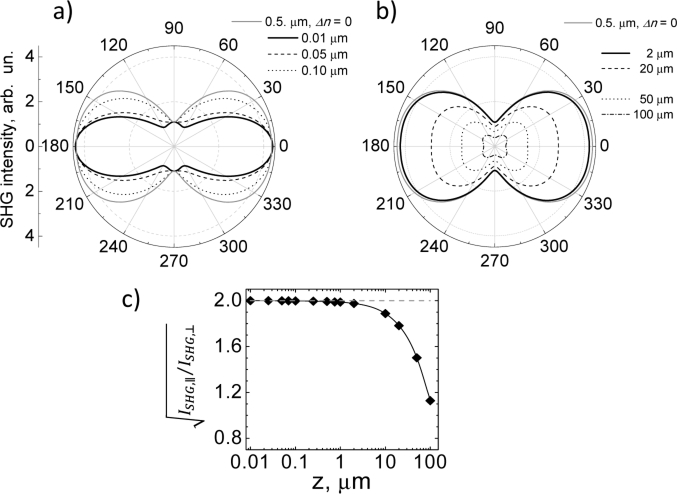
Figure 1 shows a simulation for the dependence of the SHG polarization intensity, , for collagen structures of variable thickness, taking into account the combined effects of birefringence, polarization cross-talk and diattenuation that may occur during the light propagation inside the cylindrical structure along the z-direction. In the plots, the polar angle corresponds to the angle α relative to the fiber axis x. Figure 1a considers propagation lengths in the range of collagen fibril diameters with z = 0.01, 0.05 and 0.1 µm, respectively. Figure 1b considers propagation lengths in the range of collagen fiber diameters, with z = 2 and 20 µm, and tendon diameters with z = 50 and 100 µm. In both figures, the values of the birefringence (), polarization cross-talk coefficients ( and ) and diattenuations ( and ), were taken from the reported values for collagen Type I tissue [20]. A value of 2 was used in our simulations which is within the range of the measured values by different groups [8,9,20,21]. The solid gray curve drawn in both figures represents the simulated SHG polarization distribution obtained without birefringence () for diameters from 0.01 to 0.5 µm.
Fig. 1.
Simulated SHG polar intensity () dependence from (a) collagen fibrils thickness (as labeled), and (b) collagen fibers and tendon thickness (as labeled). The birefringence, cross-talks and diattenuation parameters values used were ; ; , and . (c) Influence of these physical effects on the ratio . A value of 2 was used in (a-c).
Figure 1a shows that the shape of the SHG polarization plot for collagen fibrils is different with and without the birefringence effect. With birefringence () the SHG polar distribution “shrinks” towards the x-axis, i.e. the relative y-polarized signal decreases as the fiber diameter decreases. Note that this shrinking effect is not observed without birefringence (). In the absence of birefringence, the shape of the corresponding SHG polar distributions remains practically unchanged (data not shown) with respect the plotted gray curve shown in the figure. Hence, the characteristic flattening of the polar plot is a signature of a) the presence of birefringence and b) a small apparent diameter of the sampled material. This range corresponds to 0.01 to 0.5 µm, dimensions that correspond to fibrillar diameters. The ratio , however is not affected for this diameter range, as can be seen in Fig. 1c. In other words, for collagen fibrils (diameters from 0.01 to 0.5 µm) the shape of the polarization SHG signal is affected mainly by birefringence without affecting the SHG anisotropy.
The simulated curves in Fig. 1b resemble characteristic SHG polar dependences obtained in experiments with collagen fibers and tendons [9,21]. A decrease in both the total intensity and the ratio is observed as the fiber thickness increases. This effect becomes evident above 2 µm. For thicknesses > 20 µm, enhanced SHG lobes around ± 45 and ± 135 degrees and a prominent signal decrease along the fiber axis are produced. Note that the shape of the resulting SHG polarization distributions is the same with and without birefringence effect (not shown). Therefore, for collagen fibers (diameters > 2 µm) the shape of the polarization dependent SHG signal is largely unaffected by birefringence, while the SHG anisotropy decreases as the fiber thickness is >>2 µm (from thick fibers up to tendon diameters).
3. Methods
3.1. Samples preparation
3.1.1. Collagen fibers grown in vitro
Collagen, type I solution from rat tail (Sigma-Aldrich, C3867) was used for the preparation of fibers samples grown in vitro, following the Sigma C3867 protocol (www.sigma-aldrich.com). Briefly, a 10 µL volume of the collagen solution diluted with 90 µL of phosphate-buffered saline (PBS) solution was prepared to a working concentration of 0.01% using sterile tissue culture grade water. The pH of the solution was adjusted using a solution of sterilized sodium hydroxide (NaOH). The final solution was used to coat petri dishes with 6-10 mg/cm2 allowing the protein to bind for several hours (overnight) at room temperature (around 27 °C), until a dried coated surface was obtained. Samples at two different solution pH, 7 and 7.5, were obtained. The resulting collagen film containing randomly distributed collagen fibers was peeled off and deposited between two coverslips for fixation.
3.1.2. Native collagen fibers extraction
Native type I collagen fibers were extracted in vitro from native rat tail tendons. For this purpose, individual tendon fascicles were removed from rat tail tendons under a dissecting microscope. Collagen fibers of a few tenths of microns in width, and 1 cm length were deposited between coverslips for fixation.
3.2. SHG experimental setup
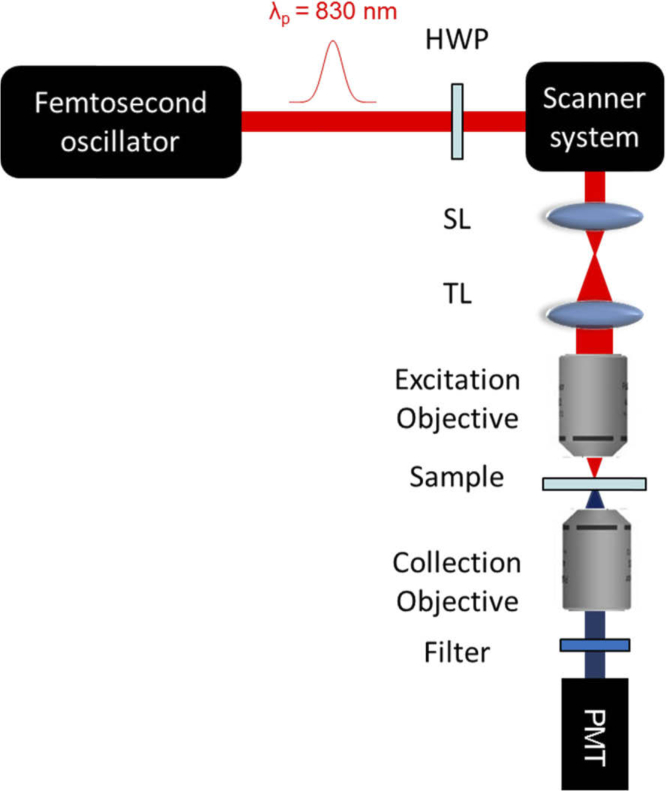
Figure 2 shows the experimental setup used to perform polarization-resolved SHG experiments. The utilized laser source was an ultrashort pulses oscillator (Grifin, KML Labs, Inc.) delivering 100 fs pulses at 94 MHz repetition rate and 300 mW average power. In order to minimize auto-fluorescence effects (via two-photon fluorescence excitation) we used a pulse wavelength centered at 830 nm (20 nm width) [13,27]. A half-wave plate was used to control the polarization of the excitation beam, which was sent to a scanning system consisting of two galvanometric mirrors (6230H, Cambridge Technology). A telescope arrangement, composed of the scanning lens (SL) and the tube lens (TL), was used to pivot the laser beam and to fill the back aperture of the excitation objective (10x, NA = 0.25, Nikon, Japan). The measured lateral resolution was 2.32 µm. The excitation beam was focused onto the sample, the SHG signal was collected by a condenser lens, and subsequently sent to a photomultiplier tube (PMT). An interferometric filter (FF01-435-25, Semrock) was used to block the excitation wavelength and collect only the SHG signal.
Fig. 2.
SHG experimental setup. In figure HWP: half-wave plate; SL: scan lens; TL: tube lens; and PMT: Photomultiplier tube.
3.3. Electron microscopy imaging
Scanning electron microscopy (SEM) was carried out on the collagen samples using a Hitachi- SU3500 unit. The glass slides containing the samples of collagen grown in vitro and native collagen were coated with a gold nano-layer (5-10nm, approximately) to get an appropriated conductivity. A voltage value of 5 kV and 15 kV was used for the samples grown in vitro and for the native collagen samples, respectively.
4. Results and discussions
4.1. SHG input polarization dependence of native collagen fibers
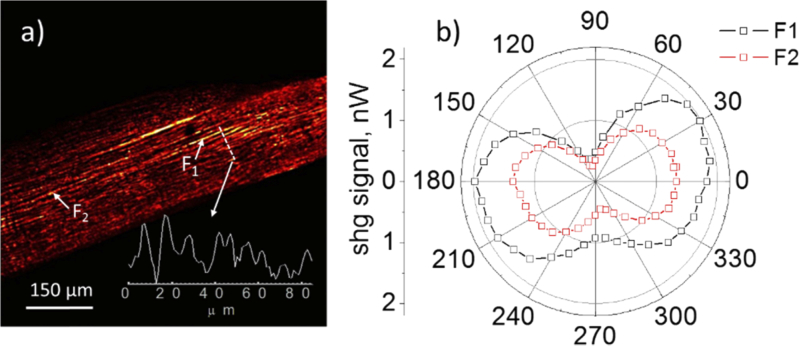
Figure 3(a) shows a SHG image of a type I collagen tendon where different fibers are observed. The fiber thickness can be inferred by inspecting the signal intensity profile seen at the bottom of Fig. 3(a), taken along the white dashed line indicated in the figure. Given that microscope resolution is 2.32 µm and the width of the SHG intensity peaks seen to be within 3-6 µm, a deconvoluted intensity profile (not shown) predicts fiber thicknesses around 2-5 µm, approximately. Figure 3b shows the SHG signal polar dependence obtained from two fibers, taken at positions labeled as F1 and F2 respectively, indicated with white arrows in Fig. 3(a). These polar graphs show the typical anisotropic behavior of the SHG signal obtained from collagen fibers. From Fig. 3(b), it is possible to estimate the value of the anisotropy parameter of the collagen fibers, using the relation . Thus the values are and for the fibers F1 and F2, respectively. These values of are in good agreement with the values reported for collagen tendons by Freund and coworkers [21] which are in the range.
Fig. 3.
a) SHG imaging of a type I collagen tendon. The intensity profile indicated with the dashed line is shown on the bottom of this figure, the collagen fibers have a thickness of about 2-4 µm. b) polar dependence of SHG signal corresponding to two fibers labeled as F1 and F2 in Fig. 2a. These polar graphs show the typical anisotropic behavior of the SHG signal obtained from type I collagen fibers.
4.2. SHG input polarization dependence of collagen fibers grown in vitro
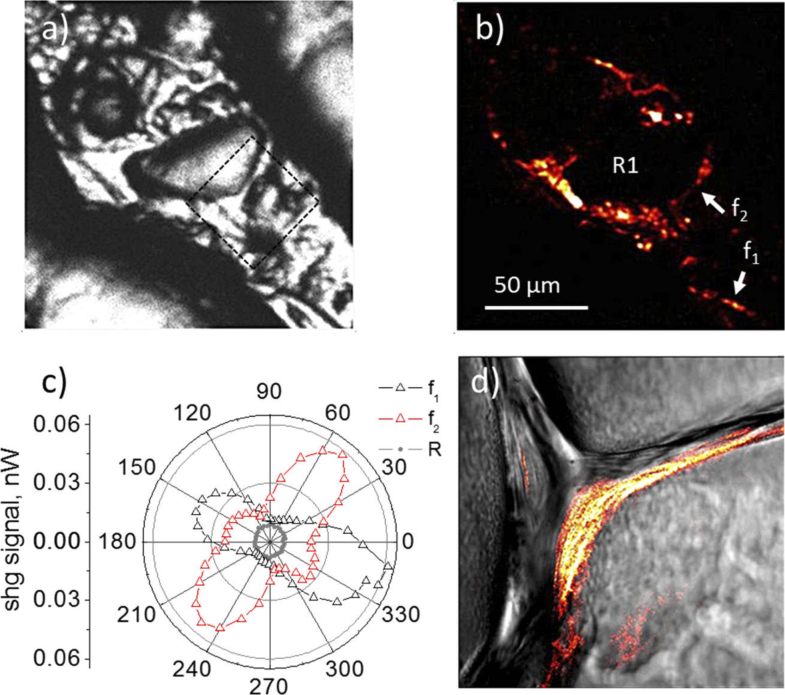
Figure 4 shows the SHG results obtained from collagen fibers grown in vitro prepared (at room temperature) with pH = 7. The transmission bright field (BF) image and the corresponding SHG image are shown in Figs. 4(a) and 4(b), respectively. Figure 4(c) shows the polar dependence of the corresponding SHG signal from the fibers labeled as f1 and f2, in Fig. 4(b). Furthermore, a different region (labeled as R1) was also analyzed, where an isotropic behavior is observed in the polar dependence graph (see gray curve in Fig. 4(c)), indicating the absence of collagen fiber formation in this region. Note that the fibers f1 and f2 are orthogonal to each other, having maximum values in the SHG signal at -22° and 158° for f1 and, 50° and 230° for f2. According to Williams et. al. [9], high values of ρ >2 are obtained from fibers with high homogeneity and highly ordered self-assembly. The authors reported a value of for thin collagen fibers, using a 40x 1.4 NA oil immersion objective. In our experiments, the anisotropy parameter measured on fibers f1 and f2, is and , respectively. Indicating that a higher degree of ordered self-assembly was achieved during collagen fibrillogenesis in fiber f1 relative to fiber f2. Figure 4(d) shows an amplified image of the BF and the SHG images, merged together, where collagen fibers are resolved. This image was taken with a higher magnification objective 20× (0.75 NA) in air and a lateral resolution of 0.6 µm.
Fig. 4.
a) Transmission bright field image (BF) of the zone where the collagen fibers were grown in vitro. b) SHG image. c) SHG polar dependence from the fibers f1, f2 and the region R1 outside of the fibrous zone indicated in Fig. 4b. The curves obtained from the fibers shown and anisotropic behavior and their shape corresponds to the obtained for thin fibers. For the region R1 the polar curve has completely an isotropic behavior indicating the absence of collagen fiber formation. d) Zoomed merged image of BF (gray color) and SHG (red-hot color). The imaged area is 40×40 µm2
4.3. Collagen fibrils diameter estimation
Given the optical resolution utilized in our experiments (∼2 µm) no individual collagen fibrils are resolved in Figs. 3(a) and 4(b). In order to estimate the collagen fibril diameters in both samples we utilized Eqs. (6) and (7), using the same values of the birefringence, the polarization cross-talk coefficients and diattenuation parameters utilized in Fig. 1. Notice that these equations were derived for cylindrically symmetric collagenous tissues, such as collagen tendons. However, the cylindrical symmetry of tendons is derived from the hierarchical aggregation of lower level collagen structures (starting from micro fibrils, then fibrils, then fibers and so on), which also exhibit cylindrical symmetry. Therefore, we can assume that this model is also valid for lower level collagen structures, down to the level of individual fibrillar structures. A single experimental SHG polar trace for each sample was acquired by normalizing the intensity of the two measured SHG polar traces and then averaging the resulting intensity, according to the following expressions
| (8) |
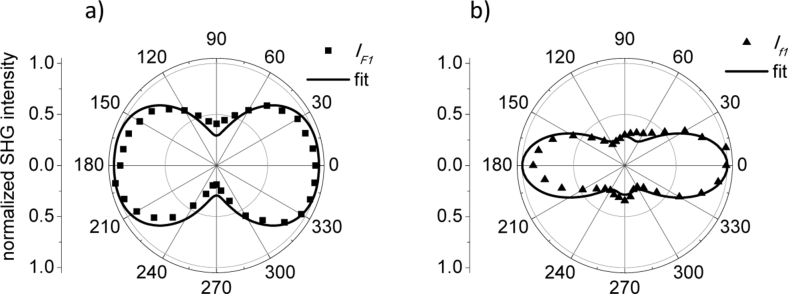
with N = 2 and i = 1,2. Where IF and If are the experimental parameters for native and grown in vitro collagen fibers to be fitted. Additionally, an averaged anisotropy parameter was also computed using the experimental ρ obtained in Fig. 3 and Fig. 4 yielding ρF=1.85 and ρf=1.87, respectively. Figure 5 shows the resulting experimental data and their corresponding fits.
Fig. 5.
Fibril diameter estimation for native collagen fibrils (a) and collagen fibrils grown in vitro (b). Experimental data IF (filled squares) and If (filled triangles) are computed using Eq. 8. Solid lines are fitted curves computed with Eqs. (6) and (7) using of z = 170 nm and in (a) and of z = 40 nm and in (b). In both figures ; ; , and .
In Fig. 5(a), the curve with filled squares represents the experimental SHG signal for the native collagen sample, while in Fig. 5(b) the curve with filled triangles represents the measurements for the collagen sample grown in vitro. The solid lines are the fitting curves. Note that to fit these curves two parameters of Eqs. (6) and (7) needed to be changed, the fibril thickness z (considered here equal to the fibril diameter) and the anisotropy parameter ρ. The fit shown in Fig. 5(a) for the native collagen sample corresponds to a fibril diameter of 170 nm and , while the fit for the collagen sample grown in vitro shown in Fig. 5(b) corresponds to a fibril diameter of 40 nm and . The characteristic flattening of the polar plot is an indication that the apparent diameter of the sampled volume is of the order of fibrillar structures. This result suggests that, although the apparent fibril thickness varies between native collagen fibrils and fibrils grown in vitro, the parameter ρ is about the same value. Therefore, the degree of fibril assembly, in terms of average fibril orientation, should be similar in both type of samples.
4.4. SEM imaging
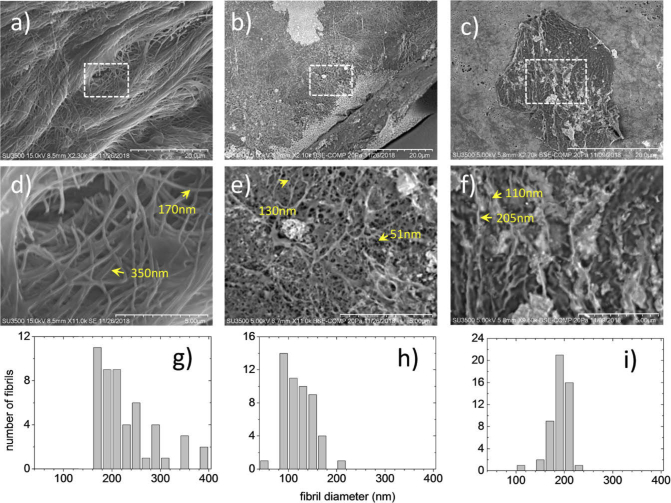
To analyze the morphology of the collagen fibrils, SEM imaging was performed on both types of sample. Figure 6 compares the images taken at the same scale of a native collagen sample (Fig. 6(a)) and collagen sample grown in vitro at pH = 7.5 (Fig. 5(b)) and pH = 7 (Fig. 5(c)). In the Fig. 6(a) collagen fibers formed from aggregated collagen fibrils can be appreciated, while in Figs. 6(b) and 6(c) randomly distributed and oriented fibrils are observed forming loose and dense fibrillar networks with thinner fibril diameters. Figure 6(d) shows a selected region of interest (ROI) of Fig. 6(a) (dashed square) where it is recognized that the fibrils diameters are bigger than the diameters of fibrils grown in vitro shown in Figs. 6e and 6f (the selected ROI of Figs. 6(b) and 6(c), respectively).
Fig. 6.
SEM imaging on a) native collagen fibers and collagen fibers grown in vitro at b) pH = 7.5 and c) pH = 7. d), e) and f) are zoomed images of a), b) and c), respectively, where thinner fibrils can be observed in collagen grown in vitro (see arrows). Histograms showing the distribution of the diameters measured on 50 native collagen fibrils (g) and 50 collagen fibrils grown in vitro at pH = 7.5 and pH = 7 (h,i).
The obtained diameters are in good agreement with the estimation made in Fig. 5. The distribution of the diameters measured over 50 different fibrils are shown in the histograms of Figs. 6(g), 6(h), and 6(i), for native collagen and collagen grown in vitro samples at pH = 7.5 and pH = 7, respectively. Fibrils with diameters from 170 to 380 nm (225 nm in average) are found in the native samples while fibrils from 50 to 170 nm (110 nm in average) are found in collagen samples grown in vitro at pH = 7.5. For the case of collagen samples grown in vitro at pH = 7 the fibril diameter ranges from 110 to 230 nm (190 nm in average). This decrease in diameter has been reported by Christiansen et al., [28]. They found that self-assembled type I collagen fibrils at acidic pH values results in larger diameters than for neutral and basic pH values, whose diameters tends to decrease.
As mentioned above, the ρ values utilized to fit the measured SHG polarization signals in Fig. 5 suggests that the degree of assembly of both native fibrils and grown in vitro fibrils is similar. Given that collagen molecules are the building blocks of both type of samples, this result could perhaps be expected assuming that the SHG signal originates from individual fibrils. However, it is important to note that the in vitro collagen fibrils were reassembled exogenously without any enzymes favoring the cross-linking process needed for the collagen molecules aggregation. Based on the fibril distances within the fibrillar network shown in Fig. 6(b) and the 2 µm beam width utilized in our SHG experiments, one can deduce that the SHG signal contribution could come from few and or, possibly, individual fibrils. This is supported with the qualitative similarity obtained in the shape of the SHG polarization dependence measured on the reassembled fibrils (Fig. 4(c) and so Fig. 5(b)) and the SHG polarization dependence simulated for thin fibrils (Fig. 1(a)). Having 1 to 3 fibrils contributing to the SHG signal from a 1×1- area has been reported by Reiser et. al. on rat tail tendon fascicles subjected to fibril disordering [29]. It was shown that SHG signal from fibrils with a moderate misalignment is still detectable, albeit lower than SHG from aligned fibrils.
4.5. SHG signal comparison
To perform a comparison of the second-order nonlinearity obtained from collagen fibers grown in vitro and native collagen fibers, a lithium niobate (LiNbO3) crystal was used. It is well known that this type of crystal exhibits a high optical nonlinearity and it has been widely used for SHG applications and characterization. The second order nonlinear optical susceptibility component of LiNbO3 probed in this experiment is dyyy (2.1 pm/V).
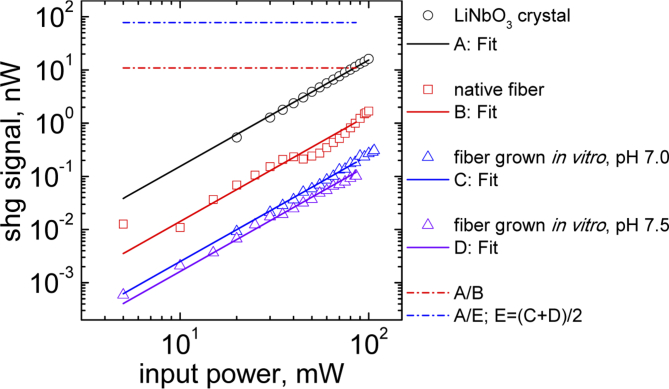
Figure 7 shows the SHG signal dependence with respect to the input power for a LiNbO3 crystal (open black circles), native collagen fiber (open red squares), collagen fibers grown in vitro for pH = 7 (open blue triangles) and pH = 7.5 (open magenta triangles). The polarization of the incident light is tuned such as to generate the highest SHG signal, which corresponds to input light polarized parallel to the fiber axis. For the LiNbO3 crystal the laser polarization was parallel to the direction of the susceptibility component dyyy. For native collagen sample the SHG signal curve corresponds to the fiber F1 of the Fig. 3, while the SHG signal curve at pH = 7 was obtained from fiber f1 of the Fig. 4. The SHG signal curve at pH = 7.5 was obtained from a single fiber (image not shown). The experimental curve values were used to calculate the SHG signal ratio between LiNbO3 and the native fibers A/B, and the result is shown by the red dashed line, whose value is around 1 × 101, i.e. the effective nonlinearity obtained from native fibers is one order of magnitude smaller than that of LiNbO3 (dyyy). This is consistent with previous measurements of the second order nonlinear susceptibility native collagen fibrils reporting a with values between 0.15 to 0.4 pm/V [22,30] (one order of magnitude less than 2.1 pm/V).
Fig. 7.
Comparison of the second-order nonlinearity obtained from collagen fibers grown in vitro and native collagen fibers considering as reference a lithium niobate (LiNbO3) crystal.
The SHG signal of fibers grown in vitro is two orders of magnitude lower than the SHG signal from LiNbO3 (see blue dashed line, calculated as 2A/(C + D)), and is around one order of magnitude lower than the SHG from native fibers (not shown). Notice that the magnitude of the SHG signals obtained from fibers grown in vitro at different pH (7 and 7.5) values had no significant relative difference. This could possibly be due to the fact that the resulting diameters in both reassembled samples are not considerable different to cause a significate change in the SHG anisotropy signals as is also suggested in Fig. 1a for the simulated fibril diameters between 0.1 to 0.5 micrometers.
It is tempting to attribute the differences between native collagen and collagen grown in vitro to a looser and less organized assembly of collagen fibrils in the in vitro sample. It is well known that the effective second order nonlinear parameter deff of fibrous collagen depends on the structural organization of fibrils or as well as the organization of collagen on the level of sub-fibrils (below 50 nm in width) and microfibrils (3-7 nm in with). A lack of organization in the collagen structures at these levels can result in destructive interference and complete loss of SHG signal [29,11].
However, a loss of structural organization should also result in a loss of the anisotropy parameter ρ. In the experiments reported here, we do not observe the corresponding changes in ρ. At the same time, our analysis reveals that the average thickness of collagen fibrils is significantly smaller in the in vitro sample. This implies that in the SHG experiments on the in vitro sample, less collagen scattering units contribute to the SHG signal if the overall 3D distribution of fibrils is more or less the same as in native collagen. Given that the SHG signal depends nonlinearly on the number density of the scattering units, thinner fibrils would give rise to a noticeable decrease of the SHG signal. Based on our observations, we speculate that the latter is the case. Hence, the loss of SHG signal in collagen grown in vitro relative to native collagen results from thinner collagen fibrils rather than a loss of intra- and inter-fibrillar alignment on the µm scale. Another possible explanation for the decreased SHG intensity of the collagen samples grown in vitro is the fact that the random nature of the reassembled fibrils creates a situation in which signal amplification through the so called quasi-phase matching (QPM) condition is less likely. It has been suggested that the emission directionality and conversion efficiency of the SHG signal depends on the packing density and ordering of the inter-fibril structure through the mechanism of signal amplification originating from QPM [31,32]. Under QPM conditions, the SHG intensity builds up over the propagation length of multiple fibrillar domains, giving rise to higher intensities than when propagating through single fibrils, with maximum signals when the fibril size and spacing is on the order of the coherence length. Taking this in consideration, native collagen samples are more likely to fulfill such QPM conditions than the collagen samples grown in vitro and, therefore, can be expected to exhibit stronger SHG signals.
5. Conclusions
We measured and analyzed experimentally the optical second-harmonic generation from collagen type I fibers grown in vitro. Compared with native collagen fibers, collagen fibers grown in vitro are composed of loose and dense fibrillar networks with thinner diameters. As a consequence of the more dispersed orientation distribution of the fibrils that make up the fibers grown in vitro, the SHG signal is about two orders of magnitude smaller than that for LiNbO3, and one order of magnitude smaller than the one for native collagen fibers. The values obtained for the anisotropy parameter ρ for the self-assembled collagen fibers are found to be similar to the values obtained for native fibers, meaning that the collagen molecules that constitute the reassembled fibrils have a similar degree of organization than that of native fibrils. This is shown using analytical expressions that take into account the birefringence, polarization cross-talk and diattenuation effects, to estimate the apparent fibril diameters by fitting the simulated SHG polarization distributions on experimental distributions measured over native collagen fibrils and collagen fibrils grown in vitro. The fibrils diameters obtained are in good agreement with the diameters shown in SEM images for the two types of sample.
Funding
Consejo Nacional de Ciencia y Tecnología10.13039/501100003141 (251992); Centro de Investigación Científica y de Educación Superior de Ensenada, Baja California10.13039/501100003089 (FIDEICOMISO-F0O002); National Science Foundation10.13039/100000001 (CHE-1506507); UC-MEXUS CONACYT (Collaborative Grants Program 2011).
Disclosures
The authors declare that there are no conflicts of interest related to this article.
References
- 1.Shoulders M. D., Raines R. T., “Collagen Structure and Stability,” Annu. Rev. Biochem. 78(1), 929–958 (2009). 10.1146/annurev.biochem.77.032207.120833 [DOI] [PMC free article] [PubMed] [Google Scholar]
- 2.Kadler K. E., Holmes D. F., Trotter J., Chapman J. A., “Collagen fibril formation,” Biochem. J. 316(1), 1–11 (1996). 10.1042/bj3160001 [DOI] [PMC free article] [PubMed] [Google Scholar]
- 3.Buehler M. J., “Nature designs tough collagen: explaining the nanostructure of collagen fibrils,” Proc. Natl. Acad. Sci. U. S. A. 103(33), 12285–12290 (2006). 10.1073/pnas.0603216103 [DOI] [PMC free article] [PubMed] [Google Scholar]
- 4.Harris R. J., Reiber A., “Influence of saline and pH on collagen type I fibrillogenesis in vitro: Fibril polymorphism and colloidal gold labelling,” Micron 38(5), 513–521 (2007). 10.1016/j.micron.2006.07.026 [DOI] [PubMed] [Google Scholar]
- 5.Jiang F., Hörber H., Howard J., Müller D. J., “Assembly of collagen into microribbons: effects of pH and electrolytes,” J. Struct. Biol. 148(3), 268–278 (2004). 10.1016/j.jsb.2004.07.001 [DOI] [PubMed] [Google Scholar]
- 6.Rocha-Mendoza I., Yankelevich D. R., Wang M., Reiser K. M., Frank C. W., Knoesen A., “Sum Frequency Vibrational Spectroscopy: The Molecular Origins of the Optical Second-Order Nonlinearity of Collagen,” Biophys. J. 93(12), 4433–4444 (2007). 10.1529/biophysj.107.111047 [DOI] [PMC free article] [PubMed] [Google Scholar]
- 7.Su P.-J., Chen W.-L., Chen Y.-F., Dong C.-Y., “Determination of Collagen Nanostructure from Second-Order Susceptibility Tensor Analysis,” Biophys. J. 100(8), 2053–2062 (2011). 10.1016/j.bpj.2011.02.015 [DOI] [PMC free article] [PubMed] [Google Scholar]
- 8.Han Y., Hsu J., Ge N.-H., Potma E. O., “Polarization-sensitive sum-frequency generation microscopy of collagen fibers,” J. Phys. Chem. B 119(8), 3356–3365 (2015). 10.1021/jp511058b [DOI] [PubMed] [Google Scholar]
- 9.Williams R. M., Zipfel W. M., Webb W. W., “Interpreting Second-Harmonic Generation Images of Collagen I Fibrils,” Biophys. J. 88(2), 1377–1386 (2005). 10.1529/biophysj.104.047308 [DOI] [PMC free article] [PubMed] [Google Scholar]
- 10.Bancelin S., Aimé C., Coradin T., Schanne-Klein M. C., “In situ three-dimensional monitoring of collagen fibrillogenesis using SHG microscopy,” Biomed. Opt. Express 3(6), 1446–1454 (2012). 10.1364/BOE.3.001446 [DOI] [PMC free article] [PubMed] [Google Scholar]
- 11.Rivard M., Laliberté M., Bertrand-Grenier A., Harnagea C., Pfeffer C. P., Vallières M., St-Pierre Y., Pignolet A., El Khakani M. A., Légaré F., “The structural origin of second harmonic generation in fascia,” Biomed. Opt. Express 2(1), 26–36 (2011). 10.1364/BOE.2.000026 [DOI] [PMC free article] [PubMed] [Google Scholar]
- 12.Wolf K., Alexander S., Schacht V., Coussens L., Von Adrian U. H., Van Rheenen J., Deryugina E., Friedl P., “Collagen-based cell migration models in vitro and in vivo,” Semin. Cell Dev. Biol. 20(8), 931–941 (2009). 10.1016/j.semcdb.2009.08.005 [DOI] [PMC free article] [PubMed] [Google Scholar]
- 13.Yeh A. T., Nassif N., Zoumi A., Tromberg B. J., “Selective corneal imaging using combined second-harmonic generation and two-photon excited fluorescence,” Opt. Lett. 27(23), 2082–2084 (2002). 10.1364/OL.27.002082 [DOI] [PubMed] [Google Scholar]
- 14.Han M., Giese G., Bille J. F., “Second harmonic generation imaging of collagen fibrils in cornea and sclera,” Opt. Express 13(15), 5791–5797 (2005). 10.1364/OPEX.13.005791 [DOI] [PubMed] [Google Scholar]
- 15.Hsuan-Shu L., Shu-Wen T., Hsiao-Ching C., Wen L., Yen S., Tze-Yu L., Ling-Ling C., Ching-Chuan J., Chen-Yuan D., “Imaging Human Bone Marrow Stem Cell Morphogenesis in Polyglycolic Acid Scaffold by Multiphoton Microscopy,” Tissue Eng. 12(10), 2835–2841 (2006). 10.1089/ten.2006.12.2835 [DOI] [PubMed] [Google Scholar]
- 16.Yasui T., Takahashi Y., Ito M., Fukushima S., Arak T., “Ex vivo and in vivo second-harmonic-generation imaging of dermal collagen fiber in skin: comparison of imaging characteristics between mode-locked Cr:forsterite and Ti:sapphire lasers,” Appl. Opt. 48(10), D88–D95 (2009). 10.1364/AO.48.000D88 [DOI] [PubMed] [Google Scholar]
- 17.Raub C. B., Suresh V., Krasieva T., Lyubovitsky J., Mih J. D., Putnam A. J., Tromberg B. J., George S. C., “Noninvasive Assessment of Collagen Gel Microstructure and Mechanics Using Multiphoton Microscopy,” Biophys. J. 92(6), 2212–2222 (2007). 10.1529/biophysj.106.097998 [DOI] [PMC free article] [PubMed] [Google Scholar]
- 18.Pena A.-M., Fagot D., Olive C., Michelet J.-F., Galey J.-B., Leroy F., “Multiphoton microscopy of engineered dermal substitutes: assessment of 3-D collagen matrix remodeling induced by fibroblast contraction,” J. Biomed. Opt. 15(5), 056018 (2010). 10.1117/1.3503411 [DOI] [PubMed] [Google Scholar]
- 19.Campagnola P. J., Dong C.-Y., “Second harmonic generation microscopy: principles and applications to disease diagnosis,” Laser Photonics Rev. 5(1), 13–26 (2011). 10.1002/lpor.200910024 [DOI] [Google Scholar]
- 20.Gusachenko I., Latour G., Schanne-Klein M.-C., “Polarization-resolved Second Harmonic microscopy in anisotropic thick tissues,” Opt. Express 18(18), 19339–19352 (2010). 10.1364/OE.18.019339 [DOI] [PubMed] [Google Scholar]
- 21.Freund I., Deutsch M., Sprecher A., “Connective tissue polarity. Optical second-harmonic microscopy, crossed-beam summation, and small-angle scattering in rat-tail tendon,” Biophys. J. 50(4), 693–712 (1986). 10.1016/S0006-3495(86)83510-X [DOI] [PMC free article] [PubMed] [Google Scholar]
- 22.Erikson A., Örtegren J., Hompland T., de Lange Davies C., Lindgren M., “Quantification of the second-order nonlinear susceptibility of collagen I using a laser scanning microscope,” J. Biomed. Opt. 12(4), 044002 (2007). 10.1117/1.2772311 [DOI] [PubMed] [Google Scholar]
- 23.Deniset-Besseau A., Duboisset J., Benichou E., Hache F., Brevet p.-F., Schanne-Klein M.-C., “Measurement of the Second-Order Hyperpolarizability of the Collagen Triple Helix and Determination of Its Physical Origin,” J. Phys. Chem. B 113(40), 13437–13445 (2009). 10.1021/jp9046837 [DOI] [PubMed] [Google Scholar]
- 24.Kemp N. J., Zaatari H. N., Park J., Rylander G. H., III, and Milner T. E., “Form-biattenuance in fibrous tissues measured with polarization-sensitive optical coherence tomography (PS-OCT),” Opt. Express 13(12), 4611–4628 (2005). 10.1364/OPEX.13.004611 [DOI] [PubMed] [Google Scholar]
- 25.Lee H., Huttunen M. J., Hsu K. J., Partanen M., Zhuo G. Y., Kauranen M., Chu S. W., “Chiral imaging of collagen by second-harmonic generation circular dichroism,” Biomed. Opt. Express 4(6), 909–916 (2013). 10.1364/BOE.4.000909 [DOI] [PMC free article] [PubMed] [Google Scholar]
- 26.Emoto A., Nishi M., Okada M., Manabe S., Matsui S., Kawatsuki N., Ono H., “Form birefringence in intrinsic birefringent media possessing a subwavelength structure,” Appl. Opt. 49(23), 4355–4361 (2010). 10.1364/AO.49.004355 [DOI] [PubMed] [Google Scholar]
- 27.Zoumi A., Yeh A., Tromberg B. J., “Imaging cells and extracellular matrix in vivo by using second-harmonic generation and two-photon excited fluorescence,” Proc. Natl. Acad. Sci. 99(17), 11014–11019 (2002). 10.1073/pnas.172368799 [DOI] [PMC free article] [PubMed] [Google Scholar]
- 28.Christiansen D. L., Huang E. K., Silver F. H., “Assembly of type I collagen: fusion of fibril subunits and the influence of fibril diameter on mechanical properties,” Matrix Biol. 19(5), 409–420 (2000). 10.1016/S0945-053X(00)00089-5 [DOI] [PubMed] [Google Scholar]
- 29.Reiser K. M., Bratton C., Yankelevich D. R., Knoesen A., Rocha-Mendoza I., Lotz J., Reiser K. M., Bratton C. G., Yankelevich D. R., Knoesen A., Rocha-Mendoza I., Lotz J. C., “Quantitative analysis of structural disorder in intervertebral disks using second harmonic generation imaging: comparison with morphometric analysis,” J. Biomed. Opt. 12(6), 064019 (2007). 10.1117/1.2812631 [DOI] [PubMed] [Google Scholar]
- 30.Stoller P., Celliers P. M., Reiser K. M., Rubenchik A. M., “Quantitative second-harmonic generation microscopy in collagen,” Appl. Opt. 42(25), 5209–5219 (2003). 10.1364/AO.42.005209 [DOI] [PubMed] [Google Scholar]
- 31.LaComb R., Nadiarnykh O., Townsend S. S., Campagnola P. J., “Phase matching considerations in second harmonic generation from tissues: effects on emission directionality, conversion efficiency and observed morphology,” Opt. Commun. 281(7), 1823–1832 (2008). 10.1016/j.optcom.2007.10.040 [DOI] [PMC free article] [PubMed] [Google Scholar]
- 32.Tian L., Qu J., Guo Z., Jin Y., Meng Y., Deng X., “Microscopic second-harmonic generation emission direction in fibrillous collagen type I by quasi-phase-matching theory,” J. Appl. Phys. 108(5), 054701 (2010). 10.1063/1.3474667 [DOI] [Google Scholar]


