Abstract
Raman spectroscopy has demonstrated great potential for skin wound assessment. Given that biochemical changes in wound healing is depth dependent as the skin is a layered structure, depth sensitive Raman spectroscopy could enhance the power of Raman spectroscopy in this application. Considering the critical importance of rodent studies in the field of skin wound assessment, it is necessary to develop and validate a system that can perform depth sensitive measurements in rat skin with a proper target depth range. In this manuscript, we report the design, optimization and evaluation of a new snapshot depth-sensitive Raman instrument for rat skin measurements. The optical design and optimization process are presented first. The depth sensitive measurement performance is characterized on both ex vivo porcine skin with a gradient of layer thickness and ex vivo rat skin samples with wounds. The statistical analysis of the measured Raman spectra demonstrates the feasibility of differentiation between the wound edge and healthy skin. Moreover, the accuracy of classification improves monotonically as more data from new depths are used, which implies that each depth offers additional information useful for classification. This instrument demonstrates the ability to perform snapshot depth sensitive Raman measurements from rat skin, which paves the way towards in vivo preclinical studies of rat skin wounds.
1. Introduction
When the protective layer of the skin is compromised, the skin begins a sequence of four overlapping healing phases: hemostasis, inflammation, proliferation and lastly, remodeling [1]. For the diabetic and elderly however, this process could be slowed, leading to the development of chronic skin wounds, such as diabetic foot ulcers and pressure ulcers, that are costly and complicated to diagnose and treat. The prevalence of foot ulceration is 6.3% for diabetics [2] while the prevalence of pressure ulcers is 27% in long-term care units [3]. The market size for wound care products is anticipated to be US$23.2 billion in 2023 [4].
There are a variety of wound assessment tool guides available such as the Pressure Ulcer Scale for Healing [5], Leg Ulcer Measurement Tool [6], the TIME framework [7] and recently, the triangle of wound assessment [8]. These paradigms for tracking the condition of the wound rely on the skill and experience of the clinician [9], sometimes require costly and invasive biopsies [10] and can be time-consuming. There is a need for an easy-to-use, noninvasive and well-validated wound assessment methodology with high biochemical specificity. Raman spectroscopy (RS) is one potential adjunct tool.
Several studies have already validated the use of RS for wounds. Jain et al. distinguished the stage of wound healing using multivariate factor analysis of the spectra taken at different time points [11]. Demonstrating that Raman mapping can accurately identify wound proteins, Chan et al. took confocal Raman images of proteins in the wound and validated them using a combination of immunofluorescent staining and gene array analysis [12]. Following this, Flach et al. performed Raman mapping of the wound edge, tracking keratin and collagen factor scores during wound healing [13], to serve as a basis for characterizing the biochemical and structural response of the wound to particular therapies. Both preceding studies used human skin culture wound healing models. Alimova et al. evaluated the wound healing efficacy of surgical sutures or laser welding of guinea pig skin incisions based on ratiometric RS qualifiers [14]. Exploring the use of mesenchymal stem cells (MSCs) as a wound therapeutic, Yan et al. treated diabetic mice with MSCs then assessed wound healing using ratiometric Raman microspectroscopy and staining of collagen fibers [15]. However, these prior studies do not fully take advantage of the depth dependent biochemical changes during wound healing. These changes at the wound edge in the inflammatory stage include an invasion of neutrophils, a thin tongue of undifferentiated migratory epithelial cells crawling towards the wound center and neutrophils releasing proinflammatory growth factors and cytokines. The proliferation stage of wound healing includes several processes such as angiogenesis and collagen deposition in the dermis, and re-epithelialization in the epidermis [1,16]. Such layer dependent changes require depth sensitive Raman measurements to fully capture the biochemical fingerprints crucial for determining wound healing status.
Past approaches to depth-sensitive RS include spatially offset Raman spectroscopy (SORS) and lens based depth scanning techniques. SORS [17] increases sensitivity to subsurface Raman signals by offsetting the illuminating location some distance apart from the detecting location. Keller et al. developed a SORS probe for margin assessment of breast tumors [18]. The probe had four different offset distances, each sensitive to a different depth, to improve margin assessment. For axial scanning techniques to make depth sensitive measurements, light is focused onto the target depth to achieve the maximum Raman collection efficiency from that depth and the light focus is scanned across a range of depths. Richters et al. used one such lens-based technique, confocal Raman spectroscopy, to assess the skin barrier of people with sensitive skin [19], building on the previous work by Caspers et al. [20]. When taking measurements from cheek, forearm and palm skin, the focal point was shifted axially in increments of 4, 4 and 15 µm to depths of 28, 28 and 180 µm respectively. The concentration profiles of water and ceramides along the depth dimension was deduced in this way. SORS relies solely on light scattering to reach large depths, thus suffers from low depth resolution in depth sensitive measurements. Comparatively, lens based depth scanning techniques are advantageous in depth sensitivity since both the illumination and detection are performed in a focused manner. However, while lens based techniques such as confocal microspectroscopy have exceptional axial resolution, they are not designed for measuring large sample volumes in a short time.
To improve depth resolution and speed up measurements while still capable of measuring a large sample volume, our group developed an axicon lens based system for depth sensitive measurements by utilizing a focal line to excite Raman signals along the entire depth range and the unique property of axicon lenses in converting the depth dimension to the radial dimension. Our system has previously demonstrated great performance when applied to RS of ex vivo tissues and in vivo human thumbnail [21]. One limitation of this system is that it was designed for human skin measurements with a target depth range of 0 to 1.5 mm. Thus, it is not suitable for rodent skin measurements as the latter tissue is much thinner. Compared to human skin with an epidermal thickness between 31 to 637 µm and a dermal thickness from 469 up to 1977 µm [22], the epidermal thickness of rat skin is 76 to 167 µm while the dermis is 1018 to 1599 µm thick depending on age and location on the body [23]. A target depth range of 0 to 200 µm would better capture changes in both the epidermis and dermis. Given the critical importance of rat studies in skin wound assessment [24,25], it is necessary to develop and validate a system that can perform depth sensitive measurements on rat skin. This process is not trivial because we need to not only revise the illumination module to achieve a much shorter focal line but also design a new custom module to map Raman signals from a much smaller depth range (about 10 times smaller) to the detector of the same size as before while still achieving a reasonable depth resolution.
In this manuscript, we report the optical design, optimization and evaluation of the new snapshot depth-sensitive Raman instrument for rat skin measurements. The resulting system can measure Raman signals from five different depths along a focal line [26,27] of 180 µm simultaneously. Depth sensitivity performance is characterized on both ex vivo porcine skin with a gradient of layer thickness and ex vivo rat skin wounds. The feasibility of using the measured Raman spectra to differentiate between the wound edge and healthy skin is demonstrated. Moreover, the accuracy of classification improves monotonically as more data from new depths are used, which implies that each depth offers additional information useful for classification. This instrument demonstrates the ability to perform snapshot depth sensitive Raman measurements from rat skin, which paves the way towards in vivo preclinical studies of rat skin wounds.
2. Methods
2.1. Optical setup
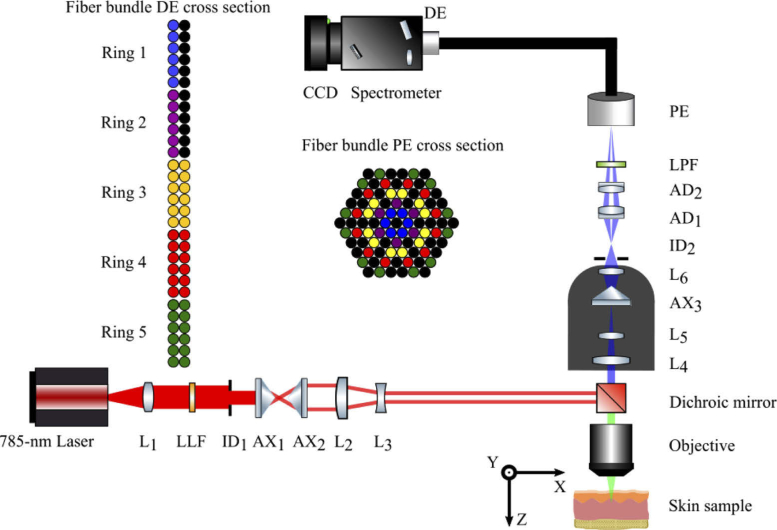
A schematic of the system is shown in Fig. 1. The excitation light source, a 785-nm diode laser (XTRA II, Toptica Photonics, Victor, NY, USA) emitting light shown by the red rays, was coupled to a single mode fiber (#OK-000678, Toptica Photonics, Victor, NY, USA) and collimated by an FC/APC triplet collimator (TC25APC-780, Thorlabs, Newton, MA, USA). A laser clean-up filter (LL01-785, Semrock, Rochester, NY, USA) removed the unwanted side bands and an iris diaphragm (SM1D12, Thorlabs, Newton, MA, USA) adjusted the beam diameter to 6mm. The collimated laser beam passed through a pair of axicon lenses (AX2520-B, Thorlabs, Newton, MA, USA) to generate a ring-shaped beam. The diameter of the beam was reduced by a factor of two using the combination of a plano-convex (LA1509-B-ML, Thorlabs, Newton, MA, USA) and a plano-concave lens (LC1715-B, Thorlabs, Newton, MA, USA). Then the beam was reflected by a dichroic mirror (LPD02-785RU, Semrock, Rochester, NY, USA) and focused by an objective lens (PLAN Fluor ELWD DICM PH2 DM 40x/0.60 NA, Nikon, Tokyo, Japan) to form a focal line inside the sample, as illustrated in Fig. 2. The laser power on the sample was set such that it was below the maximum permissible exposure (MPE), which is 0.296 W/cm2 for skin when the exposure time is between 10 to 30000 seconds according to the American national standard for safe use of lasers (ANSI Z136.1). A z-axis translation stage (PT1/M, Thorlabs, Newton, MA, USA) was used to position the sample such that the top of the focal line was on the surface of the sample. A white light imaging module (not shown in Fig. 1 for simplicity) was integrated into this system to facilitate the search for measurement locations. To superimpose the top of the focal line on the surface of a sample, the white light imaging module was used to bring the sample to focus then adjusted according to the relationship between the position of the white light focal plane and the top of the laser focal line determined a priori.
Fig. 1.
Schematic of the depth sensitive Raman spectrometer for rat measurements. L1: collimation lens; LLF: laser line filter; ID1, ID2: iris diaphragm; AX1, AX2: axicon; L2, L3: beam shrinker; L4, L5, AX3, L6: custom lens assembly; AD1, AD2: achromatic doublet; LPF: long pass filter; PE: proximal end of fiber bundle; DE: distal end of fiber bundle; Ring 1-5: DE linear fiber bundles corresponding to PE rings.
Fig. 2.
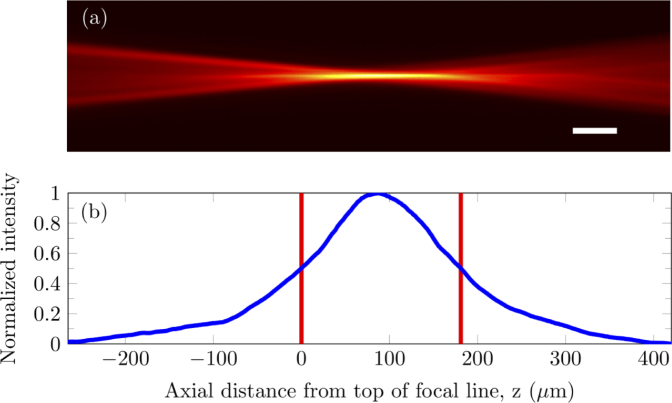
Experimental point spread function measured by imaging R6G fluorescence illuminated by the laser focal line. (a) Axial plane image of the PSF. (b) Fluorescence intensity profile along the axial axis, i.e. z axis, of the image. The intensity is shown in blue while the red lines indicate the edges of the FWHM. Scale bar: 50 µm by 9 µm.
The focal line stimulated the emission of Raman photons along the depth of the sample. The green rays in Fig. 1 indicate the optical path shared by the laser beam and the Raman photons emitted from the sample. The Raman signal from the sample, as indicated by blue rays, was collected by the same objective lens and passed through a custom lens assembly we designed, as described in the next section. The Raman beam size was fine-tuned by a matched achromatic doublet pair (MAP105075-B, Thorlabs, Newton, MA, USA) and the background and excitation light were suppressed using a long pass filter (BLP01-785R-25, Semrock, Rochester, NY, USA), before coupling into a custom ring-to-linear fiber bundle. The custom lens assembly and matched achromatic doublet pair mapped the Raman signals acquired from different depths onto the corresponding rings of the proximal end (PE) of the fiber bundle. Each fiber had core/cladding/coating diameters of 100/110/125 µm and a numerical aperture of 0.22.
In this setup, ideally the Raman signal from the smallest depth of the sample would be channeled to the innermost ring of the PE, Ring 1, while the Raman signal from the largest depth of the sample would be channeled to the outermost ring of the PE, Ring 5. Ring 2 to Ring 4 would collect the Raman scattering from the corresponding intermediate depths. Ring 1 and Ring 2 consist of 6 fibers each while Ring 3, Ring 4 and Ring 5 consist of 12 fibers each, as shown in Fig. 1. The different colors of the fibers illustrate the correspondence between fibers of the PE and fibers of the distal end (DE). The black circles represent dead spacer fibers. The Raman signal exiting the linear fiber array at the distal end of the fiber bundle was aligned with the 150 µm input slit of the spectrograph (ACTON LS-785, Princeton Instruments, Trenton, NJ, USA). The Raman signal was dispersed by a diffraction grating, then projected onto a CCD (PIXIS 400BR_eXcelon, Princeton Instrument, Trenton, NJ, USA). The five spectra projected onto the CCD from the five rings were acquired simultaneously in LightField v4.0 (Princeton Instruments, Trenton, NJ, USA). The tradeoff between maximizing optical throughput for the two columns of fibers at the DE and keeping spectral resolution acceptable necessitated a 150-µm slit width and a spectral resolution of 16.69 cm−1.
2.2. Optical design for coupling of light emitted along focal line to fiber bundle
The optical system design was optimized in Zemax using a combination of the Merit Function Editor (MFE) and the Multi-Configuration Editor (MCE). The distance between the object plane and the objective lens was modified in five configurations in the MCE with increments of 40 µm between configurations. In this way, five points along a 200-µm focal line were modelled. The goal of the optical design then, is to ensure that light from each of the 5 points is coupled into the corresponding one of five rings of the fiber bundle as efficiently as possible.
Given that an axicon lens would be necessary to map axial light radially, the first parameter to optimize would be the apex angle of the axicon in our custom lens assembly. In the MFE, the Encircled Energy Function (Geometric) was used to quantify the depth-to-ring matching accuracy. Here, the five fiber bundle rings were approximated as five concentric rings. The depth-to-ring matching accuracy was defined as the proportion of simulated light rays captured between the inner and outer diameters of each ring out of all light rays incident onto the fiber bundle. The axicon, AX3, which has an apex angle of 170° (AX255-B, Thorlabs, Newton, MA, USA), with the best depth-to-ring matching accuracy available off-the-shelf was utilized.
As previously described by Liu et al., the image from an axicon suffers from comatic aberration and requires a large depth of field (DOF) imaging system [21]. Additional lenses in the custom assembly were added to minimize focusing deviations from different depths on the z axis as well as to prohibit large comatic aberration such that light is ideally focused within our defined ring region. These lenses are: L4, a bi-convex lens; L5, a bi-convex lens; and L6, an achromatic doublet (Part #47056, #67629, #49948 respectively, Edmund Optics, Barrington, New Jersey, USA). To minimize crosstalk, an iris diaphragm was placed after the custom lens assembly. This iris primarily prevented stray photons out of configurations 1 and 2 from entering fiber rings 3, 4 and 5. Finally, a matched achromatic doublet pair was added to fine-tune the coupling into the fiber bundle. Optimizing all these optical components yielded a depth-to-ring matching accuracy varying between 77% to 92.0% for Rings 1 through 5.
2.3. Ex vivo rat skin wound model
Male Sprague Dawley rats were housed in the Animal Research Facility of the Lee Kong Chian School of Medicine, Singapore under specific pathogen-free conditions with a 12-hour light-dark cycle, where standard rodent diet and water were supplied ad libitum. The IACUC of the BRC Singapore has approved of this protocol, #140928. Animals were 8-12 weeks in age and had an average weight of 175 g.
Rats were anesthetized with isoflurane gas and oxygen. The backs of rats were shaved, applied with depilatory cream, wiped with water and then wiped with ethanol before wounding. Biopsy punches with a diameter of 6 mm were used to create full-thickness excisional wounds on the back of each rat. After which, wounds were dressed with Tegaderm (3M, USA), and then Opsite (Smith & Nephew, UK) was used to ensure full coverage. Buprenorphine, 2 mg/kg, was delivered subcutaneously after wounding. The rats were then housed individually. The wounds were harvested 24 hours later and immersed in 4% paraformaldehyde overnight. At this time, the wounds are typically in the inflammatory phase of healing. The fixed full-thickness skin samples were stored in phosphate-buffered saline (PBS, pH 7.4, Thermo Fisher Scientific, USA) at 4 °C. Prior to Raman measurement, the wounds were prepared in a well with PBS to prevent tissue dehydration and the surface of the skin was kept free of hair or large water droplets.
2.4. Data processing and PLS analysis
All Raman spectra and images were processed using MATLAB (R2018a, Mathworks, Natick, MA, USA) unless otherwise stated. The order of spectral processing steps occurred as follows: cosmic ray removal, summation of frames, system background subtraction, wavelength calibration, system spectral response correction, fluorescence estimation and separation, and lastly, smoothing. Cosmic ray spikes were removed using a median filter. The system background was measured with the laser switched on and the same acquisition settings but no sample. A Neon-Argon lamp was used to perform a wavelength calibration for each of the five rings individually. System spectral response correction was performed by collecting the spectral irradiance intensity of a luminescence standard (SRM-2241, NIST, Gaithersburg, MD, USA) and applying the calculated spectral intensity correction curve to measured Raman spectra [28]. Fluorescence was estimated using the modified 5th-order polynomial fitting algorithm [29]. A Savitzky-Golay smoothing filter was applied with an order of 4 and a frame length of 15 [30].
Partial least square (PLS) analysis and linear discriminant analysis (LDA) were used to create classifiers for spectral analysis. In the PLS analysis, the data was compressed into coefficients for PLS components (PCs). The spectra were fitted to 15 PCs such that each spectrum was a linear combination of 15 PCs. Thus, the spectra could be represented using 15 coefficients for each PC. A Wilcoxon rank-sum test was performed to select PC coefficients that demonstrated statistically significant differences, p < 0.05, between two groups of interest. The chosen PC coefficients further underwent LDA, in which the coefficients were projected onto the n-dimensional vector, where n is the number of chosen coefficients, that maximizes separability between the groups. Leave-one-sample-out validation across both PLS and LDA was used to quantify the accuracy, sensitivity and specificity of the classifier [31]. Spectra from each wound site were left out of the PLS classifier then tested.
3. Results
3.1. Focal line generation
The focal line generation proceeds as described by Welford [27]. The Gaussian beam from the laser is transformed into a collimated annular beam through refraction by a pair of axicons, AX1 and AX2. The annular beam illuminates the back aperture of the objective. As the beam converges, the interference pattern forms a focal line from the axial extension of the point-spread function (PSF) [32].
There are several variables that can be optimized to produce a focal line of the appropriate characteristics. These include the beam divergence and beam inner/outer diameter. We set the beam inner and outer diameter to 0.6 mm and 1.6 mm respectively. The focal line produced had a full width at half maximum (FWHM) length of 181 µm and width of 9 µm as illustrated in Fig. 2. We measured the dimensions of the focal line by placing 1-mM Rhodamine 6G (R6G) solution (R4127, Sigma-Aldrich, St. Louis, MO, USA) in an IR quartz cuvette under the objective and using another 10x objective (CFI Plan Achro 10x/0.25 NA, Nikon, Tokyo, Japan) to image the axial plane of the laser-induced fluorescence in R6G solution from the side.
3.2. Calibration of depth sensitivity
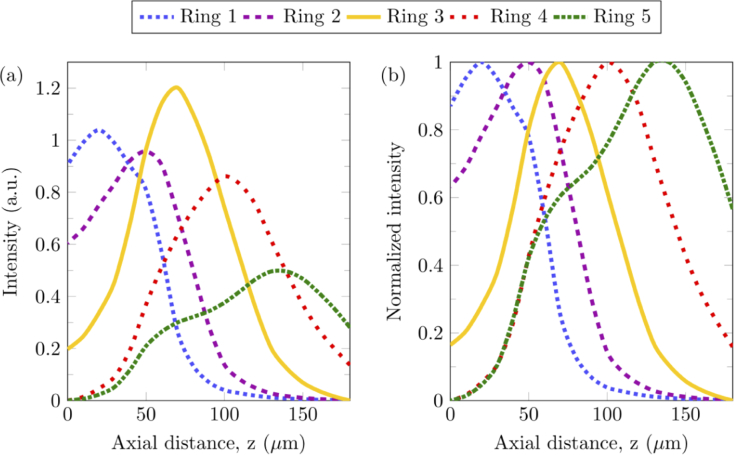
To verify the Zemax simulation results and establish the probing depth of each fiber ring, depth calibration was conducted. A silicon wafer fragment was placed on the sample stage and the sample was translated upwards with increments of 10 µm, from the bottom of the focal line to the top of the focal line. Spectra were acquired at each increment with acquisition settings of 1-second exposure time and 60 frames. The integral of the 520 cm−1 silicon Raman peak was found for each increment. Raman intensity for each fiber ring is presented in Fig. 3(a), from the top of the focal line at 0 µm to the bottom of the focal line at 180 µm. Normalized axial profiles in Fig. 3(b) indicate that the peak depth sensitivities for each ring were located at approximately 20 µm, 50 µm, 70 µm, 100 µm, 140 µm for rings 1 to 5 respectively. The shoulder observed for ring 5 at 70 µm can be attributed to the inability of the iris diaphragm, ID2, to completely block stray light without a significant drop in signal intensity. For biological tissues, it needs to be noted that the variation in refractive index could change the axial locations of both laser illumination and Raman detection regions slightly.
Fig. 3.
Depth calibration of fiber rings for signal collection. (a) Raman intensity at 520 cm−1, which corresponds to the Raman peak of silicon, measured from a silicon wafer along a 180 µm axial line, spanning from the top of the focal line to the bottom of the focal line. The axial distance is the distance between the top of the focal line and the surface of the silicon. (b) Normalized Raman intensity at 520 cm−1 for each fiber ring.
3.3. Testing on two-layer transparent and turbid phantoms
To evaluate the depth sensitivity of the instrument, measurements on two-layer transparent and turbid phantoms were performed.
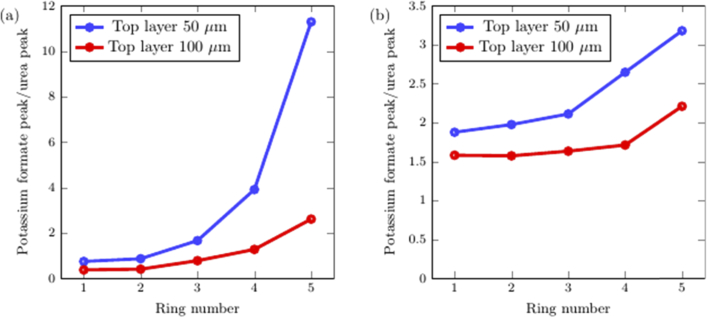
In the transparent phantoms, the top layer consists of 1 M urea (208884, Sigma-Aldrich, St. Louis, MO, USA) dissolved in 1.5% (weight/volume) agarose (PC0701-500G, Vivantis, Subang Jaya, Malaysia). Top layer thicknesses of 50 and 100 µm were prepared by dropping the urea solution onto a glass slide and then compressing the droplet with another glass slide, with a plastic spacer sheet (770-816, RS Components, Singapore) of the appropriate thickness in between. The bottom layer consists of 1 M potassium formate (294454-500G, Sigma-Aldrich, St. Louis, MO, USA) dissolved in 1.5% (weight/volume) agarose with a thickness of 280 µm. The top and bottom layer agarose solutions gel at room temperature and are superimposed on each other. The ratio between the potassium formate Raman peak at 1345 cm−1 and the urea Raman peak at 1000 cm−1 was calculated to indicate the depth sensitivity.
For turbid phantoms, an identical protocol was followed with two deviations: polystyrene microspheres (1 µm, Catalog No. 07310, Polysciences, Warrington, PA, USA) were added to reach a concentration of 0.47% by volume. This simulates a reduced scattering coefficient of rat skin at about 1.2 mm−1 [33]. In addition, a bottom layer thickness of 8 mm was used instead.
From Figs. 4(a) and 4(b), monotonic trends can be observed in which the intensity ratio of the bottom layer to the top layer increases from ring 1 to 5. For transparent samples, this ratio varies from less than 1 at low ring numbers to between 2 and 12 for ring number 5. For turbid samples, the ratio is around 1.7 for ring number 1 to between 2.2 and 3.2 for ring number 5. The optical system shows excellent depth sensitivity for transparent samples and demonstrates reasonable depth sensitivity in turbid phantoms.
Fig. 4.
Evaluation of depth sensitivity using transparent and turbid phantoms. The intensity ratio between the peak from the bottom layer to the peak from the top layer for each ring is shown for (a) transparent phantoms, (b) turbid phantoms.
3.4. Testing ex vivo porcine skin sample
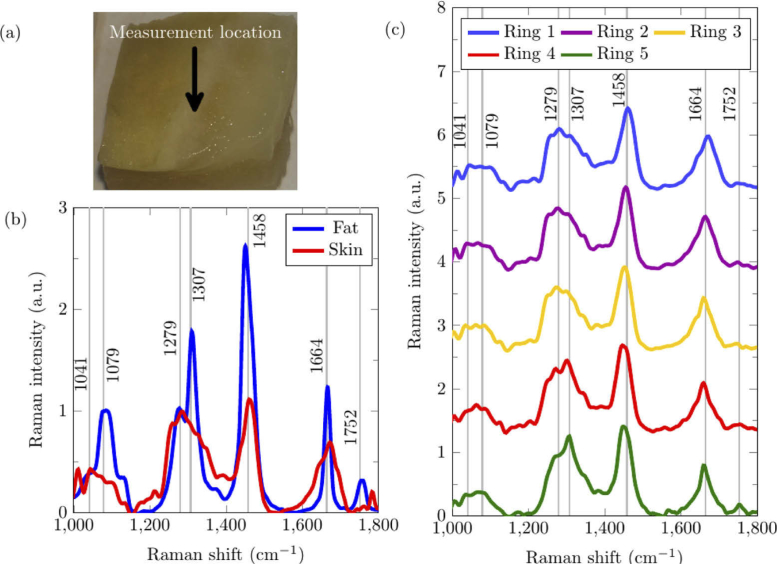
A porcine skin sample was acquired from pork belly meat (country of origin: Netherlands). The thickness of porcine epidermis and dermis is approximately 1.9 mm [34]. Below the dermis is the hypodermis, consisting of subcutaneous fat, blood vessels and nerves. Because the depth of field of the system is only 180 µm, it was necessary to cut the skin to a thickness of 100 µm. The cut is illustrated in Fig. 5(a) where the full thickness skin can be observed to the left of the measurement location while the subcutaneous fat can be observed to the right of the measurement location. The skin has been cut diagonally across such that the region in between the skin and fat is a wedge-shaped layer of dermis. The measurement location in this region is the point at which the system was able to identify the boundary between the skin and fat, as shown in Fig. 5(c). Each porcine tissue spectrum was measured with an exposure time of 120 seconds per acquisition and accumulated for 3 acquisitions.
Fig. 5.
Porcine skin and subcutaneous fat sample measured using depth-sensitive RS. (a) White-light photo of the top surface of the porcine skin sample, in which the epidermis/dermis (i.e. skin) layer was on the top and the fat layer was at the bottom. The region measured is indicated by the arrow. (b) Ring 1 Reference Raman spectra taken from the top surface of full-thickness porcine skin and the exposed porcine fat. (c) The Raman spectra from the measurement location was acquired, showing the depth-sensitivity of each ring. Grey lines with text highlight specific Raman shifts (cm−1).
The Raman signal emitted due to laser excitation of biomolecules in the tissue represents the vibrational modes of tissue constituents. Each tissue produces a characteristic Raman signal that could act as an identifier. These Raman fingerprints are illustrated in Fig. 5(b) where the fat layer has characteristic peaks at 1079 cm−1 (C-C stretch), 1307 cm−1 (CH2 twisting), 1446 cm−1 (CH2 bending), 1662 cm−1 (C = C stretch) and 1752 cm−1 (C = O ester) while the skin layer including both the epidermis and dermis has characteristic peaks at 1041 cm−1 (Collagen), 1279 cm−1 (Amide III), 1458 cm−1 (CH2) and 1664 cm−1 (Amide I). The spectra collected by Rings 1 and 2, which are supposed to be more sensitive to the superficial skin layer, exhibit Raman features that more closely resemble the characteristic of skin; the peak at 1279 cm−1 is stronger than the peak at 1307 cm−1 and the peak at 1664 cm−1 is wider than the peak at 1662 cm−1 typically observed in fat. The Raman spectra collected by Rings 4 and 5, in contrast, show higher sensitivity to the subcutaneous fat. For example, the Raman peak at 1307 cm−1 is stronger than that at 1279 cm−1, the peak at 1664 cm−1 is narrower, and the peak at 1752 cm−1 is stronger.
To further validate the depth-sensitive performance of the system on ex vivo porcine samples, a biochemical analysis (BCA) was performed using only the fat and skin reference spectra [35,36]. The Raman spectra from the measurement location and ring number was decomposed into a linear combination of the reference spectra acquired from the same ring number. Neither the reference spectra nor the measured spectra were normalized. The coefficients of the reference spectra were scaled such that the sum was 100%. Table 1 shows the estimated component contribution percentages for each ring. The fat contribution percentage increases monotonically with ring number, from 9% to 42%. The low percentage of fat even at Ring 5 could be partially attributed to light scattering affecting the resolving power, and to the possibility that the skin layer at the measurement site might be quite thick. In addition, as illustrated in Fig. 3, each ring is sensitive to a different depth but still acquires signal from other depths but with a lower efficiency. Nevertheless, the monotonic changes in the contributions from the skin and fat layers indicate the effectiveness of depth sensitive Raman measurements in biological tissues.
Table 1. Percent contribution of two layers in the porcine skin to Raman spectra from each ring.
| Ring number |
|||||
|---|---|---|---|---|---|
| Component | 1 | 2 | 3 | 4 | 5 |
| Skin (%) | 91 | 89 | 84 | 68 | 58 |
| Fat (%) | 9 | 11 | 16 | 32 | 42 |
3.5. Testing ex vivo rat skin sample
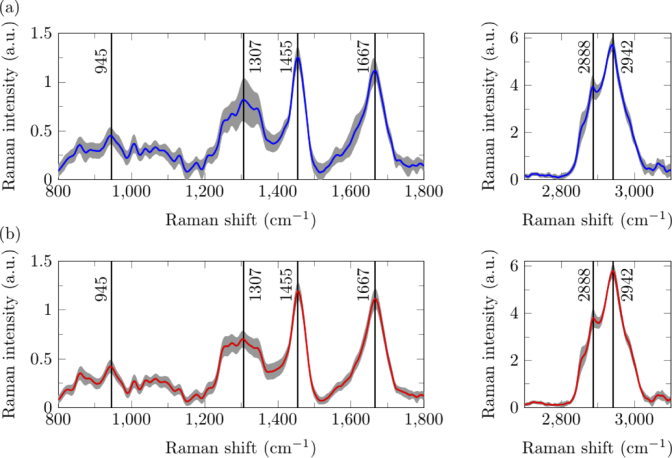
Representative Raman spectra taken from the rat skin region distal to the wound site (DWS, >5 mm) and those from the rat skin region proximal to the wound site (PWS, <1 mm from the scab and wound edge) are shown in Fig. 6. There were 16 ex vivo skin samples, each of which were probed at six different locations including three locations DWS and three locations PWS. Thus, in total 48 spectra were taken from DWS locations and 48 from PWS locations. The wound bed was not measured because it typically is covered by a blood clot, causing scattering of the excitation laser and Raman signal. Rodent spectra were acquired with 10 seconds per acquisition for 18 acquisitions.
Fig. 6.
Raman spectra from rat skin (a) proximal and (b) distal to the wound site acquired by Ring 1. Averaged Raman spectra is shown in the blue and red colored lines while the variation in each spectrum is shown in grey, in which the upper and lower bound of each point in the shaded region indicates mean ± standard deviation. Black lines with text highlight specific Raman shifts (cm−1).
Rat skin has peaks at 945 cm−1 (C-C stretching of protein backbone), 1307 cm−1 (CH2 stretching), 1455 cm−1 (CH2), 1667 cm−1 (Amide I), 2888 cm−1 and 2942 cm−1 (asymmetric CH2 and symmetric CH3 stretching respectively). By visual inspection, skin PWS has a peak at 1307 cm−1 slightly higher than skin DWS, although it is inconclusive as the standard deviation for the spectra at that wavenumber is high. This indirectly suggests the thickening of the epidermis PWS as the epidermis has a stronger peak at 1307 cm−1 compared to the dermis [37]. Another interpretation is that the stronger band at 1307 cm−1 indicates that there could be more proteins and lipids with CH2 bonds, such as keratin and triolein [38,39], in the skin PWS.
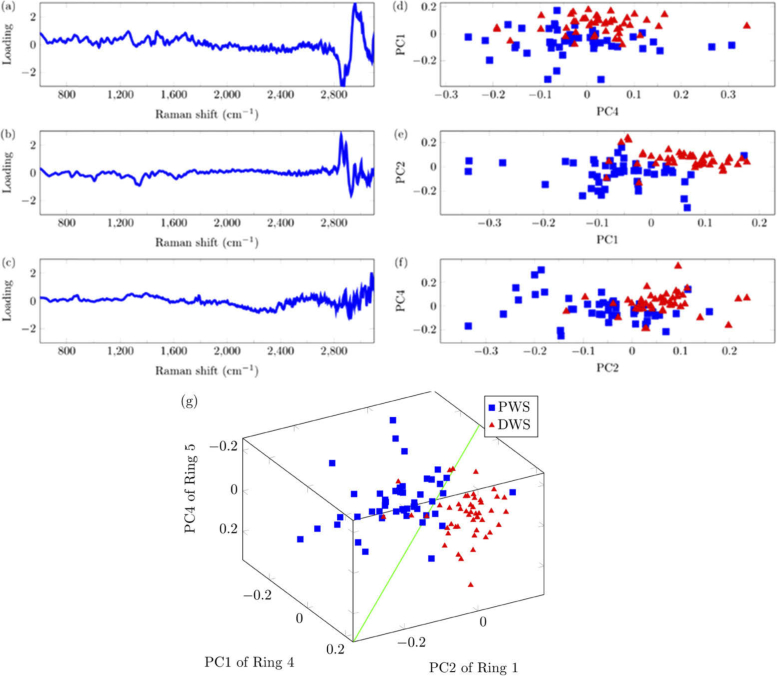
PLS and LDA analyses were conducted on the spectra. A reference value of 0 was assigned to the DWS group while a reference value of 1 was assigned to the PWS group. The average of all measurements was subtracted from each measurement and the residual spectra was decomposed into 15 PCs for each Ring. Using a Wilcoxon signed rank-test with significance level of p < 0.05, the top 3 PCs, PC1 from Ring 4, PC2 from Ring 1 and PC4 from Ring 5 were selected. The PC coefficients in Fig. 7 showed statistically significant differences between the PWS and DWS groups. The green hyperplane in Fig. 7(g) represents the LDA classifier dividing the two groups. Note that Fig. 7 represents the PLS-LDA classification done without the leave-one-out method because the PCs and hyperplane are slightly different every iteration.
Fig. 7.
PLS-LDA plots showing the separation of spectra taken PWS (blue squares) and DWS (red triangles). The three PLS components showing most significant differences between two groups and the PC coefficients were plotted. (a) PC1 from Ring 4, (b) PC2 from Ring 1, (c) PC4 from Ring 5. (d)-(f) 2-D plots of separability. (g) 3-D plot showing separation between skin PWS and DWS. The diagonal green line represents the hyperplane dividing the DWS and PWS PCs.
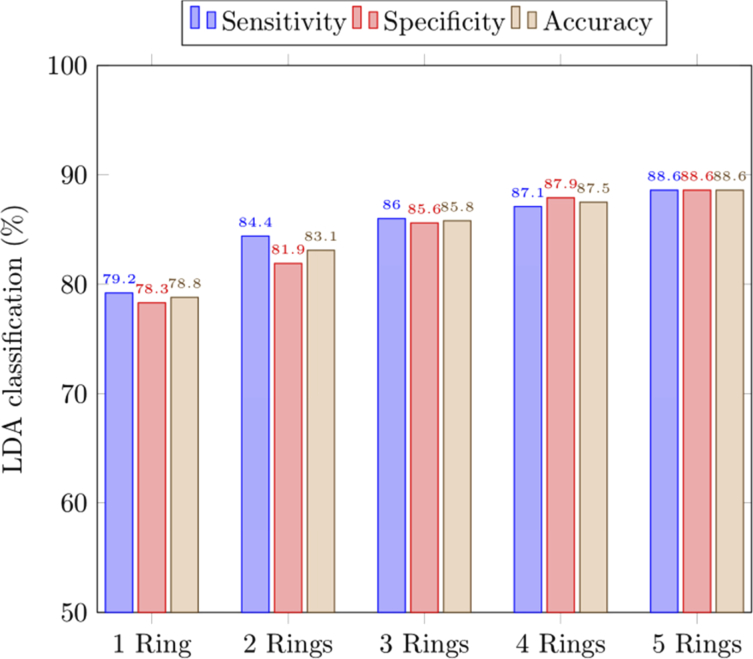
Using the leave-one-out validation method, the performance of the PLS-LDA classifier was evaluated in terms of accuracy, sensitivity and specificity, as presented in Fig. 8. The average accuracy in distinguishing skin PWS from skin DWS improved with increasing number of rings used, from 78.8% for one ring to 88.6% for all five rings. The sensitivity showed a 9.4% improvement from 79.2% using just one ring to 88.6% when all five rings were included. The specificity similarly improved by 10.3% from 78.3% to around 88.6%.
Fig. 8.
Classification accuracy achieved with LDA for differentiating between skin PWS and skin DWS using selected PCs from different combinations of rings. “1 Ring” refers to using data from one ring only while “2 Rings” refers to using data from two rings, and so on.
4. Discussion
The development of depth-sensitive RS for in vivo clinical diagnostics has shown promising results in recent years. The feasibility of technologies such as SORS has been demonstrated for transcutaneous tumor margin assessments [18]. We have presented in this study a snapshot depth-sensitive RS system intended for future preclinical in vivo studies of rat skin wounds. To test rat skin, the optics have been optimized for the creation of a concentrated focal line about 180 µm in length. Our instrument shows feasibility for discrimination of the heterogeneous layers of ex vivo skin and improving the accuracy of classification between wounded and healthy skin. It is expected to help expedite future preclinical research in assessing wound healing using RS, given its snapshot and depth sensitive features.
The findings in this study agree with the previous studies related to the use of RS to diagnose wound healing. Alimova et al. [14] evaluated healing in guinea pig skin by comparing the amide III band at 1247 cm−1 to the elastin and keratin bands at 1326 cm−1. Their results indicate that the intensity of the 1326 cm−1 peak got comparatively stronger to the 1247 cm−1 peak 48 hours post-wounding. This agrees well with our results which show an increase in the 1307 cm−1 peak relative to its shoulder in tissues 24 hours post-wounding.
Our instrument differs from earlier reported Raman devices for diagnosing skin wounds by measuring additional Raman spectra from along the depth dimension in one snapshot. These spectra may supplement or reinforce existing diagnostic information to improve the classification performance of the diagnosis. Compared to other techniques such as confocal RS that require axial scanning to measure spectra from different depths, our snapshot technique focused a focal line onto the sample such that information from different depths could be acquired simultaneously. When we used only information acquired from one ring of the fiber bundle, the classification yielded a sensitivity of 79.2% and specificity of 78.3% on average. When the data from more rings were included, the sensitivity increased monotonically up to 88.6% for five rings as shown in Fig. 8, which demonstrated the advantage of the snapshot depth sensitive RS in sensitivity. Further improvements may be possible by fine-tuning our classifier to track changes in the spectra of skin throughout the phases of wound healing [11].
At present, the Raman instrument cannot image the wound margin all at once nor perform volumetric imaging. Nevertheless, the PLS analysis in this study highlighted certain spectral regions of note that could potentially be used for complementary techniques such as spectroscopic Raman imaging. We have previously demonstrated a method to take Raman images in the presence of fluorescence using Wiener estimation [40]. To accomplish this, a scanning system and programmable optical filter [41] can be added onto the existing instrument. The filter is programmed using PCs first derived from the PLS Analysis of the spectra with fluorescence background, and then the scanning system performs depth scans of the wound based on the specified PCs. A stack of images showing the wound margin, one image per ring, could be acquired in this way.
Also, the current fiber bundle design limits the spectral resolution of our instrument. Firstly, the diameter of each fiber is 125 µm. At the DE of the fiber bundle, the fibers are arranged as two columns. Thus, to maximize optical throughput, the slit width would need to be 250 µm. At this width, the spectral resolution would be unreasonably high, over 25 cm−1, and many Raman peaks could be indistinguishable. Secondly, because the spectra from rings 3 to 5 is the superposition of spectra from two fibers, to compare our spectra to others requires the deconvolution of spectra using the impulse response followed by a reconstruction of the spectra. To circumvent this, we are currently designing an alternative approach such that the focal line can be imaged directly onto the CCD instead of passing through a fiber bundle. The spectral resolution, spot size and axial resolution should be vastly improved as a result.
In short, this depth-sensitive RS instrument has the potential to provide non-invasive, low-cost and rapid diagnostic information for monitoring and testing skin wounds such as pressure ulcers and diabetic foot ulcers.
5. Conclusion
We demonstrate a snapshot depth-sensitive Raman spectroscopic instrument to measure Raman signals emitted along a focal line spanning the thickness of the rat’s skin. Raman signals from five target depths were acquired by five different fiber rings simultaneously. The device was tested on ex vivo wounded rat skin. A PLS-LDA analysis created classifiers between the wound edge and healthy skin based on the acquired spectra. The instrument can discriminate between the wound edge and healthy skin with good accuracy. Moreover, the accuracy of classification improves monotonically as more data from new depths are used, which implies that each depth offers additional information useful for classification. Therefore, this instrument demonstrates the ability to perform snapshot depth sensitive Raman measurements from rat skin, which paves the way towards in vivo preclinical studies of rat skin wounds.
Acknowledgments
We are grateful to the Skin Research Institute of Singapore for providing a collaboration platform that sparked many illuminating discussions with healthcare professionals, scientists and engineers.
Funding
Ministry of Education - Singapore10.13039/501100001459 (MOE2015-T2-2-112, MOE2017-T2-2-057); Nanyang Technological University10.13039/501100001475 (CG - 01/16, No. NAM/15004); Agency for Science, Technology and Research10.13039/501100001348 (H17/01/a0/008, H17/01/a0/0F9).
Disclosures
The authors declare that there are no conflicts of interest related to this article.
References
- 1.Singer A. J., Clark R. A., “Cutaneous wound healing,” N. Engl. J. Med. 341(10), 738–746 (1999). 10.1056/NEJM199909023411006 [DOI] [PubMed] [Google Scholar]
- 2.Zhang P., Lu J., Jing Y., Tang S., Zhu D., Bi Y., “Global epidemiology of diabetic foot ulceration: a systematic review and meta-analysis,” Ann. Med. (Abingdon, U. K.) 49(2), 106–116 (2017). 10.1080/07853890.2016.1231932 [DOI] [PubMed] [Google Scholar]
- 3.Capon A., Pavoni N., Mastromattei A., Di Lallo D., “Pressure ulcer risk in long-term units: prevalence and associated factors,” J Adv Nurs 58(3), 263–272 (2007). 10.1111/j.1365-2648.2007.04232.x [DOI] [PubMed] [Google Scholar]
- 4.Netscribes , “Global Wound Care Product Market (2018-2023),” (researchandmarkets.com, 2018).
- 5.Thomas D. R., Rodeheaver G. T., Bartolucci A. A., Franz R. A., Sussman C., Ferrell B. A., Cuddigan J., Stotts N. A., Maklebust J., “Pressure ulcer scale for healing: derivation and validation of the PUSH tool. The PUSH Task Force,” Advances in wound care: the journal for prevention and healing 10, 96–101 (1997). [PubMed] [Google Scholar]
- 6.Woodbury M. G., Houghton P. E., Campbell K. E., Keast D. H., “Development, validity, reliability, and responsiveness of a new leg ulcer measurement tool,” Advances in Skin & Wound Care 17(4), 187–196 (2004). 10.1097/00129334-200405000-00018 [DOI] [PubMed] [Google Scholar]
- 7.Schultz G. S., Sibbald R. G., Falanga V., Ayello E. A., Dowsett C., Harding K., Romanelli M., Stacey M. C., Teot L., Vanscheidt W., “Wound bed preparation: a systematic approach to wound management,” Wound Repair Regen. 11(s1), S1–S28 (2003). 10.1046/j.1524-475X.11.s2.1.x [DOI] [PubMed] [Google Scholar]
- 8.Dowsett C., Gronemann M. N., Harding K., “Taking wound assessment beyond the edge,” Wounds International 6, 19–23 (2015). [Google Scholar]
- 9.Goldman R. J., Salcido R., “More than one way to measure a wound: an overview of tools and techniques,” Advances in skin & wound care 15(5), 236–243 (2002). 10.1097/00129334-200209000-00011 [DOI] [PubMed] [Google Scholar]
- 10.Gürsu K. G., “An experimental study for diagnosis of burn depth,” Burns 4(2), 97–103 (1977). 10.1016/0305-4179(77)90124-3 [DOI] [Google Scholar]
- 11.Jain R., Calderon D., Kierski P. R., Schurr M. J., Czuprynski C. J., Murphy C. J., McAnulty J. F., Abbott N. L., “Raman spectroscopy enables noninvasive biochemical characterization and identification of the stage of healing of a wound,” Anal. Chem. 86(8), 3764–3772 (2014). 10.1021/ac500513t [DOI] [PMC free article] [PubMed] [Google Scholar]
- 12.Chan K. A., Zhang G., Tomic-Canic M., Stojadinovic O., Lee B., Flach C. R., Mendelsohn R., “A coordinated approach to cutaneous wound healing: vibrational microscopy and molecular biology,” J. Cell. Mol. Med. 12(5b), 2145–2154 (2008). 10.1111/j.1582-4934.2008.00459.x [DOI] [PMC free article] [PubMed] [Google Scholar]
- 13.Flach C. R., Zhang G., Mendelsohn R., “Raman microscopy and imaging: applications to skin pharmacology and wound healing,” in Emerging Raman Applications and Techniques in Biomedical and Pharmaceutical Fields (Springer, 2010), pp. 365–384. [Google Scholar]
- 14.Alimova A., Chakraverty R., Muthukattil R., Elder S., Katz A., Sriramoju V., Lipper S., Alfano R., “In vivo molecular evaluation of guinea pig skin incisions healing after surgical suture and laser tissue welding using Raman spectroscopy,” J. Photochem. Photobiol., B 96(3), 178–183 (2009). 10.1016/j.jphotobiol.2009.06.004 [DOI] [PMC free article] [PubMed] [Google Scholar]
- 15.Yan W., Liu H., Deng X., Jin Y., Sun H., Li C., Wang N., Chu J., “Raman spectroscopy enables noninvasive biochemical identification of the collagen regeneration in cutaneous wound healing of diabetic mice treated with MSCs,” Lasers Med. Sci. 32(5), 1131–1141 (2017). 10.1007/s10103-017-2218-6 [DOI] [PubMed] [Google Scholar]
- 16.Gurtner G. C., Werner S., Barrandon Y., Longaker M. T., “Wound repair and regeneration,” Nature 453(7193), 314–321 (2008). 10.1038/nature07039 [DOI] [PubMed] [Google Scholar]
- 17.Matousek P., Clark I., Draper E., Morris M., Goodship A., Everall N., Towrie M., Finney W., Parker A., “Subsurface probing in diffusely scattering media using spatially offset Raman spectroscopy,” Appl. Spectrosc. 59(4), 393–400 (2005). 10.1366/0003702053641450 [DOI] [PubMed] [Google Scholar]
- 18.Keller M. D., Vargis E., Mahadevan-Jansen A., de Matos Granja N., Wilson R. H., Mycek M.-A., Kelley M. C., “Development of a spatially offset Raman spectroscopy probe for breast tumor surgical margin evaluation,” J. Biomed. Opt. 16(7), 077006 (2011). 10.1117/1.3600708 [DOI] [PMC free article] [PubMed] [Google Scholar]
- 19.Richters R. J., Falcone D., Uzunbajakava N. E., Varghese B., Caspers P. J., Puppels G. J., van Erp P. E., van de Kerkhof P. C., “Sensitive skin: assessment of the skin barrier using confocal Raman microspectroscopy,” Skin Pharmacol. Physiol. 30(1), 1–12 (2017). 10.1159/000452152 [DOI] [PMC free article] [PubMed] [Google Scholar]
- 20.Caspers P. J., Bruining H. A., Puppels G. J., Lucassen G. W., Carter E. A., “In vivo confocal Raman microspectroscopy of the skin: noninvasive determination of molecular concentration profiles,” J. Invest. Dermatol. 116(3), 434–442 (2001). 10.1046/j.1523-1747.2001.01258.x [DOI] [PubMed] [Google Scholar]
- 21.Liu W., Ong Y. H., Yu X. J., Ju J., Perlaki C. M., Liu L. B., Liu Q., “Snapshot depth sensitive Raman spectroscopy in layered tissues,” Opt. Express 24(25), 28312–28325 (2016). 10.1364/OE.24.028312 [DOI] [PubMed] [Google Scholar]
- 22.Lee Y., Hwang K., “Skin thickness of Korean adults,” Surgical and Radiologic Anatomy 24(3-4), 183–189 (2002). 10.1007/s00276-002-0034-5 [DOI] [PubMed] [Google Scholar]
- 23.Zaki S. M., “Characteristics of the skin of the female albino rats in different ages: histological, morphometric and electron microscopic study,” J. Cytol. Histol. S3, 1 (2015). 10.4172/2157-7099.S3-004 [DOI] [Google Scholar]
- 24.Chen L., Mirza R., Kwon Y., DiPietro L. A., Koh T. J., “The murine excisional wound model: contraction revisited,” Wound Repair Regen. 23(6), 874–877 (2015). 10.1111/wrr.12338 [DOI] [PMC free article] [PubMed] [Google Scholar]
- 25.Zomer H. D., Trentin A. G., “Skin wound healing in humans and mice: Challenges in translational research,” J. Dermatol. Sci. 90(1), 3–12 (2018). 10.1016/j.jdermsci.2017.12.009 [DOI] [PubMed] [Google Scholar]
- 26.Botcherby E., Juškaitis R., Wilson T., “Scanning two photon fluorescence microscopy with extended depth of field,” Opt. Commun. 268(2), 253–260 (2006). 10.1016/j.optcom.2006.07.026 [DOI] [Google Scholar]
- 27.Welford W. T., “Use of annular apertures to increase focal depth,” J. Opt. Soc. Am. 50(8), 749–753 (1960). 10.1364/JOSA.50.000749 [DOI] [Google Scholar]
- 28.Choquette S. J., Etz E. S., Hurst W. S., Blackburn D. H., Leigh S. D., “Relative intensity correction of Raman spectrometers: NIST SRMs 2241 through 2243 for 785 nm, 532 nm, and 488 nm/514.5 nm excitation,” Appl. Spectrosc. 61(2), 117–129 (2007). 10.1366/000370207779947585 [DOI] [PubMed] [Google Scholar]
- 29.Lieber C. A., Mahadevan-Jansen A., “Automated method for subtraction of fluorescence from biological Raman spectra,” Appl. Spectrosc. 57(11), 1363–1367 (2003). 10.1366/000370203322554518 [DOI] [PubMed] [Google Scholar]
- 30.Savitzky A., Golay M. J., “Smoothing and differentiation of data by simplified least squares procedures,” Anal. Chem. 36(8), 1627–1639 (1964). 10.1021/ac60214a047 [DOI] [Google Scholar]
- 31.Hjorth J. U., Computer intensive statistical methods: Validation, model selection, and bootstrap (Routledge, 2017). [Google Scholar]
- 32.Anguiano-Morales M., Mendez-Otero M. M., Iturbe-Castillo M. D., Chávez-Cerda S., “Conical dynamics of Bessel beams,” Opt. Eng. 46(7), 078001 (2007). 10.1117/1.2752167 [DOI] [Google Scholar]
- 33.Thomsen S. L., Vijverberg H., Huang R., Schwartz J. A., “Changes in optical properties of rat skin during thermal coagulation,” in Laser-Tissue Interaction IV, (International Society for Optics and Photonics, 1993), 230–237. [Google Scholar]
- 34.Jacobi U., Kaiser M., Toll R., Mangelsdorf S., Audring H., Otberg N., Sterry W., Lademann J., “Porcine ear skin: an in vitro model for human skin,” Skin Res. Technol. 13(1), 19–24 (2007). 10.1111/j.1600-0846.2006.00179.x [DOI] [PubMed] [Google Scholar]
- 35.Ong Y. H., Lim M., Liu Q., “Comparison of principal component analysis and biochemical component analysis in Raman spectroscopy for the discrimination of apoptosis and necrosis in K562 leukemia cells,” Opt. Express 20(20), 22158–22171 (2012). 10.1364/OE.20.022158 [DOI] [PubMed] [Google Scholar]
- 36.Mourant J. R., Short K. W., Carpenter S., Kunapareddy N., Coburn L., Powers T., Freyer J. P., “Biochemical differences in tumorigenic and nontumorigenic cells measured by Raman and infrared spectroscopy,” J. Biomed. Opt. 10(3), 031106 (2005). 10.1117/1.1928050 [DOI] [PubMed] [Google Scholar]
- 37.Nguyen T., Gobinet C., Feru J., Pasco S. B., Manfait M., Piot O., “Characterization of type I and IV collagens by Raman microspectroscopy: Identification of spectral markers of the dermo-epidermal junction,” Spectroscopy (N. Y., NY, U. S.) 27, 421–427 (2012). 10.1155/2012/686183 [DOI] [Google Scholar]
- 38.Lin-Vien D., Colthup N. B., Fateley W. G., Grasselli J. G., The handbook of infrared and Raman characteristic frequencies of organic molecules (Elsevier, 1991). [Google Scholar]
- 39.Feng X., Moy A. J., Nguyen H. T., Zhang J., Fox M. C., Sebastian K. R., Reichenberg J. S., Markey M. K., Tunnell J. W., “Raman active components of skin cancer,” Biomed. Opt. Express 8(6), 2835–2850 (2017). 10.1364/BOE.8.002835 [DOI] [PMC free article] [PubMed] [Google Scholar]
- 40.Chen S., Ong Y. H., Lin X., Liu Q., “Optimization of advanced Wiener estimation methods for Raman reconstruction from narrow-band measurements in the presence of fluorescence background,” Biomed. Opt. Express 6(7), 2633–2648 (2015). 10.1364/BOE.6.002633 [DOI] [PMC free article] [PubMed] [Google Scholar]
- 41.Kang J., Li X., Liu Q., “Hadamard transform-based calibration method for programmable optical filters based on digital micro-mirror device,” Opt. Express 26(15), 19563–19573 (2018). 10.1364/OE.26.019563 [DOI] [PubMed] [Google Scholar]


