Partial defoliation up-regulated photosynthesis and down-regulated expression of sucrose export-related genes in tomato leaves, and increased trans-zeatin riboside in the roots, implicating this cytokinin in root–shoot signaling.
Keywords: Cytokinin, leaf development, photosynthesis, Solanum lycopersicum, source–sink relationship, tomato, xylem
Abstract
Photosynthetic activity is affected by exogenous and endogenous inputs, including source–sink balance. Reducing the source to sink ratio by partial defoliation or heavy shading resulted in significant elevation of the photosynthetic rate in the remaining leaf of tomato plants within 3 d. The remaining leaf turned deep green, and its area increased by almost 3-fold within 7 d. Analyses of photosynthetic activity established up-regulation due to increased carbon fixation activity in the remaining leaf, rather than due to altered water balance. Moreover, senescence of the remaining leaf was significantly inhibited. As expected, carbohydrate concentration was lower in the remaining leaf than in the control leaves; however, expression of genes involved in sucrose export was significantly lower. These results suggest that the accumulated fixed carbohydrates were primarily devoted to increasing the size of the remaining leaf. Detailed analyses of the cytokinin content indicated that partial defoliation alters cytokinin biosynthesis in the roots, resulting in a higher concentration of trans-zeatin riboside, the major xylem-translocated molecule, and a higher concentration of total cytokinin in the remaining leaf. Together, our findings suggest that trans-zeatin riboside acts as a signal molecule that traffics from the root to the remaining leaf to alter gene expression and elevate photosynthetic activity.
Introduction
By the mid-21st century, global food production will no longer be able to keep pace with the world’s expanding population (Tilman et al., 2011). The forecast for the increasing world population along with decreasing arable land calls for the development of new technologies to increase yield production. Educational use of genetic diversity combined with modern molecular engineering tools has produced significant improvement in crop resistance to abiotic stresses (Mickelbart et al., 2015). Nevertheless, further yield increases require higher plant productivity under favorable conditions as well.
Agricultural yield accumulation is affected by the efficiency of light interception at the whole-plant level, conversion of the intercepted radiation into organic matter, and partitioning of the photoassimilates to the harvested organs (Monteith, 1977). Perhaps the most extensively studied plant process is photosynthesis. However, despite several successful studies indicating improvement in the fundamental parameters of photosynthesis per unit leaf area (Raines, 2011; Kromdijk et al., 2016), the ability to significantly increase potential crop productivity is still very limited. One might ask if plants can effectively use more fixed carbon. Studies on CO2 enrichment have proven that the answer is yes (Ainsworth and Long, 2005). The rate of photosynthesis increases in high CO2 environments, leading to increased accumulation of biomass (Poorter and Navas, 2003; Long et al., 2006), especially in fast-growing plants (Poorter and Navas, 2003).
The most complicated process, among the three determinants of yield accumulation, is the molecular mechanism controlling the partitioning of photoassimilates among the various importing organs (sinks). It is generally accepted that plant productivity is limited by source activity (photosynthesis). Favorable conditions for source functioning will increase sink metabolic activity, storage capacity, and carbon accumulation (Korner, 2015; Ort et al., 2015; Chang and Zhu, 2017). However, it is now evident that interactions between the carbon-assimilating organs (sources) and sinks are not unidirectional (Paul and Foyer, 2001; Turgeon and Wolf, 2009). This interaction between photosynthetic activity and utilization of the assimilated carbohydrates occurs at the chloroplast, leaf, and whole-plant levels (Paul and Foyer, 2001; Sonnewald and Fernie, 2018). Numerous studies support the notion that photosynthetic activity is affected by sink demand (Paul and Foyer, 2001; Sonnewald and Fernie, 2018). For example, a disruption in source–sink balance often results in up-regulation of photosynthetic rate per unit leaf area (McCormick et al., 2006). This indicates that the actual photosynthetic rate, even under favorable conditions, falls short of its potential. It seems that plants have already evolved a mechanism to up-regulate photosynthesis, which is controlled at the whole-plant level and regulated by the long-distance signaling network.
The source to sink ratio can be easily reduced by partial shading of leaves or defoliation. This simple treatment often results in significantly higher photosynthetic rate of the remaining leaves. This response has been observed in numerous crop plants, such as cotton (Ludwig et al., 1965), alfalfa (Baysdorfer and Bassham, 1985), bean (von Caemmerer and Farquhar, 1984), sugarcane (McCormick et al., 2006), and eucalyptus (Turnbull et al., 2007; Eyles et al., 2013).
The underlying mechanism responsible for up-regulation of photosynthesis is still not clear. Several reports have indicated an elevation in chlorophyll content and an increase in biochemical reaction rates (von Caemmerer and Farquhar,1984; Ozaki et al., 2004; Pinkard et al., 2011; Eyles et al., 2013). Partial defoliation of bean plants resulted in an increased photosynthetic rate for the remaining leaves within 2–3 d, up to ~100% higher activity than that measured for control leaves after 8–12 d. This significant up-regulation of photosynthesis was associated with parallel higher in vitro Rubisco activity and a significant decrease in intercellular CO2 concentration (von Caemmerer and Farquhar, 1984). A similar effect on the photosynthetic rate was observed after partial leaf shading in soybean (Peet and Kramer, 1980) and sugarcane (McCormick et al., 2006) plants. On the other hand, removal of 50% of the leaves from the upper canopy of eucalyptus trees altered water relations in the remaining canopy (Quentin et al., 2011). Another study established an increase in stomatal conductance and transpiration rate within 10–15 h after partial defoliation of sugarcane plants (Meinzer and Grantz 1990). Interestingly, in addition to up-regulation of photosynthesis, the remaining leaves thickened substantially, and their senescence was markedly delayed. These phenotypic changes resemble those in response to increased cytokinin (CK). It is therefore logical to assume that translocation of root-derived CK to the remaining leaves via the xylem is enhanced following partial defoliation. This assumption is further supported by the finding that up-regulation of photosynthesis in response to defoliation can be negated by removing root mass (Wareing and Khalifa, 1968).
In the current study, we characterized the effect of partial defoliation on photosynthesis, and morphological changes in the remaining leaf of tomato plants. Determination of diurnal changes in sugar and starch concentrations together with analyses of expression of genes and proteins indicated that phloem loading is inhibited as an early response to partial defoliation, suggesting that the excess assimilated carbon is destined to leaf expansion to increase source size. Altered proportions of CK derivatives, measured in the roots of partially defoliated plants, suggest that trans-zeatin riboside (tZR) molecules act as long-distance signaling agents that traffic to the remaining leaf via the xylem to alter its development and function.
Materials and methods
Plant materials, growth conditions, and partial defoliation or shading
Tomato (Solanum lycopersicum L. cv. M82) plants were sown in trays filled with 70% coconut fiber, 30% vent materials, fertilizers, and nutrients in a temperature-controlled growth chamber. Air temperatures were 25/18±2 °C day/night, respectively, and light intensity was 180 µmol m−2 s−1. The photoperiod was set at 12 h. Seedlings (4 weeks old) were transferred to 1 liter pots and grown in a greenhouse at 28/20±2 °C (day/night, respectively) under natural light.
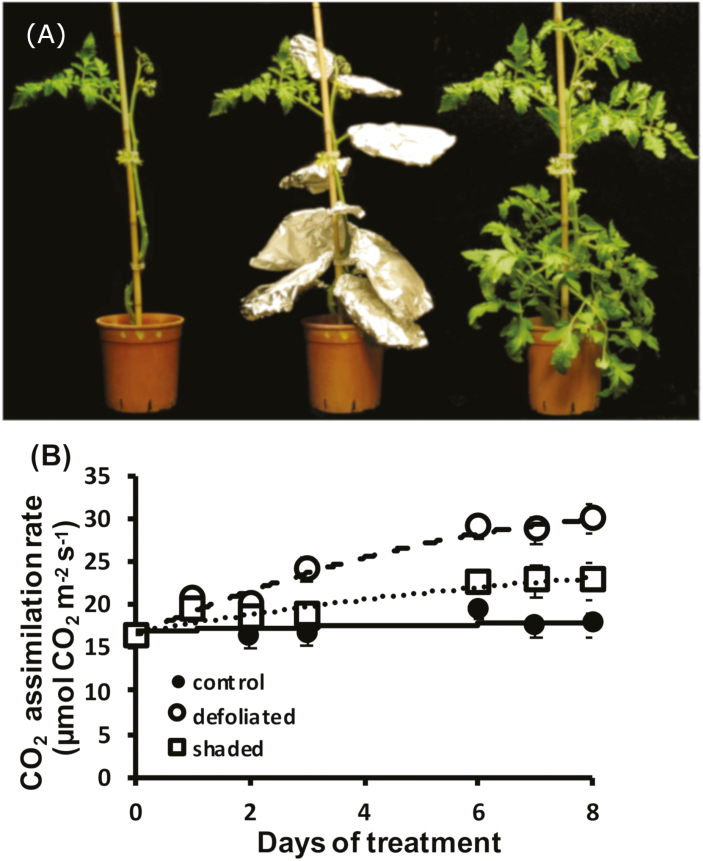
For partial shading experiments, all leaves except for the youngest fully expanded leaf (number 4 or 5 from the top, with leaf number 1 being the first to reach a length of 3 cm) were covered with aluminum foil. For partial defoliation, all leaves except for the youngest fully expanded one were carefully cut near the stem with a sharp surgical knife (Fig. 1A). Partial defoliation was performed at two developmental stages: vegetative—when plants had 8±1 leaves, before flower initiation, and reproductive—1 week after anthesis of the first flowers.
Fig. 1.
Photosynthesis of partially defoliated and shaded tomato plants. (A) Picture of a tomato plant, var. M82 (right), partially shaded (middle) and partially defoliated (left). (B) Photosynthetic rate of remaining tomato leaves after partial defoliation or shading of the other leaves. Bars indicate the SE of six replications.
Gas exchange measurements
Gas exchange measurements were taken with an LI-6400 portable gas exchange system (LI-COR Biosciences). Photosynthesis, CO2 concentration in the substomatal cavities (Ci), stomatal conductance, and transpiration rates were measured in the greenhouse. Measurements were performed at around noon under a constant CO2 concentration of 400 ppm and constant photosynthetic photon flux density (PPFD) of 1200 µmol m−2 s−1. To determine CO2 response curves, plants were subjected to 200, 400, 600, 800, 1000, 1200, and 1400 µmol m−2 s−1 CO2. To determine light response curves, plants were dark adapted for 1 h and then subjected to 100, 400, 600, 900, 1200, 1500, and 1800 µmol photons m−2 s−1.
Leaf area and chlorophyll determination
The area of detached leaves was measured using a LI-COR Li-3100 area meter. Continuous measurement of attached leaves was performed following leaf scanning by a portable scanner and image analyses with ImageJ software (http://rsb.info.nih.gov/ij/).
Chlorophyll content was determined as described previously (Moran, 1982). Five leaf discs (50.24 mm2 each) were excised from leaves between the minor ribs and placed in 10 ml of N,N-dimethylformamide solution for 48 h at 4 °C in the dark. The absorbance of the supernatant was measured at 647 nm and 664 nm, and chlorophyll content was computed using the formula: Chl a+b (mg ml−1)=10×(0.02027×A647+0.00704×A664).
Microscopic analyses of cell size, and stomatal aperture and density
Diameters of epidermal cells and stomata, and stomatal density were determined using an imprinting procedure. Samples were taken at around 10.00 h. Transparent nail polish was brushed on the abaxial side of the second leaflet from the tip of the youngest fully expanded leaf, dried for ~1 min, and then removed with sticky tape. The nail polish imprints were placed on glass cover slips and photographed under an inverted microscope (Zeiss, Axiovert 200M) with a mounted Hitachi HV-D30 CCD camera. Epidermal and stomatal images were later analyzed to determine stomatal density and aperture using the ImageJ software fit-line tool. Stomatal aperture was calculated based on the longitudinal and vertical diameters. A microscopic ruler was used for size calibration.
Starch and sugar determination
Leaf carbohydrate content was determined as described previously (Olesinski et al., 1996). Briefly, six leaf discs (50.24 mm2 each) were sampled between the ribs of the first fully expanded leaf and placed directly into liquid nitrogen. Soluble sugars were extracted in 80% (w/v) ethanol and, after evaporating the supernatant, sugars were re-dissolved in purified water and filtered through a 0.45 µm membrane HPLC filter (PALL). Sugars were separated in an analytical HPLC system (Jasco PU-2080 plus) equipped with an auto-sampler (AS-2055 plus) and fitted with a Sugar-Pak I column (6.5 mm×300 mm, Waters) using refractive index detector 475 (Kontron Instruments). Starch content was determined in the ethanol–water-extracted leaf discs following starch conversion by amyloglucosidase (Sigma-Aldrich). Starch content as glucose equivalents was determined using the Glucose (HK) Quantitative Determination Kit (Sigma-Aldrich).
RNA isolation and RT–PCR
Total RNA was extracted from 500 mg of tissue of the remaining and parallel control leaves using TRI Reagent (Sigma-Aldrich) according to the manufacturer’s protocol. cDNA was prepared from the same amounts of RNA (1 μg) per sample pre-treated with 1 U μg−1 RQ1 DNAse (Promega, http://www.promega.com), using the High-Capacity cDNA RT Kit from Applied Biosystems (Thermo Fisher Scientific, https://www.thermofisher.com). A 5 μl aliquot of cDNA was taken for PCR amplification. Real-time reverse transcription–PCR (RT–PCR) was carried out using 0.5 µl of 2.5 pmol of each primer (Table 1), 4 µl of cDNA, and 5 µl of ABsolute™ Blue QPCR SYBR® Green ROX Mix. PCR conditions were as follows: 94 °C for 10 s, 55 °C for 30 s, and 72 °C for 30 s, repeated 40 times. The obtained cycle temperature (CT) values were analyzed with Rotor-Gene 6000 Series software by averaging the two independently calculated normalized expression values of the duplicates. The calculated numerical values were divided by the values obtained for the housekeeping gene tubulin in each respective sample.
Table 1.
Primers used to quantify the expression levels of genes encoding various sucrose transporters, using real-time PCR analysis
| Gene | Forward primer (5’→3’) | Reverse primer (5’→3’) |
|---|---|---|
| Tubulin | GAAAGCCTACCATGAGCAGC | CTTTGGCACAACATCACCAC |
| SlSUT1 | CAGATTGGATGGCTAAGGAG | CTTAGCACCACCGATCTTCT |
| SlSUT4 | GGTTGGGCGTTACAACTATC | CGACTTGTGCACTTGTCACT |
| SlSweet11a | GAAAGCCAGGGTCCATACTA | CCACACTCTTGGTCTTGATG |
| SlSweet12a | CTCTACCTTCTCTACGCACCA | TGGTGCGTAGAGAAGGTAGAG |
| SlcycD3 | GCTTAAGCCTTGCATTGGAG | TCAATGTTGCAAGCCACTTC |
Protein extraction and western blot analyses
Leaf samples were ground in liquid nitrogen, suspended in 300 μl of 4× protein sample buffer (40% glycerol, 8% SDS, 4% β-mercaptoethanol, pH 6.8), and centrifuged at 10000 g (4 °C). The supernatant was collected for protein analysis. Protein content was determined using a Bradford protein assay kit (Sigma-Aldrich, www.sigmaaldrich.com). Protein extracts were further separated by RunBlue™ 12% acrylamide SDS–PAGE (www.expedeon.com) and electroblotted. Blots were blocked and incubated with rabbit polyclonal antibodies (1:1000 dilution) directed against potato SUT1 and SUT4 (a gift from Dr Christina Kühn, Humboldt University Berlin) in milk/PBS/Tween (5% skim milk, 0.1% Tween in TBS). Horseradish peroxidase-conjugated goat anti-rabbit antibody (Sigma-Aldrich) was used as the secondary antibody (1:50000 dilution). Detection was performed by film exposure after WesternBright Quantum ECL (Advansta) reaction, using an enhanced chemiluminescence system (ImageQuant LAS4000 mini- Danyel Biotech). Expression of Rubisco was determined by Ponceau staining of the large subunit fragment (~55 kDa). The intensity of the target bands was assayed using ImageJ software.
Hormone extraction and analyses
For CK analyses, plant material (150 mg) was ground using a vibration mill and extracted with Bieleski solvent (Bieleski, 1964). Stable isotope-labeled CK internal standards were added before extraction (Olchemim) and CKs were purified using SCX SPE columns (Agilent) and quantified by LC-positive electrospray-tandem MS in a multiple reaction monitoring mode (Holubová et al., 2018).
For analyses of abscisic acid (ABA) and its conjugates, the plant tissue (20 mg) was ground using a vibration mill and extracted with cold methanol/water/acetic acid (10:89:1, v/v/v). Stable isotope-labeled internal standards were added before extraction. ABA and conjugates were purified by solid-phase extraction on Oasis® HLB cartridges (Waters). The evaporated samples were subsequently methylated, purified by ABA-specific immunoaffinity extraction (Hradecká et al., 2007), and analyzed by LC-positive electrospray-tandem MS in a multiple reaction monitoring mode (Turečková et al., 2009).
Statistical analysis
ANOVA and mean comparison were calculated by Student’s t-test to compare two variables or by the Tukey–Kramer HSD test for multivariate analysis (α<0.05), using JMP Pro version 14 (SAS Institute).
Results
Up-regulation of photosynthetic activity by reducing the source to sink ratio
A simple way to decrease the source to sink ratio is by partial defoliation or heavy shading (Fig. 1A). Removal or shading of all but the youngest fully expanded source leaf caused a significant elevation in the photosynthetic rate in the remaining leaf of tomato plants (Fig. 1B). Partial defoliation may lead to a systemic array of responses related to wounding, while shading probably causes a starvation response of the shaded leaves. Nevertheless, in most experiments, the effect of defoliation was similar to that of heavy shading and, therefore, subsequent experiments were performed with defoliated and non-defoliated (control) tomato plants.
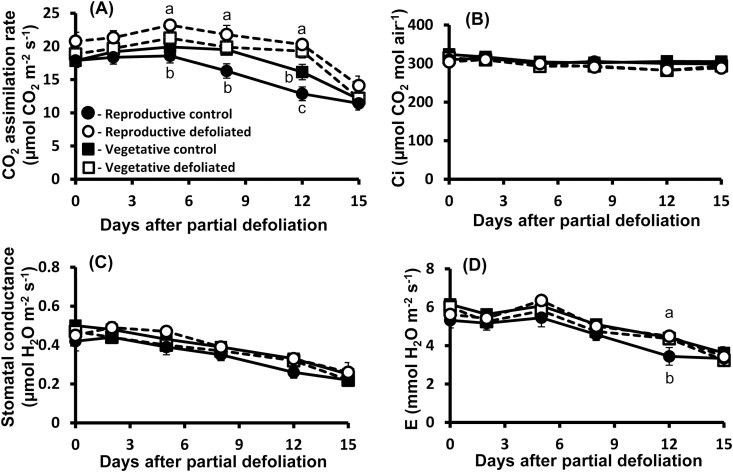
To further explore the effect of the source–sink relationship on photosynthetic activity, plants were partially defoliated at two developmental stages. Although up-regulation of photosynthetic activity following partial defoliation was evident in both cases, the effect of this treatment was much more pronounced in mature plants bearing fruit (Fig. 2A). It should be noted that all photosynthesis measurements at the vegetative stage were performed before anthesis. The average increase in the photosynthetic rate in plants at the reproductive stage was ~30% from 5 d to 12 d after leaf removal (Fig. 2A).
Fig. 2.
Effect of source–sink relationship on the photosynthetic activity response to partial defoliation. Photosynthetic rate (A), Ci, CO2 concentration in the intercellular space (B), stomatal conductance (C), and transpiration rate (D) of remaining tomato leaves after partial defoliation of the other leaves (open symbols). Defoliations were performed on either young plants at the vegetative stage (squares) or mature plants at the reproductive stage (circles) in a temperature-controlled greenhouse (25 °C/18 °C day/night). Broken lines and open symbols represent partially defoliated plants; solid lines and closed symbols represent control plants. Student’s t-test was used to compare mean values of six plants. Different lower case letters indicate a significant difference at P<0.05.
More detailed analyses of photosynthetic activity indicated that elevation of photosynthesis is not associated with significant changes in the concentration of CO2 in the intercellular spaces (Fig. 2B). It was evident, therefore, that partial defoliation resulted in an increase in the photosynthetic rate per internal CO2 concentration, indicating more efficient biochemical activity of carbon fixation. As expected, a gradual decrease in stomatal conductance and transpiration rate was associated with leaf aging, but it was similar for all leaves (Fig. 2C, D). These results suggested that increasing photosynthetic activity is due to higher biochemical activity rather to reduced stomatal resistance to CO2 diffusion. It should be noted that stomatal size was significantly larger in the remaining leaf, 8 d after partial defoliation, but stomatal density was significantly lower in those leaves as compared with the parallel control leaves (Table 2).
Table 2.
Diameter of epidermal cells, stomatal density, and stomatal aperture in the remaining tomato leaf after partial defoliation of the other leaves
| Epidermal cell diameter (µm) | Stomatal number per mm2 | Stomatal aperture (µm2) | |
|---|---|---|---|
| Control | 55.6±3.2 b | 194±8 a | 51.3±3.0 b |
| Partially defoliated | 75.6±3.5 a | 116±8 b | 63.8±1.6 a |
Data represent means (±SE) of six replications. Different letters indicate significant differences between control and defoliated plants using Student’s t-test (P<0.05).
Analyses of the CO2 response curves (Fig. 3A) further supported the notion that partial defoliation enhances carbon fixation activity. The initial slope of the remaining leaf, 7 d after partial defoliation, was 0.1055, significantly higher than that measured for the parallel control leaf (0.0873). Similar significant differences were observed in the light response curve (Fig. 3B). Control leaves reached maximal photosynthetic activity at ~1000 µmol m−2 s−1, while the rate of photosynthesis of the remaining leaves did not reach the maximal level even when the PPFD was elevated to 2000 µmol m−2 s−1, indicating higher electron transport capacity. When analyzed on a leaf area basis, chlorophyll concentration in the remaining leaf 4 d after defoliation was similar to that of the parallel leaf in non-defoliated plants. However, this concentration remained constant in the remaining leaf even >8 d after defoliation, whereas a significant decrease was observed in leaves of control plants (see Supplementary Fig. S1A at JXB online). Due to leaf thickening, chlorophyll concentration per leaf fresh weight was similar in the remaining and control leaves (Supplementary Fig. S1B).
Fig. 3.
Effect of partial defoliation on carboxylation activity and the photochemical system of the remaining leaf. Photosynthetic rate per internal CO2 (Ci) concentration (A) and per photon flux density (PPFD) unit (B) in the remaining tomato leaf after defoliation of the other leaves (B). Defoliations were performed on mature plants grown in a temperature-controlled greenhouse (25 °C/18 °C day/night). Response curves were measured in control plants (filled circles) and partially defoliated plants (open circles) 7 d after defoliation. Numbers in (A) indicate angles of initial slopes. Student’s t-test was used to compare mean values of six plants. *P<0.05.
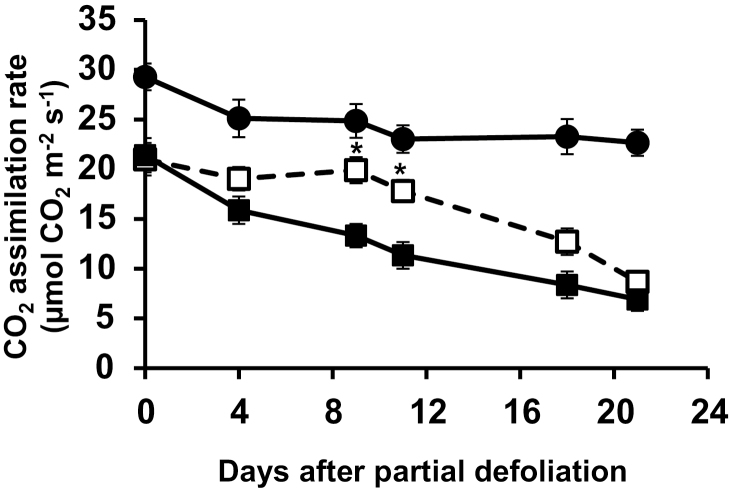
The effect of partial defoliation on photosynthetic activity was not confined to young mature leaves. Removal of all leaves except for an old but healthy leaf (third from the bottom in plants having 12 leaves) also up-regulated this leaf’s photosynthetic rate (Fig. 4). Rejuvenation of the old leaf was only partial, as its photosynthetic rate was ~40% lower than that measured for the young mature leaf.
Fig. 4.
Rejuvenation of mature leaf by partial defoliation. Photosynthetic rate of the remaining tomato leaf after partial defoliation of the other leaves (open squares). The remaining leaf was the third from the bottom (old) in mature plants having 10–12 leaves. Similar age leaves (filled squares) and the youngest fully expanded leaves in non-defoliated plants (filled circles) served as controls. An asterisk indicates a significant difference (P<0.05, by Student’s t-test) between old leaves in partially defoliated and non-defoliated plants.
Effect of partial defoliation on leaf growth and carbohydrate partitioning in the remaining leaf
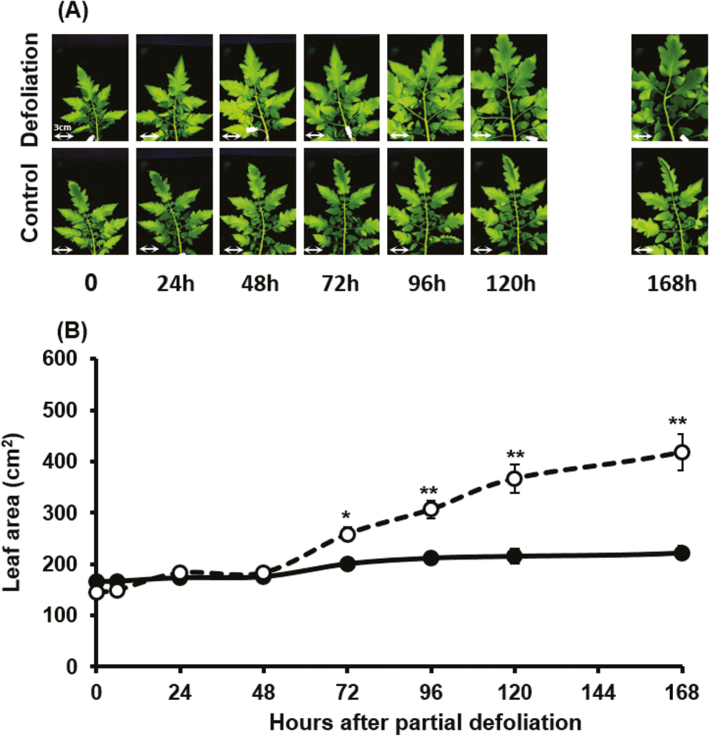
In addition to the elevated photosynthetic rate per unit leaf area, partial defoliation resulted in significant enlargement of the remaining leaf (Fig. 5). The size of the selected control leaf increased by ~50% over the first 7 d of the experiment. However, partial defoliation resulted in an almost 3-fold size increase of the remaining leaf during this period. The effect of leaf removal was apparent only 3 d after partial defoliation (Fig. 5B), similar to the observed increase in photosynthetic activity. Relative expression of SlcycD3 in the remaining leaf was up-regulated 2 d after defoliation (Supplementary Fig. S2). Interestingly, relative expression of this gene in control leaves was similar at all measured dates, and up-regulation of expression in the remaining leaf was transient. These results suggest that leaf expansion commences with a new phase of cell divisions. Measurements of the average diameter of epidermis cells indicated that the cell size (area) of the remaining leaves was almost twice that measured in the control leaves (Table 2; Supplementary Fig. S3), indicating that a major factor influencing leaf size is cell enlargement. Due to this size increase, stomatal density in the remaining leaf was significantly lower (Table 2; Supplementary Fig. S3).
Fig. 5.
Effect of partial defoliation on the expansion rate of the remaining leaf. Pictures of leaf number 4 from the top (A) and leaf area measurements (B) after partial defoliation of tomato plants. Defoliations were performed on mature plants grown in a temperature-controlled greenhouse (25 °C/18 °C day/night). Broken lines and open symbols represent partially defoliated plants; solid lines and filled symbols represent control plants. Scale bars=3 cm for all pictures. Student’s t-test was used to compare mean values of six plants. *P<0.05, **P<0.01.
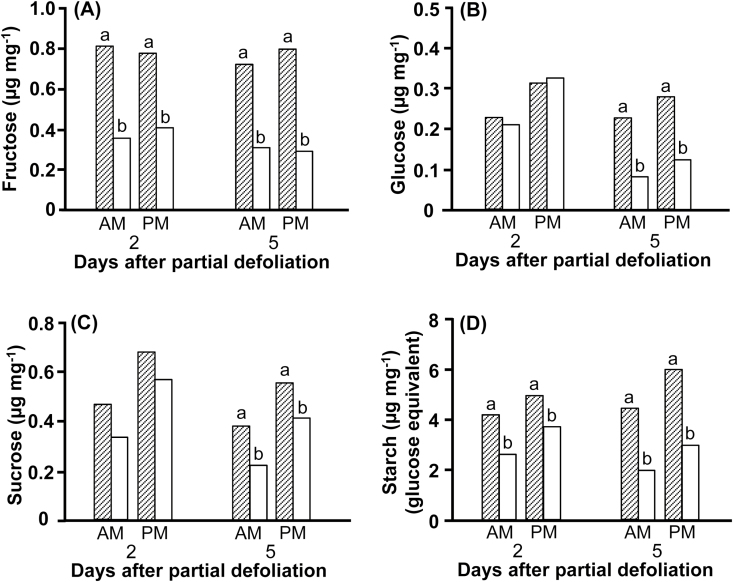
It is logical to assume that up-regulation of photosynthesis following partial defoliation is due to the increased demand for photoassimilates imposed by the various plant organs from the single remaining source leaf. Thus, the sugar export rate from the remaining leaf should be higher, with less sucrose and starch accumulated during the daytime. As expected, the concentrations of reducing sugars, sucrose, and starch were lower in the remaining leaves than in the parallel control leaves (Fig. 6). The reduction in fructose and starch concentrations was evident 2 d after defoliation (Fig. 6A, D); however, the values of the reducing sugars, sucrose, and starch (in the morning and evening) were reduced in the remaining leaf from 2 d to 5 d after partial defoliation, resulting in more pronounced differences after 5 d. Sucrose and starch are the main temporary storage compounds accumulated during the day for continuous export to the various sink organs during the dark hours. Interestingly, the difference between the concentrations of sucrose and starch in the evening and morning were similar for both remaining and control leaves.
Fig. 6.
Effect of partial defoliation on carbohydrate concentrations in the remaining leaf. Fructose (A), glucose (B), sucrose (C), and starch, as glucose equivalent, (D) concentrations in leaves of partially defoliated (open bars) and control (hatched bars) M82 tomato plants. Samples were collected 2 d and 5 d after partial defoliation at 07.00–08.00 h and 17.00–18.00 h. Data represent means (±SE) of six biological replications. Different letters indicate significant differences between control and partially defoliated plants at each time point using Student’s t-test (P<0.05).
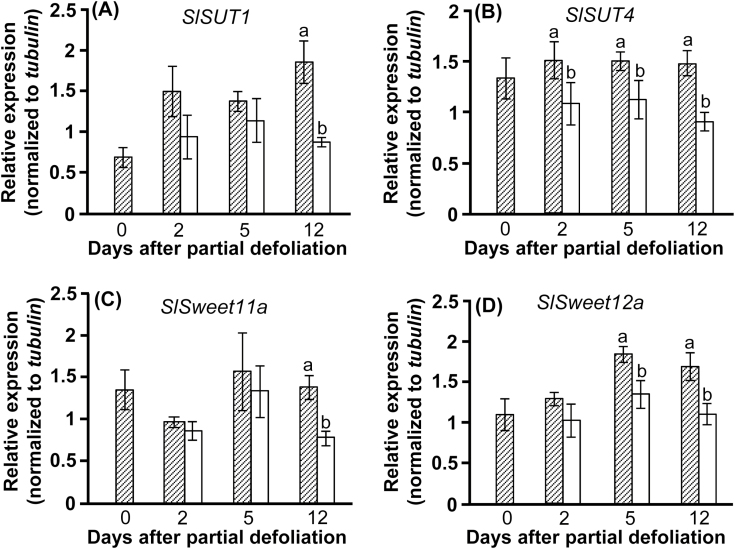
To further examine the effect of partial defoliation on the functioning of the remaining leaf as a source, we analyzed the expression of genes involved in phloem loading. SUT1s are characterized by high affinity for sucrose and were identified as the main transporters controlling sucrose loading into the phloem of plants in the Solanaceae (Kühn et al., 1997). Most SUT4 members are characterized by low affinity for sucrose but with a high Vmax, and are thought to be regulators of SUT1 activity (Weise et al., 2000). A more recent study established the role of AtSWEET11 and AtSWEET12 transporters in phloem loading of Arabidopsis plants (Chen et al., 2012).
Interestingly, partial defoliation down-regulated the expression of SlSUT1, SlSUT4, SlSweet11a, and SlSweet12a genes (Fig. 7). Lower expression levels were obtained 2 d after defoliation, with statistically significant differences in the relative expression of SlSUT4. These differences were more pronounced after 5 d, when significantly lower expression levels were measured for SlSUT4 and SlSweet12a. Relative expression of all four genes was lower in the remaining leaf than in the parallel control leaves, even 12 d after defoliation. Western blot analysis confirmed that expression of SlSUT1 and SlSUT4 proteins was significantly lower in the remaining leaf 8 d after defoliation as compared with control leaves (Supplementary Fig. S4).
Fig. 7.
Partial defoliation inhibits expression of sucrose transporter genes in the remaining leaf. Relative expression of SlSUT1 (A), SlSUT4 (B), SlSweet11a (C), and SlSweet12a (D) in leaves of partially defoliated (open bars) and control (hatched bars) M82 tomato plants. Samples were collected before defoliation (0), and 2, 5, and 12 d after partial defoliation. Data represent means (±SE) of six biological replications. Different letters indicate significant differences between control and partially defoliated plants at each time point using Student’s t-test (P<0.05).
CK and ABA involvement in the response to partial defoliation
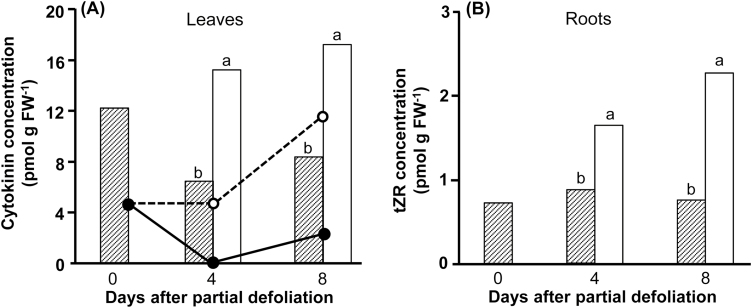
The delayed senescence, accumulation of chlorophyll, and significant leaf expansion indicated the involvement of CK in the response to the altered source–sink relationship. As predicted, total CK concentration in the remaining leaf was about double that measured in the parallel control leaf 4 d or 8 d after defoliation (Fig. 8A). Major CK derivatives contributing to the significantly higher CK concentration in the remaining leaf were cis- and trans-zeatin monophosphate. Interestingly, total CK levels in the roots of partially defoliated and control plants were similar (data not shown), but the percentages of the various CK derivatives were significantly different. Major changes were monitored in the levels of tZR, which was significantly higher in roots of partially defoliated compared with control plants (Fig. 8B). As the total CK concentration in the roots was similar, the percentage of tZR in roots of partially defoliated plants increased from ~2% in control plants to 3.7% and 6.3% after 4 d and 8 d, respectively.
Fig. 8.
Elevation of cytokinin concentration in the remaining leaf and roots of partially defoliated tomato plants. Cytokinin concentration in leaves (A) and roots (B) of partially defoliated (open bars) and control (hatched bars) M82 tomato plants. (A) Total cytokinin (bars) and trans-zeatin monophosphate (lines) concentrations in the youngest fully expanded leaf (#5 from the top) of partially defoliated (broken line) and control (solid line) plants. (B) trans-zeatin riboside (tZR) concentrations in roots. Samples were collected before (0), and 4 d and 8 d after partial defoliation. Data represent means (±SE) of six biological replications. Different letters indicate significant differences between control and defoliated plants at each time point using Student’s t-test (P<0.05).
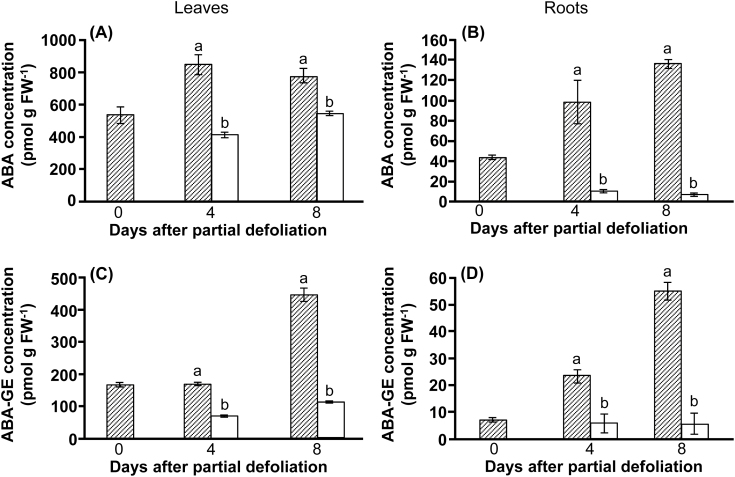
The effect of ABA on stomatal functioning and photosynthesis is well documented (for a review, see Chater et al., 2015). ABA is also considered a CK antagonist. Partial defoliation indeed significantly decreased the content of ABA and its main conjugate, ABA glucosyl ester, in the remaining leaf (Fig. 9A, C). Interestingly, the effect of defoliation on ABA content in the roots (Fig. 9B, D) was even more pronounced than that in leaves.
Fig. 9.
Reduced ABA concentration in the remaining leaf and roots of partially defoliated tomato plants. ABA (A, B) and ABA glucosyl ester (ABA-GE) (C, D) concentration in leaves (A, C) and roots (B, D) of partially defoliated (open bars) and control (hatched bars) M82 tomato plants. Samples were collected before defoliation (0), and 4 d and 8 d after partial defoliation. Data represent means (±SE) of six biological replications. Different letters indicate significant differences between control and partially defoliated plants at each time point using Student’s t-test (P<0.05).
Discussion
Previous research has established that the actual photosynthetic rate of a young mature leaf can be up-regulated by partial defoliation or shading of the other leaves (von Caemmerer and Farquhar, 1984; McCormick et al., 2006; Turnbull et al., 2007; Eyles et al., 2013). However, little is known about the endogenous mechanism involved in the control of leaf photosynthetic activity. Our findings suggest that partial defoliation elicits activity of a specific long-distance signaling network that operates between the roots and remaining leaves, and is associated with alterations in CK biosynthesis and accumulation.
Over 40 years ago, Hodgkinson (1974) proposed that changes in the photosynthetic rate can be explained by the plant’s requirement to restore the source–sink balance. Partial defoliation decreases the source size, and concomitantly decreases its strength, while sink demand barely changes. The increased demand for carbohydrates imposed on the remaining leaves drives photosynthetic activity upwards. This hypothesis was supported by the differential photosynthetic response to partial defoliation at two developmental stages (Fig. 2). Up-regulation of photosynthesis in the remaining leaf was much more pronounced at the reproductive stage of tomato plants than in young plants defoliated before flowering. In this respect, it is interesting to note that such an alteration in the photosynthetic machinery is also evident in old leaves, not only in the youngest mature one (Fig. 4).
The response of the remaining leaves to partial defoliation is often attributed to accumulation of chlorophyll, increased concentration of Calvin cycle enzymes, ribulose 1,5-biphosphate (RuBP) regeneration, and/or increased Rubisco activity (Brooks, 1986; Rao and Terry, 1989; reviewed by Turnbull et al., 2007). Partial shading of sugarcane plants resulted in higher carboxylation efficiency and electron transfer rate in the unshaded leaf (McCormick et al., 2006). An alternative explanation to the increased photosynthesis relates to altered water status in partially defoliated plants (Vanderklein and Reich, 2000; Quentin et al., 2011). According to this hypothesis, the water potential of the remaining leaf is less negative during the day, resulting in lower stomatal resistance, higher transpiration rate, and, therefore, higher photosynthetic rate (Meinzer and Grantz, 1990; Quentin et al., 2011). It is important to note that this conclusion is based mainly on experiments with trees. In our experiments, stomatal conductance and transpiration rate did not differ between the remaining and control leaves for 2 weeks after defoliation (Fig. 2C, D). The significantly higher CO2 and light response curves of the remaining leaves indicated up-regulation of CO2 assimilation efficiency and a higher electron transfer rate (Fig. 3). Moreover, the similar intercellular CO2 concentration (Fig. 2B), despite the significant differences in photosynthetic rate (Fig. 2A), indicates that photosynthetic rate per substomatal CO2 concentration is higher in the remaining leaf. This also indicates that photosynthesis is up-regulated as a result of a more efficient carboxylation rate. Stomatal aperture was somewhat higher in the remaining leaf, but stomatal density was significantly lower (Table 2), resulting in a significantly smaller stomatal aperture area in the remaining leaf (7430 µm2 mm−2) as compared with the control leaf (9900 µm2 mm−2). These results further support the conclusion that up-regulation of photosynthesis is not related to altered water status or higher stomatal conductance.
As indicated, it was logical to assume that increased photosynthesis compensates for the reduced source strength by enhancing carbon assimilation and increasing the export rate from the remaining leaf to the available sinks (von Caemmerer and Farquhar, 1984; Hodgkinson, 1974; Pinkard et al., 2011). This assumption was supported by an observed lower concentration of non-structural carbohydrates in the remaining leaf (Layne and Flore, 1995; Zhou and Quebedeaux, 2003). Those authors suggested that the reduced carbon accumulation in the remaining leaf, despite the higher photosynthetic rate, results from the increased demand imposed by the available sink organs. Reduced concentrations of reducing sugars, sucrose, and starch were also determined in the remaining leaf of tomato plants (Fig. 6). However, surprisingly, expression of the genes and proteins involved in sucrose export from source leaves was significantly down-regulated in the remaining leaf (Fig. 7; Supplementary Fig. S4). The dramatic increase in the size of the remaining leaf (Fig. 5) may provide an explanation for the assumed reduced export rate. Leaf size increased by ~225 cm2 between day 2 and day 8 after defoliation (Fig. 5), with a parallel increase in leaf specific fresh weight from 120 mg cm−2 to ~150 mg cm−2. Based on these values, the weight accumulation rate of this leaf was ~500 mg DW d–1. Assuming an average photosynthetic rate of 25 µmol CO2 m−2 s−1 (Fig. 1), for a leaf that is 350 cm2 (Fig. 5) during 7 h a day, and that the transformation factor from CO2 net assimilation to dry matter accumulation in leaves is ~0.6 (Watanabe, 1976), the calculated dry weight addition by photosynthesis is <600 mg d−1. It is therefore evident that the remaining leaf’s photosynthetic capacity can hardly accommodate its dry weight accumulation during this period, explaining the inhibition of the export rate. The excess non-structural assimilated carbohydrates are probably allocated to support cell expansion and leaf growth. To accommodate the unbalanced source–sink ratio, the first priority for the newly fixed carbon is to increase source size. As a result, the phloem loading machinery is inhibited, and the assimilated sugars remain in the source leaf and are devoted to intercellular functions such as increased metabolism and cell wall biosynthesis.
It is logical to assume that a signal perceived by the remaining leaf initiates the alterations in gene expression, biochemical activity, and morphological changes. The altered phenotype, including chlorophyll accumulation, leaf expansion, and delayed senescence, resembles the response to CK. It has long been hypothesized that CKs are major players in root–shoot communication (Roitsch and Ehneß, 2000), and indeed CK content in xylem sap increases following defoliation (Colbert and Beever, 1981; Rinne and Saarelainen, 1994). As expected, total CK concentration in the remaining leaf was about twice that in the control leaves (Fig. 8A). The positive relationship between CK concentration and photosynthesis is in agreement with earlier findings establishing the influence of CKs on Rubisco expression (Lerbs et al., 1984), light-harvesting Chl a/b-binding protein (Flores and Tobin, 1989), and delayed leaf senescence (Jordi et al., 2000).
Perhaps the most important finding was the significant alteration in the proportion of CK derivatives in the roots. Although total CK concentration in the roots of control and partially defoliated plants was similar, the concentration of tZR was almost double in the last 4 d after defoliation. tZR has been found to be the most abundant CK in the xylem sap of Arabidopsis, constituting ~80% of the total xylem CKs (Osugi et al., 2017). It can therefore be assumed that more tZR is transported to the remaining leaf, via the xylem, following partial defoliation.
The presented results demonstrate that partial defoliation alters the source to sink ratio, resulting in enhanced photosynthetic activity and leaf expansion. We propose that partial defoliation or shading is sensed by the roots, by an as yet unknown signaling mechanism, resulting in alterations in CK biosynthesis and tZR accumulation. Concurrently, tZR is transported to the remaining leaf via the xylem, leading to alterations in gene expression toward an increased photosynthetic rate and delayed leaf senescence. The newly fixed carbohydrates are consumed by the remaining leaf to support its expansion and growth, toward restoring the source–sink equilibrium. Further research is aimed at exploring the early changes in gene expression in the remaining leaf and roots of partially defoliated and shaded plants.
Supplementary data
Supplementary data are available at JXB online.
Fig. S1. Effect of partial defoliation on chlorophyll content in the remaining tomato leaf after defoliation of the other leaves.
Fig. S2. Partial defoliation up-regulated expression of the Cyclin D3 gene in the remaining leaf.
Fig. S3. Effect of partial defoliation on the expansion rate of the remaining leaf.
Fig. S4. Partial defoliation inhibits expression of sucrose transporter proteins in the remaining leaf.
Acknowledgements
This research was partially supported by the Israeli Ministry of Agriculture and Rural Development (Eugene Kandel Knowledge Centers) as part of the Root of the Matter – The Root Zone Knowledge Center for Leveraging Modern Agriculture. This paper is a contribution from the Uri Kinamon Laboratory. NG-I was supported by a scholarship from the Uri Kinamon Foundation. PT was supported by project no. RO0419 funded by the Ministry of Agriculture, Czech Republic. We thank Vladimíra Nožková (Palacky University, Czech Republic) for excellent technical assistance.
References
- Ainsworth EA, Long SP. 2005. What have we learned from 15 years of free-air CO2 enrichment (FACE)? A meta-analytic review of the responses of photosynthesis, canopy properties and plant production to rising CO2. New Phytologist 165, 351–371. [DOI] [PubMed] [Google Scholar]
- Baysdorfer C, Bassham JA. 1985. Photosynthate supply and utilization in alfalfa: a developmental shift from a source to a sink limitation of photosynthesis. Plant Physiology 77, 313–317. [DOI] [PMC free article] [PubMed] [Google Scholar]
- Bieleski RL. 1964. The problem of halting enzyme action when extracting plant tissues. Analytical Biochemistry 9, 431–442. [DOI] [PubMed] [Google Scholar]
- Brooks A. 1986. Effects of phosphorus nutrition on ribulose‐1,5‐biphosphate carboxylase activation, photosynthetic quantum yield and amounts of some Calvin‐cycle metabolites in spinach leaves. Australian Journal of Plant Physiology 13, 221–237. [Google Scholar]
- Chang T-G, Zhu X-G. 2017. Source–sink interaction: a century old concept under the light of modern molecular systems biology. Journal of Experimental Botany 68, 4417–4431. [DOI] [PubMed] [Google Scholar]
- Chater C, Penk K, Movahedi M, et al. 2015. Elevated CO2-induced responses in stomata require ABA and ABA signaling. Current Biology 25, 2709–2716. [DOI] [PMC free article] [PubMed] [Google Scholar]
- Chen LQ, Qu XQ, Hou BH, Sosso D, Osorio S, Fernie AR, Frommer WB. 2012. Sucrose efflux mediated by SWEET proteins as a key step for phloem transport. Science 335, 207–211. [DOI] [PubMed] [Google Scholar]
- Colbert KA, Beever JE. 1981. Effect of disbudding on root cytokinin export and leaf senescence in tomato and tobacco. Journal of Experimental Botany 32, 121–127. [Google Scholar]
- Eyles A, Pinkard EA, Davies NW, Corkrey R, Churchill K, O’Grady AP, Peter Sands P, Mohammed C. 2013. Whole-plant versus leaf-level regulation of photosynthetic responses after partial defoliation in Eucalyptus globulus saplings. Journal of Experimental Botany 64, 1625–1636. [DOI] [PMC free article] [PubMed] [Google Scholar]
- Flores S, Tobin EM. 1989. Cytokinin modulation of LHCP mRNA levels: the involvement of post‐transcriptional regulation. Plant Molecular Biology 11, 409–415. [DOI] [PubMed] [Google Scholar]
- Hodgkinson KC. 1974. Influence of partial defoliation on photosynthesis, photorespiration and transpiration by lucerne leaves of different ages. Australian Journal of Plant Physiology 1, 561–578. [Google Scholar]
- Holubová K, Hensel G, Vojta P, Tarkowski P, Bergougnoux V, Galuszka P. 2018. Modification of barley plant productivity through regulation of cytokinin content by reverse-genetics approaches. Frontiers in Plant Science 9, 1676. [DOI] [PMC free article] [PubMed] [Google Scholar]
- Hradecká V, Novák O, Havlíček L, Strnad M. 2007. Immunoaffinity chromatography of abscisic acid combined with electrospray liquid chromatography-mass spectrometry. Journal of Chromatography B 847, 162–173. [DOI] [PubMed] [Google Scholar]
- Jordi W, Schapendonk A, Davelaar E, Stoopen GM, Pot CS, De Visser R, van Rhijn JA, Gan S, Amasino RM. 2000. Increased cytokinin levels in transgenic PSAG12‐IPT tobacco plants have large direct and indirect effects on leaf senescence, photosynthesis and N partitioning. Plant, Cell & Environment 23, 279–289. [Google Scholar]
- Korner C. 2015. Paradigm shift in plant growth control. Current Opinion in Plant Biology 25, 107–114. [DOI] [PubMed] [Google Scholar]
- Kromdijk K, Glowacka K, Leonelli L, Gabilly ST, Iwai M, Niyogi KK, Long SP. 2016. Improving photosynthesis and crop productivity by accelerating recovery from photoprotection. Science 354, 857–61. [DOI] [PubMed] [Google Scholar]
- Kühn C, Franceschi VR, Schulz A, Lemoine R, Frommer WB. 1997. Macromolecular trafficking indicated by localization and turnover of sucrose transporters in enucleate sieve elements. Science 275, 1298–1300. [DOI] [PubMed] [Google Scholar]
- Layne D, Flore J. 1995. End-product inhibition of photosynthesis in Prunus cerasus L. in response to whole-plant source–sink manipulation. Journal of the American Society for Horticultural Science 120, 583–599. [Google Scholar]
- Lerbs S, Lerbs W, Klyachko NL, Romanko EG, Kulaeva ON, Wollgiehn R, Pathier B. 1984. Gene expression in cytokinin and light‐mediated plastogenesis of Cucurbita cotyledons: ribulose‐1,5‐bisphosphate carboxylase/oxygenase. Planta 162, 289–298. [DOI] [PubMed] [Google Scholar]
- Long SP, Zhu X-G, Naidu SL, Ort DR. 2006. Can improvement in photosynthesis increase crop yields? Plant, Cell & Environment 29, 315–330. [DOI] [PubMed] [Google Scholar]
- Ludwig L, Saeki T, Evans L. 1965. Photosynthesis in artificial communities of cotton plants in relation to leaf area I. Experiments with progressive defoliation of mature plants. Australian Journal of Biological Sciences 18, 1103–1118. [Google Scholar]
- McCormick AJ, Cramer MD, Watt DA. 2006. Sink strength regulates photosynthesis in sugarcane. New Phytologist 171, 759–770. [DOI] [PubMed] [Google Scholar]
- Meinzer FC, Grantz DA. 1990. Stomatal and hydraulic conductance in growing sugarcane: stomatal adjustment to water transport capacity. Plant, Cell & Environment 13, 383–388. [Google Scholar]
- Mickelbart MV, Hasegawa PM, Bailey-Serres J. 2015. Genetic mechanisms of abiotic stress tolerance that translate to crop yield stability. Nature Reviews. Genetics 16, 237–251. [DOI] [PubMed] [Google Scholar]
- Monteith JL. 1977. Climate and efficiency of crop production. Philosophical Transactions of the Royal Society B: Biological Sciences 281, 277–294. [Google Scholar]
- Moran R. 1982. Formulae for determination of chlorophyllous pigments extracted with N,N-dimethylformamide. Plant Physiology 69, 1376–1381. [DOI] [PMC free article] [PubMed] [Google Scholar]
- Olesinski AA, Almon E, Navot N, Perl A, Galun E, Lucas WJ, Wolf S. 1996. Tissue-specific expression of the tobacco mosaic virus movement protein in transgenic potato plants alters plasmodesmal function and carbohydrate partitioning. Plant Physiology 111, 541–550. [DOI] [PMC free article] [PubMed] [Google Scholar]
- Ort DR, Merchant SS, Alric J, et al. 2015. Redesigning photosynthesis to sustainably meet global food and bioenergy demand. Proceedings of the National Academy of Sciences, USA 112, 8529–8536. [DOI] [PMC free article] [PubMed] [Google Scholar]
- Osugi A, Kojima M, Takebayashi Y, Ueda N, Kiba T, Sakakibara H. 2017. Systemic transport of trans-zeatin and its precursor have differing roles in Arabidopsis shoots. Nature Plants 3, 17112. [DOI] [PubMed] [Google Scholar]
- Ozaki K, Saito H, Yamamuro K. 2004. Compensatory photosynthesis as a response to partial debudding in Ezo Spruce, Picea jezoensis seedlings. Ecological Research 19, 225–231. [Google Scholar]
- Paul MJ, Foyer CH. 2001. Sink regulation of photosynthesis. Journal of Experimental Botany 52, 1383–1400. [DOI] [PubMed] [Google Scholar]
- Peet MM, Kramer PJ. 1980. Effects of decreasing source/sink ratio in soybeans on photosynthesis, photorespiration, transpiration and yield. Plant, Cell & Environment 3, 201–206. [Google Scholar]
- Pinkard EA, Eyles A, O’Grady AP. 2011. Are gas exchange responses to resource limitation and defoliation linked to source:sink relationships? Plant, Cell & Environment 34, 1652–1665. [DOI] [PubMed] [Google Scholar]
- Poorter H, Navas M-L. 2003. Plant growth and competition at elevated CO2: on winners, losers and functional groups. New Phytologist 157, 175–198. [DOI] [PubMed] [Google Scholar]
- Quentin AG, O’Grady AP, Beadle CL, Worledge D, Pinkard EA. 2011. Responses of transpiration and canopy conductance to partial defoliation of Eucalyptus globulus trees. Agricultural and Forest Meteorology 151, 356–364. [Google Scholar]
- Raines CA. 2011. Increasing photosynthetic carbon assimilation in C3 plants to improve crop yield: current and future strategies. Plant Physiology 155, 36–42. [DOI] [PMC free article] [PubMed] [Google Scholar]
- Rao M, Terry N. 1989. Leaf phosphate status, photosynthesis and carbon partitioning in sugar beet. I. Changes in growth, gas exchange, Calvin cycle enzymes. Plant Physiology 90, 814–819. [DOI] [PMC free article] [PubMed] [Google Scholar]
- Roitsch T, Ehneß R. 2000. Regulation of source/sink relations by cytokinins. Plant Growth Regulation 32, 359–367. [Google Scholar]
- Rinne P, Saarelainen A. 1994. Root produced DHZR-, ZR- and IPA-like cytokinins in xylem sap in relation to coppice shoot initiation and growth in cloned trees of Betula pubescens. Tree Physiology 14, 1149–1161. [DOI] [PubMed] [Google Scholar]
- Sonnewald U, Fernie AR. 2018. Next-generation strategies for understanding and influencing source–sink relations in crop plants. Current Opinion in Plant Biology 43, 63–70. [DOI] [PubMed] [Google Scholar]
- Tilman D, Balzer C, Hill J, Befort BL. 2011. Global food demand and the sustainable intensification of agriculture. Proceedings of the National Academy of Sciences, USA 108, 20260–20264. [DOI] [PMC free article] [PubMed] [Google Scholar]
- Turecková V, Novák O, Strnad M. 2009. Profiling ABA metabolites in Nicotiana tabacum L. leaves by ultra-performance liquid chromatography-electrospray tandem mass spectrometry. Talanta 80, 390–399. [DOI] [PubMed] [Google Scholar]
- Turgeon R, Wolf S. 2009. Phloem transport: cellular pathways and molecular trafficking. Annual Review of Plant Biology 60, 207–221. [DOI] [PubMed] [Google Scholar]
- Turnbull TL, Adams MA, Warren CR. 2007. Increased photosynthesis following partial defoliation of field-grown Eucalyptus globulus seedlings is not caused by increased leaf nitrogen. Tree Physiology 27, 1481–1492. [DOI] [PubMed] [Google Scholar]
- Vanderklein DW, Reich PB. 2000. European larch and eastern white pine respond similarly during three years of partial defoliation. Tree Physiology 20, 283–287. [DOI] [PubMed] [Google Scholar]
- von Caemmerer S, Farquhar GD. 1984. Effects of partial defoliation, changes of irradiance during growth, short-term water stress and growth at enhanced p(CO2) on the photosynthetic capacity of leaves of Phaseolus vulgaris L. Planta 160, 320–329. [DOI] [PubMed] [Google Scholar]
- Wareing PF, Khalifa MM, Treharne KJ. 1968. Rate-limiting processes in photosynthesis at saturating light intensities. Nature 220, 453–457. [DOI] [PubMed] [Google Scholar]
- Watanabe I. 1976. Transformation factor from CO2 net assimilation to dry matter in crop plants. Japan Agricultural Research Quarterly 10, 114–118. [Google Scholar]
- Weise A, Barker L, Kühn C, Lalonde S, Buschmann H, Frommer WB, Ward JM. 2000. A new subfamily of sucrose transporters, SUT4, with low affinity/high capacity localized in enucleate sieve elements of plants. The Plant Cell 12, 1345–1355. [DOI] [PMC free article] [PubMed] [Google Scholar]
- Zhou R, Quebedeaux B. 2003. Changes in photosynthesis and carbohydrate metabolism in mature apple leaves in response to whole plant source–sink manipulation. Journal of the American Society for Horticultural Science 128, 113–119. [Google Scholar]
Associated Data
This section collects any data citations, data availability statements, or supplementary materials included in this article.


