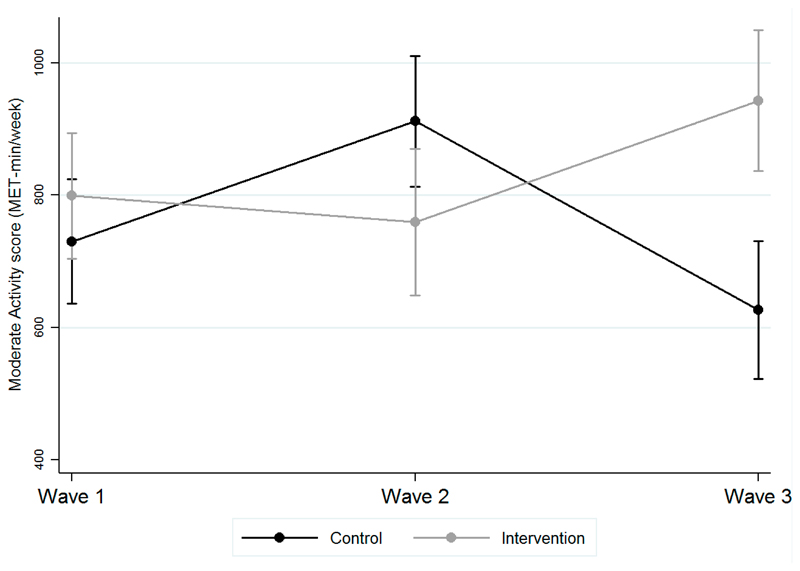
Figure 5.
Predicted means of moderate intensity physical activity score comparing intervention and control groups over time. Note: Y-axis shows moderate intensity physical activity score in MET-min/week, and the x-axis the wave of the survey. An increase in the MET score denotes higher intensity physical activity. Controlled for different individual-level characteristics.

