Abstract
Background
In the current literature, the association between sleep and different lipids is inconsistent. We aimed to assess the association of sleep with HDL cholesterol, triglyceride, and LDL cholesterol in the National Health and Nutrition Examination Survey (NHANES), 2013/2014.
Methods
We included 2705 participants from NHANES, 2013/2014. Cross-sectional information was measured on sleep duration and HDL cholesterol/triglyceride/LDL cholesterol. Generalized additive models (GAM) were constructed to assess the smooth relationship between the HDL cholesterol/triglyceride/LDL cholesterol, and the sleep duration. Models were adjusted for age, sex, race, marital status, household size, sitting time and physical activity. Effective degree of freedom (EDF) value in GAM indicated the amount of non-linearity of the smooth. EDF = 1 was indicative of a linear pattern of association. A value greater than 1 denoted a more complex association between outcome and sleep duration.
Results
The highest mean HDL cholesterol level was observed in participants sleeping 8 h/day. There was a significant non-linear association between sleep duration and HDL cholesterol in unadjusted GAM (EDF = 2.58, P = 0.002) and adjusted GAM (EDF = 1.85, P = 0.003). The lowest mean triglyceride level was observed in people sleeping 6 h/day. There was a significant non-linear association between sleep duration and triglyceride in unadjusted GAM (EDF = 3.05, P = 0.02) and adjusted GAM (EDF = 1.78, P = 0.02). There was no significant non-linear association between sleep duration and LDL cholesterol in either unadjusted GAM (EDF = 1.01, P = 0.2) or adjusted GAM (EDF = 1.01, P = 0.8).
Conclusion
Short sleep duration was associated with low HDL cholesterol/high triglyceride. Further longitudinal studies are warranted to shed extra light on this relationship.
Keywords: Sleep, Generalized additive model, Triglyceride, High density lipoprotein, Low density lipoprotein
Introduction
Sleep insufficiency, defined as diminished sleep quantity and/or quality, is a global issue. Sleep guidelines for adults recommend 7–9 h’ sleep daily [15]. Sleeping less than 7 h might be harmful for health, well-being, and performance [22]. Some studies found significant associations between short sleep duration and HDL cholesterol, triglyceride and/or LDL cholesterol [1, 2, 9–12, 17]. But, the associations were not consistent across all three lipid groups. In addition, in some studies, the association became insignificant after further adjustment of statistical models [16, 20]. In addition to short sleep, long sleep duration could also be detrimental for health [22]. Some studies showed significant associations between long sleep duration and HDL cholesterol, triglyceride and/or LDL cholesterol [9, 12, 20, 21, 24]. But, there were no universal agreements on the significance of associations across all three lipid groups. Moreover, the long duration of sleep was defined differently, more than 7, 8 or 9 h, in various studies. These inconsistencies warranted further studies with application of better analytical methods to picture the non-linear associations of sleep duration and lipid profiles.
Methods
The current investigation was carried out to assess the association of sleep and HDL cholesterol, triglyceride and LDL cholesterol in National Health and Nutrition Examination Survey (NHANES) 2013/2014.
Population
NHANES is one of the principal programs of the National Center for Health Statistics which is part of the Centers for Disease Control and Prevention (CDC). NHANES program began in the early 1960s and was designed to evaluate people’s health and nutritional status in the United States. It focused on different population groups and health topics. NHANES has been used to determine the prevalence of risk factors and major diseases, to assess the association of nutritional status with disease prevention and health promotion, to develop national biological standards, and to design new health programs and services. NHANES surveyed a nationwide representative sample of about 5000 people each year. The samples were located in counties across the country, 15 of which are visited each year. The conducted surveys were unique since they combined interviews and physical examinations. The examination section involves clinical, physiological and laboratory evaluations administered by trained medical personnel. The dataset in the current study contained 10,175 interviews and physical examinations. It included demographic, socioeconomic, dietary, and health-related information such as smoking history, alcohol consumption, physical inactivity and lipid profiles. Sleep information was collected in 6464 people of which, lipid profiles were recorded in 2711 people.
Data Analysis
The data were examined and six outliers that were severely out of range, were deleted. The descriptive characteristics for each variable were analyzed. Lipid profiles were treated as both continuous and categorical. They were categorized as follows: serum HDL cholesterol <40 mg/dl vs. ≥40 mg/dl in men, serum triglyceride ≥150 mg/dl vs. <150 mg/dl, and LDL cholesterol ≥100 mg/dl. Sleep duration was also treated as both continuous and categorical in five categories of ≤5, 6, 7, 8 and ≥ 9 h. Mean lipid profiles between the sleep categories were compared by ANOVA. Bivariate association of lipid profiles with every variable was assessed by linear regression analysis.
Given the U/J-shaped relationship of sleep with cardio-metabolic outcomes in literature and the inconsistent associations between sleep duration and different groups of lipids mentioned above, a penalized smoothing spline [19] was applied. Non-linear relationship of sleep with HDL cholesterol, triglyceride, and LDL cholesterol was assessed through generalized additive models (GAM). GAM is an extension of generalized linear model allowing for nonlinear associations between the predictor variables and the outcomes. Model assumptions where assessed by examining the residuals for normality, residual symmetry, and homoscedasticity [23]. In the GAM, HDL cholesterol, triglyceride and LDL cholesterol were treated as outcome variables and their unadjusted/adjusted association with sleep duration was modeled as a smooth function. In the adjusted GAM models, age, sex, race, marital status, household size, sitting time and physical activity were included. The reported effective degree of freedom (EDF) value in GAM denotes the amount of non-linearity of the smooth. EDF = 1 is indicative of a linear pattern of association. A value greater than 1 represents a more complex association between lipid profile and sleep duration. The plots of estimated smooth functions with 95% confidence bands were created for both unadjusted and adjusted GAM. A p value less than 0.05 was considered significant. All statistical analyses were conducted using R-3.4.3 [23].
Results
The final sample size included 2705 people, with ages 18–80 years. Their mean (SD) age was 47.8 (18.5) years and 52% were females. About 50% of participants were married, 51% had an income more than $45,000/year and 52% had college education or above. 68.5% of people never felt down, helpless or hopeless. The mean (SD) duration of sleep was 6.94 (1.40). Overall, 263, 1120 and 1633 subjects had missing history of depression, alcohol drinking and smoking, respectively. Characteristics of study subjects according to lipid profiles are presented in Table 1.
Table 1.
Characteristics of participants in the NHANES 203/2014 according to lipid profiles. Significant p values are bolded
| Participants’ Characteristics | Low HDL cholesterol | High Triglyceride | High LDL cholesterol | |||||||
|---|---|---|---|---|---|---|---|---|---|---|
| No n = 1952 | Yes n = 753 | P | No n = 1238 | Yes n = 1450 | P | No n = 1125 | Yes n = 1535 | P | ||
| Age, Years, Mean (SD) | 48.5 (18.6) | 46.5 (17.6) | 0.02 | 47.1 (18.7) | 50.6 (17.1) | 0.0001 | 46.3 (20.5) | 49.3 (16.6) | 0.0001 | |
| Sex, n (%) | Male | 980 (36.2%) | 319 (11.8%) | 0.0001 | 923 (34.3%) | 368 (13.7%) | 0.0001 | 543 (20.4%) | 722 (27.1%) | 0.3 |
| Female | 971 (35.9%) | 434 (16.1%) | 1086 (40.4%) | 313 (11.6%) | 582 (21.9%) | 813 (30.6%) | ||||
| Ethnicity, n (%) | Hispanic | 412 (15.2%) | 186 (6.9%) | 0.0001 | 421 (15.7%) | 176 (6.5%) | 0.0001 | 216 (8.1%) | 371 (13.9%) | 0.01 |
| White | 833 (30.8%) | 361 (13.4%) | 841 (31.3%) | 347 (12.9%) | 505 (19.0%) | 665 (25.0%) | ||||
| Black | 401 (14.8%) | 121 (4.5%) | 450 (16.7%) | 65 (2.4%) | 236 (8.9%) | 282 (10.6%) | ||||
| Asian | 257 (9.5%) | 67 (2.5%) | 250 (9.3%) | 74 (2.8%) | 134 (5.0%) | 186 (7.0%) | ||||
| Multiracial | 48 (1.8%) | 18 (0.7%) | 47 (1.7%) | 19 (0.7%) | 34 (1.3%) | 31 (1.2%) | ||||
| Marital Status, n (%) | Married or Living with partner | 1115 (43.7%) | 442 (17.3%) | 0.4 | 1145 (45.1%) | 404 (15.9%) | 0.002 | 582 (23.2%) | 949 (37.8%) | 0.0001 |
| Widowed | 149 (5.8%) | 45 (1.8%) | 142 (5.6%) | 52 (2.0%) | 90 (3.6%) | 104 (4.1%) | ||||
| Divorced or Separated | 243 (9.5%) | 102 (4.0%) | 231 (9.1%) | 110 (4.3%) | 128 (5.1%) | 211 (8.4%) | ||||
| Never married | 334 (13.1%) | 122 (4.8%) | 363 (14.3%) | 93 (3.7%) | 223 (8.9%) | 222 (8.8%) | ||||
| Education, n (%) | <9th grade | 141 (5.2%) | 66 (2.4%) | 0.0001 | 145 (5.4%) | 59 (2.2%) | 0.0001 | 83 (3.1%) | 120 (4.5%) | 0.0001 |
| 9-11th grade | 242 (8.9%) | 126 (4.7%) | 247 (9.2%) | 119 (4.4%) | 142 (5.3%) | 213 (8.0%) | ||||
| High school | 391 (14.5%) | 151 (5.6%) | 410 (15.2%) | 131 (4.9%) | 205 (7.7%) | 330 (12.4%) | ||||
| Some college | 545 (20.2%) | 232 (8.6%) | 560 (20.8%) | 215 (8.0%) | 318 (12.0%) | 447 (16.8%) | ||||
| ≥College graduate | 518 (19.2%) | 136 (5.0%) | 516 (19.2%) | 134 (5.0%) | 271 (10.2%) | 376 (14.1%) | ||||
| Current Smoker, n (%) | Every Day | 268 (9.9%) | 174 (6.4%) | 0.0001 | 296 (11.0%) | 142 (5.3%) | 0.0001 | 176 (6.6%) | 253 (9.5%) | 0.9 |
| Some Days | 69 (2.6%) | 24 (0.9%) | 64 (2.4%) | 29 (1.1%) | 40 (1.5%) | 50 (1.9%) | ||||
| Not at All | 472 (17.5%) | 139 (5.1%) | 440 (16.4%) | 168 (6.2%) | 258 (9.7%) | 343 (12.9%) | ||||
| Depression, n (%) | Not at All | 1376 (55.6%) | 497 (20.1%) | 0.0001 | 1438 (58.4%) | 426 (17.3%) | 0.0001 | (31.7%) | (44.0%) | 0.4 |
| Several Days | 295 (11.9%) | 125 (5.0%) | 285 (11.6%) | 132 (5.4%) | (6.9%) | (10.0%) | ||||
| >Half the Days | 67 (2.7%) | 27 (1.1%) | 70 (2.8%) | 23 (0.9%) | (1.8%) | (1.9%) | ||||
| Nearly Every Day | 47 (1.9%) | 41 (1.7%) | 44 (1.8%) | 43 (1.7%) | (1.4%) | (2.3%) | ||||
| Household Size, Mean (SD) | 3.28 (1.7) | 3.44 (1.8) | 0.01 | 3.36 (1.7) | 3.24 (1.7) | 0.2 | 3.33 (1.7) | 3.31 (1.7) | 0.8 | |
| Number of Alcohol Drinks/Day, Mean (SD) | 2.72 (2.6) | 2.85 (2.7) | 0.5 | 2.67 (2.5) | 3 (2.9) | 0.07 | 2.79 (2.7) | 2.69 (2.6) | 0.4 | |
| Sitting, Minutes/Day, Mean (SD) | 440 (547) | 463 (637) | 0.5 | 446 (619) | 444 (415) | 0.3 | 428 (560) | 447 (657) | 0.2 | |
| Sleep Duration, Hours, Mean (SD) | 7 (1.4) | 6.8 (1.5) | 0.009 | 6.9 (1.4) | 6.9 (1.5) | 0.006 | 6.95 (1.4) | 6.94 (1.4) | 0.9 | |
| Diastolic Blood Pressure, mmHg, Mean (SD) | 68.2 (12.6) | 69.6 (12.8) | 0.4 | 67.9 (12.3) | 70.8 (13.2) | 0.3 | 66.4 (13.2) | 70.1 (11.9) | 0.0001 | |
| Systolic Blood Pressure, mmHg, Mean (SD) | 121.9 (18.3) | 121.6 (16.5) | 0.004 | 120.7 (17.9) | 124.9 (17.2) | 0.4 | 120.1 (17.7) | 122.9 (17.6) | 0.0001 | |
| Fasting Blood Glucose, mg/dl, Mean (SD) | 104.4 (31) | 112.6 (40) | 0.0001 | 102.8 (27.5) | 118 (45.7) | 0.0001 | 106.2 (34.2) | 106 (30.6) | 0.9 | |
| High Density Lipoprotein, mg/dl, Mean (SD) | 59.8 (14.6) | 38.5 (6.6) | 0.0001 | 57.2 (16) | 44 (11.7) | 0.0001 | 54.8 (16.9) | 53.8 (15.1) | 0.003 | |
| Triglyceride, mg/dl, Mean (SD) | 103.8 (62.1) | 179.5 (134.4) | 0.0001 | 85 (30.3) | 242.4 (118.9) | 0.0001 | 107.2 (32.8) | 118.3 (40) | 0.0001 | |
| Low Density Lipoprotein, mg/dl, Mean (SD) | 110.2 (35) | 109.2 (35) | 0.8 | 107.7 (74.6) | 124.9 (67) | 0.1 | 78.7 (15.2) | 132.8 (26.9) | 0.0001 | |
| Waist Circumference, cm, Mean (SD) | 95.5 (16) | 105.4 (17.1) | 0.08 | 96 (16.7) | 105.2 (15.5) | 0.02 | 96.1 (17.2) | 99.7 (16.5) | 0.0001 | |
Mean (SD) HDL cholesterol was 53.9 (16.0) mg/dl and its minimum/maximum levels were 10/173 mg/dl. About 28% had low HDL (<50 mg/dl in males and < 40 in females). Subjects with low HDL cholesterol were significantly different than those with normal/high HDL cholesterol in terms of age, sex, ethnicity, education, household size, smoking, depression, systolic blood pressure, fasting blood glucose and sleep duration (Table 1). Mean (SD) triglyceride level was 124.9 (95.0) mg/dl and its minimum/maximum levels were 20/1000 mg/dl. About 54% had high triglyceride (>150 mg/dl) level. Subjects with high triglyceride level were significantly different than those with normal triglyceride level in terms of age, sex, ethnicity, education, marital status, smoking, depression, waist circumference, fasting blood glucose and sleep duration (Table 1). Mean (SD) LDL cholesterol was 109.9 (35.0) mg/dl and its minimum/maximum levels were 23/375 mg/dl. About 58% had high LDL cholesterol (>100 mg/dl). Subjects with high LDL cholesterol were significantly different from those with normal LDL level in terms of age, ethnicity, education, marital status, waist circumference, systolic and diastolic blood pressures (Table 1).
Mean HDL cholesterol, triglyceride and LDL cholesterol across sleep hours are plotted in Fig. 1. The highest mean HDL cholesterol among all participants was observed in people sleeping 8 h per day (Fig. 1). The lowest mean triglyceride level was found in people sleeping 6 h per day (Fig. 1). The findings of ANOVA are presented in Table 2. Mean HDL cholesterol was significantly different among the five sleep categories. Similarly, mean triglyceride was significantly different among the five sleep categories but there was no significant difference in mean LDL cholesterol among various sleep categories (Table 2). Smooth plots of mean HDL cholesterol, mean triglyceride and mean LDL cholesterol according to sleep durations are presented in Figs. 2, 3, 4, 5 and 6.
Fig. 1.
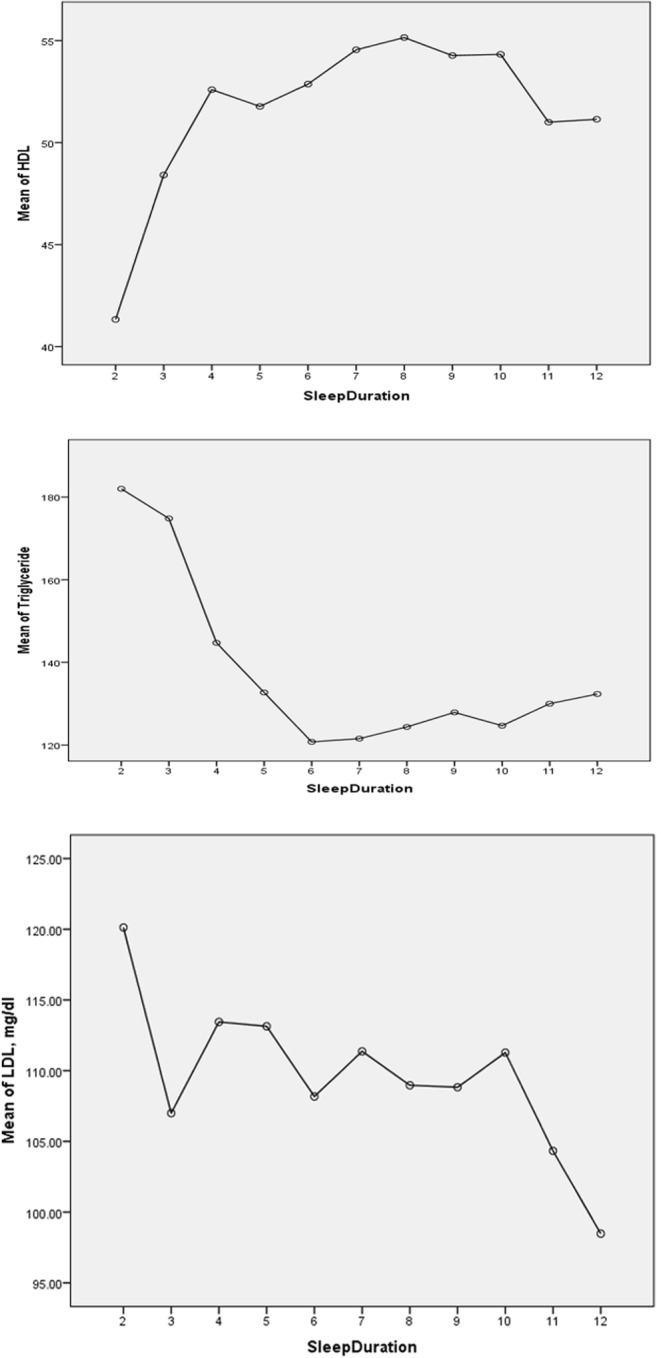
Plots of sleep duration vs. mean lipid levels
Table 2.
Comparison of the mean lipid profiles among five principal sleep categories analyzed by ANOVA. Significant p values are bolded
| HDL cholesterol | Triglyceride | LDL cholesterol | ||||||||
|---|---|---|---|---|---|---|---|---|---|---|
| Mean | SD | P | Mean | SD | P | Mean | SD | P | ||
| Sleep Duration | ≤5 h, n = 356 | 51.57 | 14.95 | 0.003 | 139.09 | 118.96 | 0.04 | 113.11 | 40.11 | 0.2 |
| 6 h, n = 650 | 52.87 | 15.77 | 120.75 | 99.26 | 108.17 | 33.62 | ||||
| 7 h, n = 738 | 54.55 | 16.67 | 121.54 | 89.06 | 111.37 | 34.55 | ||||
| 8 h, n = 729 | 55.15 | 16.40 | 124.38 | 87.87 | 108.96 | 33.99 | ||||
| ≥9 h, n = 232 | 53.96 | 14.70 | 127.36 | 72.22 | 108.55 | 35.14 | ||||
Fig. 2.
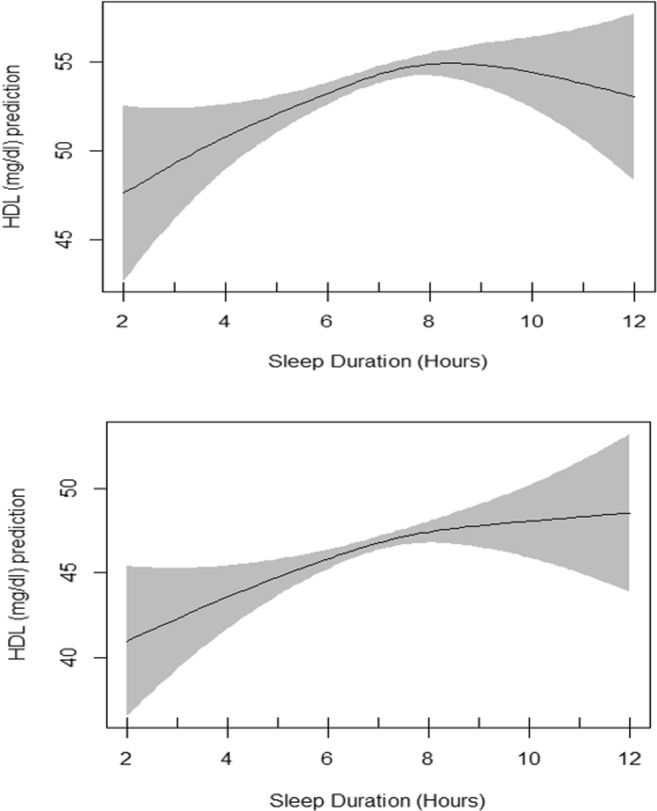
Plots of estimated smoothing spline function of sleep duration with 95% confidence band for generalized additive model when the response variable was HDL cholesterol. The upper plot shows the crude smooth function of sleep duration (EDF = 2.58, p value = 0.002) whereas the lower plot represents the adjusted smooth function of sleep duration (EDF = 1.85, p value = 0.005)
Fig. 3.
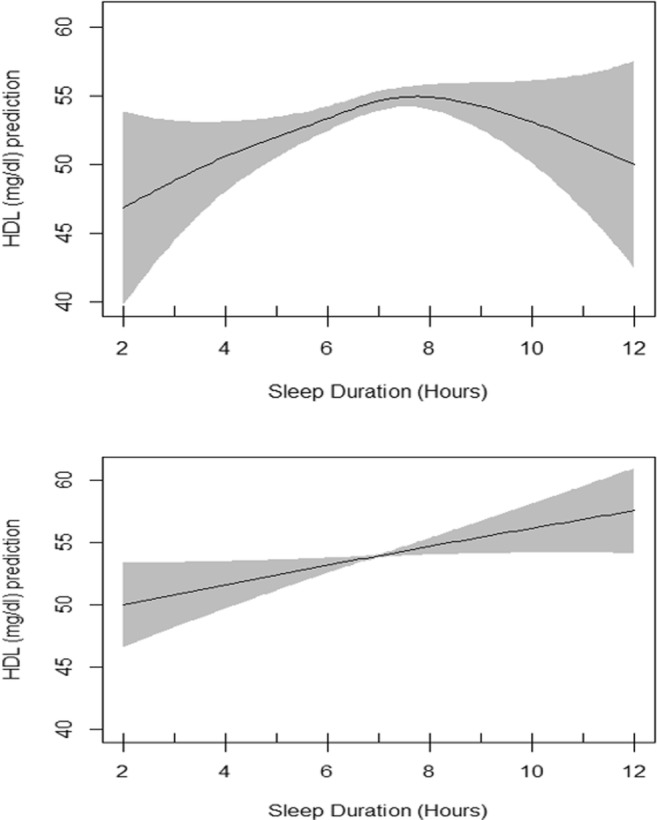
Interaction of Sex and sleep duration in unadjusted GAM. EDF = 2.75 in female model (upper plot), EDF = 1.1 in male model (lower plot), p value = 0.02 for both models)
Fig. 4.
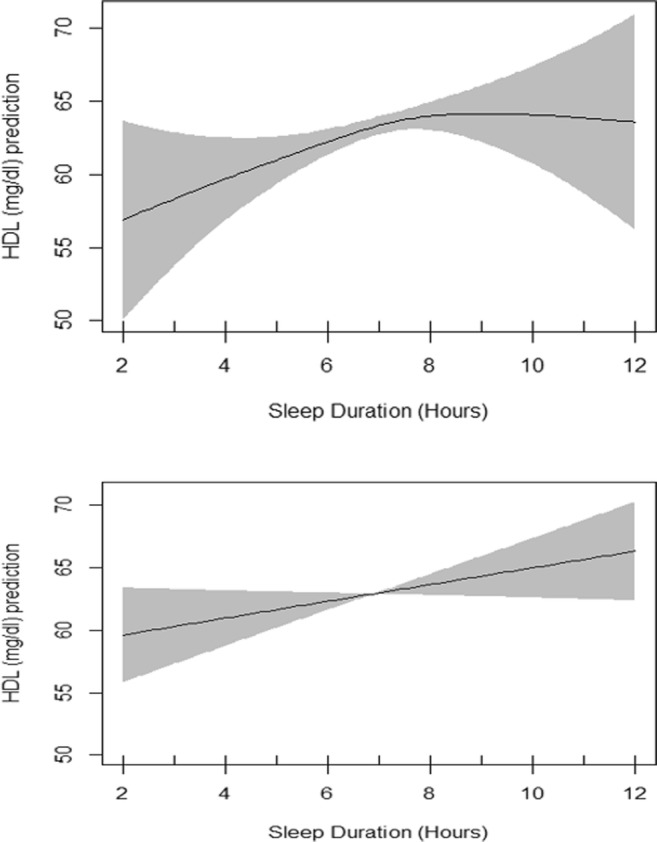
Interaction of Sex and sleep duration in adjusted GAM. EDF = 1.89 in female model (upper plot), p value = 0.06; EDF = 1.01 in male model (lower plot), p value = 0.08
Fig. 5.
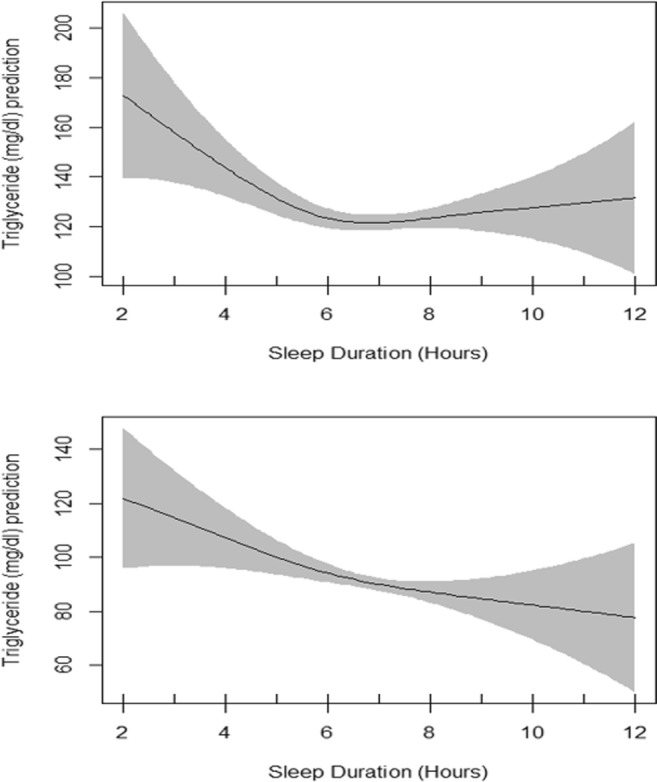
Plots of estimated smoothing spline function of sleep duration with 95% confidence band for generalized additive model when the response variable was Triglyceride. The upper plot shows the crude smooth function of sleep duration (EDF = 3.05, p value = 0.02) whereas the lower plot represents the adjusted smooth function of sleep duration (EDF = 1.78, p value = 0.02)
Fig. 6.
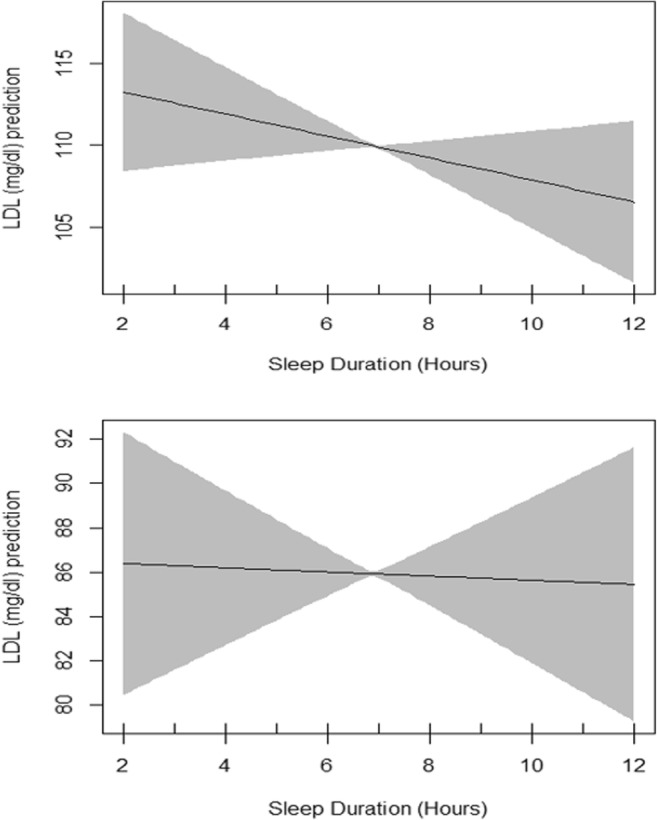
Plots of estimated smoothing spline function of sleep duration with 95% confidence band for generalized additive model when the response variable was LDL. The upper plot shows the crude smooth function of sleep duration (EDF = 1.01, p value = 0.2) whereas the lower plot represents the adjusted smooth function of sleep duration (EDF = 1.01, p value = 0.8)
Table 3 presents the summary of univariate association of HDL cholesterol with other independent variables evaluated by linear regression models. All variables showed significant association with HDL cholesterol except the amount of sitting. Table 3 also presents generalized additive model which includes the smoothing output for sleep duration in association with HDL cholesterol adjusted for all shown independent variables. The basic residual plots checked for the final model indicated good compliance with model assumptions. Plots of estimated smooth association of sleep duration with 95% confidence band when the response variable was HDL cholesterol is shown in Fig. 2. EDF for sleep duration function in unadjusted GAM was 2.58 (P = 0.002) which reduced to 1.85 after adjustments (P = 0.005) indicating a significant non-linear fit between sleep duration and HDL cholesterol (Fig. 2). Evaluation of interaction of sex and sleep duration by using GAM showed two different smoothing patterns in males and females in unadjusted GAM model but they were both significant. In adjusted GAM model, the patterns were also different, but they lost their significance (Figs. 3 and 4).
Table 3.
Univariate (crude) and adjusted associations of HDL cholesterol and independent variables measured by linear regression models and generalized additive model, respectively
| Outcome: HDL cholesterol | ||||
|---|---|---|---|---|
| Crude Association | Adjusted Association (GAM) | |||
| Β | P value | Β | P value | |
| Age | 0.08 | 0.0001 | 0.11 | 0.0001 |
| Sex | ||||
| Male | Reference Group | Reference Group | ||
| Female | 9.91 | 0.0001 | 11.48 | 0.0001 |
| Race | ||||
| Hispanic | Reference Group | Reference Group | ||
| White | 1.27 | 0.1 | 1.04 | 0.2 |
| Black | 4.57 | 0.0001 | 5.11 | 0.0001 |
| Asian | 3.05 | 0.005 | 2.66 | 0.03 |
| Multiracial | 0.99 | 0.6 | 1.74 | 0.5 |
| Marital Status | ||||
| Married | Reference Group | Reference Group | ||
| Widowed | 4.72 | 0.0001 | 0.54 | 0.7 |
| Divorced or | 1.64 | 0.09 | −0.58 | 0.6 |
| Separated | ||||
| Never married | 1.46 | 0.09 | 2.15 | 0.03 |
| Household Size | −0.97 | 0.0001 | −0.77 | 0.0009 |
| Sitting | −1.92 | 0.09 | −2.48 | 0.05 |
| Physical Activity | −1.48 | 0.03 | 1.73 | 0.02 |
| Sleep | 0.70 | 0.001 | Smooth Curve | 0.005 |
Table 4 presents the summary of univariate association of triglyceride with other independent variables evaluated by linear regression models. Age, sex, race and marital status showed significant association with triglyceride. Table 4 also presents generalized additive model which include the smoothing output for sleep duration in association with triglyceride adjusted for all shown independent variables. The basic residual plots checked for the final model indicated good compliance with model assumptions. Plots of the estimated smooth association of sleep duration with 95% confidence band when the response variable was triglyceride is shown in Fig. 5. EDF for sleep duration function in unadjusted GAM was 3.05 (P = 0.02) which reduced to 1.78 after adjustments (P = 0.02) indicating a significant non-linear fit between sleep duration and triglyceride (Fig. 5). Evaluation of interaction of sex and sleep duration by using GAM showed significant smooth association in males and non-significant smooth association in females. The same interaction was observed in adjusted GAM model.
Table 4.
Univariate (crude) and adjusted associations of triglyceride and independent variables measured by linear regression models and generalized additive model, respectively
| Outcome: Triglyceride | ||||
|---|---|---|---|---|
| Crude Association | Adjusted Association (GAM) | |||
| Β | P value | β | P value | |
| Age | 0.44 | 0.0001 | 0.30 | 0.049 |
| Sex | ||||
| Male | Reference Group | Reference Group | ||
| Female | −19.36 | 0.0001 | −24.14 | 0.0001 |
| Race | ||||
| Hispanic | Reference Group | Reference Group | ||
| White | −1.50 | 0.75 | −4.08 | 0.45 |
| Black | −41.66 | 0.0001 | −43.18 | 0.0001 |
| Asian | −12.61 | 0.05 | −15.09 | 0.04 |
| Multiracial | −13.46 | 0.30 | −13.96 | 0.30 |
| Marital Status | ||||
| Married | Reference Group | Reference Group | ||
| Widowed | −6.13 | 0.40 | −4.16 | 0.65 |
| Divorced or | 10.93 | 0.05 | 16.50 | 0.01 |
| Separated | ||||
| Never married | −16.06 | 0.002 | −4 | 0.50 |
| Household Size | −0.20 | 0.85 | 1.67 | 0.24 |
| Sitting | 12 | 0.08 | 17.32 | 0.03 |
| Physical Activity | −4.97 | 0.20 | −4.74 | 0.30 |
| Sleep | −2.16 | 0.09 | Smooth Curve | 0.02 |
Table 5 presents the summary of univariate association of LDL with other independent variables evaluated by linear regression models. Age, race and marital status showed significant association with LDL. Table 5 also presents generalized additive model which include the smoothing output for sleep duration in association with LDL adjusted for all shown independent variables. The basic residual plots checked for the final model indicated good compliance with model assumptions. Plots of estimated smoothing spline function of sleep duration with 95% confidence band for generalized additive model when the response variable was LDL cholesterol is shown in Fig. 6. EDF for sleep duration function in unadjusted GAM was 1.01 (P = 0.2) and remained the same after adjustments (Fig. 6) indicating a non-significant smooth association between sleep duration and LDL. Interaction of sex and sleep duration was significant neither in unadjusted GAM model nor in adjusted one.
Table 5.
Univariate (crude) and adjusted associations of LDL and independent variables measured by linear regression models and generalized additive model, respectively
| Outcome: LDL | ||||
|---|---|---|---|---|
| Crude Association | Adjusted Association (GAM) | |||
| β | P value | Β | P value | |
| Age | 0.17 | 0.0001 | 0.21 | 0.0005 |
| Sex | ||||
| Male | Reference Group | Reference Group | ||
| Female | 0.56 | 0.7 | 1.03 | 0.50 |
| Race | ||||
| Hispanic | Reference Group | Reference Group | ||
| White | −4.05 | 0.02 | −4.14 | 0.05 |
| Black | −4.83 | 0.02 | −2.40 | 0.35 |
| Asian | −2.96 | 0.20 | −4.40 | 0.10 |
| Multiracial | −9.42 | 0.04 | −7.10 | 0.20 |
| Marital Status | ||||
| Married | Reference Group | Reference Group | ||
| Widowed | −7.38 | 0.005 | −8.47 | 0.03 |
| Divorced or | 0.62 | 0.8 | 0.64 | 0.80 |
| Separated | ||||
| Never married | −9.08 | 0.0001 | −7.47 | 0.002 |
| Household Size | 0.06 | 0.90 | 0.03 | 0.95 |
| Sitting | −0.07 | 0.97 | 3.57 | 0.25 |
| Physical Activity | 1.90 | 0.20 | 5.12 | 0.002 |
| Sleep | −0.67 | 0.15 | Smooth Curve | 0.8 |
Discussion
Very few studies have evaluated the association of sleep duration and other outcomes in NHANES. Our study evaluated the cross-sectional association of sleep and HDL cholesterol/triglyceride/LDL cholesterol through GAM. In HDL cholesterol/triglyceride models, EDF was greater than 2 indicating the smooth (curved) association of sleep and HDL cholesterol/triglyceride. This means assuming linearity for the association of sleep duration with HDL cholesterol/triglyceride is not appropriate. Both models roughly indicated that short sleep was significantly associated non-linearly with low HDL cholesterol/high triglyceride in NHANES 2013/2014. The highest HDL was observed in people sleeping 8 h per day and the lowest triglyceride was observed in people sleeping 6 h per day. It is now possible through the final models to predict the HDL cholesterol/triglyceride in NHANES population having age, sex, race, marital status, household size, sitting and physical activity information and sleep duration. Sleep duration showed no association with LDL cholesterol in GAM.
The strength of the current study was the application of GAM in finding the nonlinear association of sleep and HDL cholesterol/triglyceride. Studies conducted on assessment of sleep and lipid profiles so far, have mainly employed sleep categories to estimate the association of sleep duration and HDL cholesterol/triglyceride/LDL cholesterol through linear/logistic regression which might bear some residual confounding [7]. When there is a non-linear association between the outcome, such as HDL cholesterol/triglyceride, and the independent variable, such as sleep duration, application of linear modelling to portray their relationship will lead to residual confounding and possible imprecise picture of the association [5, 6, 18]. Similarly, employing dummy variables on categories for adjusting the risk might lead to residual confounding [3, 8]. Moreover, some studies have shown the improvement of risk adjustment by GAM compared to linear models or categorization of linear terms [4, 14].
Given the significant change of sleep pattern nowadays, lack of enough sleep in more than half of the population of the US and the high prevalence of cardiovascular diseases, finding a significant association between sleep duration and HDL cholesterol/triglyceride may highlight sleep as an important risk factor for these diseases.
The current study had some limitations. The cross-sectional design cannot infer a causal relationship between sleep duration and HDL cholesterol/triglyceride. In addition, sleep qualities such as regularity/irregularity of sleep-wake schedules, difficulty initiating or maintaining sleep and excessive daytime sleepiness that are affecting health outcomes [13] were not assessed in NHANES dataset. Moreover, recall bias and seasonal variations in sleep could be the source of information bias. Due to the nature of study design, we didn’t seek the relationship of lipid lowering medications and sleep duration which needs proper follow-up studies.
Longitudinal studies are needed to improve the reliability and generalizability of our study findings.
Compliance with ethical standards
Conflict of interest
The authors declared that they have no conflict of interest.
Footnotes
Publisher’s note
Springer Nature remains neutral with regard to jurisdictional claims in published maps and institutional affiliations.
References
- 1.Aho V, Ollila HM, Kronholm E, Bondia-Pons I, Soininen P, Kangas AJ, Hilvo M, Seppälä I, Kettunen J, Oikonen M, Raitoharju E, Hyötyläinen T, Kähönen M, Viikari JS, Härmä M, Sallinen M, Olkkonen VM, Alenius H, Jauhiainen M, Paunio T, Lehtimäki T, Salomaa V, Orešič M, Raitakari OT, Ala-Korpela M, Porkka-Heiskanen T. Prolonged sleep restriction induces changes in pathways involved in cholesterol metabolism and inflammatory responses. Sci Rep. 2016;22(6):24828. doi: 10.1038/srep24828. [DOI] [PMC free article] [PubMed] [Google Scholar]
- 2.Altman NG, Izci-Balserak B, Schopfer E, Jackson N, Rattanaumpawan P, Gehrman PR, Patel NP, Grandner MA. Sleep duration versus sleep insufficiency as predictors of cardiometabolic health outcomes. Sleep Med. 2012;13(10):1261–1270. doi: 10.1016/j.sleep.2012.08.005. [DOI] [PMC free article] [PubMed] [Google Scholar]
- 3.Austin PC, Brunner LJ. Inflation of the type I error rate when a continuous confounding variable is categorized in logistic regression analyses. Stat Med. 2004;23:1159–1178. doi: 10.1002/sim.1687. [DOI] [PubMed] [Google Scholar]
- 4.Benedetti A, Abrahamowicz M. Using generalized additive models to reduce residual confounding. Stat Med. 2004;23:3781–3801. doi: 10.1002/sim.2073. [DOI] [PubMed] [Google Scholar]
- 5.Boucher KM, Slattery ML, Berry TD. Statistical methods in epidemiology: a comparison of statistical methods to analyze dose-response and trend analysis in epidemiologic studies. J Clin Epidemiol. 1998;51:1223–1233. doi: 10.1016/S0895-4356(98)00129-2. [DOI] [PubMed] [Google Scholar]
- 6.Brenner H, Blettner M. Controlling for continuous confounders in epidemiologic research. Epidemiology. 1997;8:429–434. doi: 10.1097/00001648-199707000-00014. [DOI] [PubMed] [Google Scholar]
- 7.Broussard J, Brady MJ. The impact of sleep disturbances on adipocyte function and lipid metabolism. Best Pract Res Clin Endocrinol Metab. 2010;24(5):763–773. doi: 10.1016/j.beem.2010.08.007. [DOI] [PMC free article] [PubMed] [Google Scholar]
- 8.Cochran WG. The effectiveness of adjustment by subclassification in removing bias in observational studies. Biometrics. 1968;24:295–313. doi: 10.2307/2528036. [DOI] [PubMed] [Google Scholar]
- 9.Kaneita Y, Uchiyama M, Yoshiike N, Ohida T. Associations of usual sleep duration with serum lipid and lipoprotein levels. Sleep. 2008;31(5):645–652. doi: 10.1093/sleep/31.5.645. [DOI] [PMC free article] [PubMed] [Google Scholar]
- 10.Kerkhofs Myriam, Boudjeltia Karim Zouaoui, Stenuit Patricia, Brohée Dany, Cauchie Philippe, Vanhaeverbeek Michel. Sleep restriction increases blood neutrophils, total cholesterol and low density lipoprotein cholesterol in postmenopausal women: A preliminary study. Maturitas. 2007;56(2):212–215. doi: 10.1016/j.maturitas.2006.07.007. [DOI] [PubMed] [Google Scholar]
- 11.Kinuhata S, Hayashi T, Sato KK, Uehara S, Oue K, Endo G, Kambe H, Fukuda K. Sleep duration and the risk of future lipid profile abnormalities in middle-aged men: the Kansai healthcare study. Sleep Med. 2014;15(11):1379–1385. doi: 10.1016/j.sleep.2014.06.011. [DOI] [PubMed] [Google Scholar]
- 12.Lin PMD, Chang KT, Lin YA, Tzeng IS, Chuang HH, Chen JY. Association between self-reported sleep duration and serum lipid profile in a middle-aged and elderly population in Taiwan: a community-based, cross-sectional study. BMJ Open. 2017;7(10):e015964. doi: 10.1136/bmjopen-2017-015964. [DOI] [PMC free article] [PubMed] [Google Scholar]
- 13.Longo DL, Fauci AS, Kasper DL, Hauser SL, Jameson J, Loscalzo J. Harrison's manual of medicine. New York: McGraw-Hill Medical; 2013. [Google Scholar]
- 14.Moore L, Hanley JA, Turgeon AF, Lavoie A. A comparison of generalized additive models to other common modeling strategies for continuous covariates: implication for risk adjustment. J Biomet Biostat. 2011;2:109. doi: 10.4172/2155-6180.1000109. [DOI] [Google Scholar]
- 15.National Sleep Foundation. (2013). National Bedroom Poll. Retrieved from: http://sleepfoundation.org/sites/default/files/RPT495a.pdf.
- 16.O'Keeffe M, Roberts AL, Kelleman M, Roychoudhury A, St-Onge MP. No effects of short-term sleep restriction, in a controlled feeding setting, on lipid profiles in normal-weight adults. J Sleep Res. 2013;22(6):717–720. doi: 10.1111/jsr.12060. [DOI] [PMC free article] [PubMed] [Google Scholar]
- 17.Petrov ME, Kim Y, Lauderdale D, Lewis CE, Reis JP, Carnethon MR, Knutson K, Glasser SJ. Longitudinal associations between objective sleep and lipids: the CARDIA study. Sleep. 2013;36(11):1587–1595. doi: 10.5665/sleep.3104. [DOI] [PMC free article] [PubMed] [Google Scholar]
- 18.Rothman KJ, Greenland S, Lash TL. Modern Epidemiology. Philadelphia: Lippincott, Williams & Wilkins; 2008. [Google Scholar]
- 19.Ruppert D, Wand MP, Carroll RJ. Semiparametric regression during 2003-2007. Electron J Statist. 2009;3:1193–1256. doi: 10.1214/09-EJS525. [DOI] [PMC free article] [PubMed] [Google Scholar]
- 20.Shin HY, Kang G, Kim SW, Kim JM, Yoon JS, Shin IS. Associations between sleep duration and abnormal serum lipid levels: data from the Korean National Health and nutrition examination survey (KNHANES) Sleep Med. 2016;24:119–123. doi: 10.1016/j.sleep.2016.05.012. [DOI] [PubMed] [Google Scholar]
- 21.van den Berg JF, Miedema HM, Tulen JH, Neven AK, Hofman A, Witteman JC, Tiemeier H. Long sleep duration is associated with serum cholesterol in the elderly: the Rotterdam study. Psychosom Med. 2008;70(9):1005–1011. doi: 10.1097/PSY.0b013e318186e656. [DOI] [PubMed] [Google Scholar]
- 22.Watson, N.F., Badr, M.S., Belenky, G., Bliwise, D.L., Buxton, O.M., Buysse, D., Dinges, D.F., Gangwisch, J., Grandner, M.A., Kushida, C., Malhotra, R.K., Martin, J.L., Patel, S.R., Quan, S.F., Tasali, E. (2015). Recommended amount of sleep for a healthy adult: a joint consensus statement of the American Academy of sleep medicine and Sleep Research Society. Sleep, 1, 38(6), 843–844. [DOI] [PMC free article] [PubMed]
- 23.Wood SN. Generalized additive models: an introduction with R. Boca Raton, FL: Chapman & Hall/CRC; 2006. [Google Scholar]
- 24.Zheng Y, Wang A, Pan C, Lu J, Dou J, Lu Z, Ba J, Wang B, Mu Y. Impact of night sleep duration on glycemic and triglyceride levels in Chinese with different glycemic status. J Diabetes. 2015;7(1):24–30. doi: 10.1111/1753-0407.12186. [DOI] [PubMed] [Google Scholar]


