

This manuscript has been amended as the incorrect image was originally published as Fig. 1. This has now been corrected and the Publisher apologises for any confusion caused.
Figure 1.
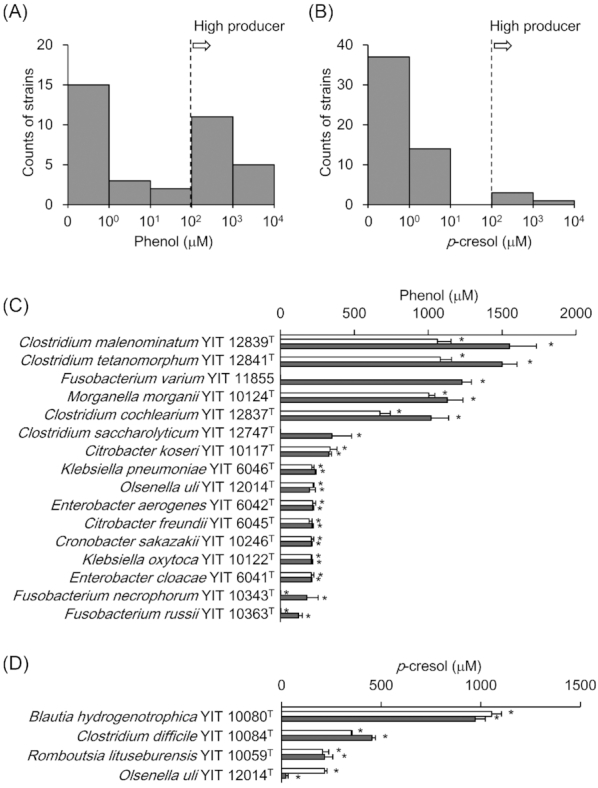
Evaluation of phenol and p-cresol production ability in 153 screened strains One-hundred fifty three strains were cultured in rich or poor medium for 6 days. The counts of (A) phenol-positive strains and (B)p-cresol-positive strains are shown as histograms. The concentrations of (C) phenol and (D)p-cresol produced in culture by high producers are shown.White bars indicate results using rich-medium; gray bars indicate those using basal medium. Error bars indicate standard deviations. Asterisks represent P < 0.05 as analyzed by Student’s t-test (increased compared with uncultured control medium).