Abstract
A highly luminescent rhenium (I) metal–ligand complex [Re(bcp)(CO)3(4-COOHPy)](ClO4), where bcp is 2,9-dimethyl-4,7-diphenyl-1,10-phenanthroline and 4-COOHPy is isonicotinic acid, has been synthesized and characterized. High quantum yields (> 0.5) and long excited-state lifetimes (0.3–10 μs) in fluid solutions at room temperature were found for this complex, with remarkable emission sensitivity to microenvironment. This compound also displays highly polarized emission with a maximum anisotropy near 0.3 in the absence of rotational diffusion. This Re complex was conjugated to several biomolecules, including the proteins human serum albumin and bovine immunoglobulin G, as well as an amine-containing lipid. When bound to a protein or lipid, the decay time is near 3 μs and the quantum yield is ~0.12 in aqueous oxygenated solution at room temperature. This compound’s unique spectral properties along with its conjugatability allowed us to utilize it as biomolecular probe in a variety of environments.
Luminescence probes are of great interest because of their high sensitivity and potential specificity. Lumines cence probes based on metal–ligand complexes show great promise in biochemistry and biophysics. In recent years there has been increased interest in the syntheses, characterization, and application of metal-ligand complexes in biomolecule research. In addition to their use as photosensitizers (1–4) and oxygen sensors (5, 6), metal–ligand complexes have been used as luminescence probes in polymers (7) and for biophysical studies (8–15). For instance, metal-containing intercalators such as square-planar platinum(II) complexes containing aromatic terp-yridine or phenanthroline ligands have been used in probing DNA structure and the intercalation process it self (8, 9). The reagent methidiumpropyl-Fe(II) EDTA, which contains a redox-active metal center tethered to an organic intercalator, has been applied in “foot printing” experiments to determine the sequence specificity of small drugs bound to DNA (10). Barton and co workers have used Ru(II) and Os(II) transition metal compounds to probe DNA structure (11–15) and to study long-range electron transfer (16, 17).
More recent studies have shown that ruthenium (Ru(II)), rhenium (Re(I)), and osmium (Os(II)) metal–ligand complexes display high anisotropy in the absence of rotational diffusion (18–21). Importantly, metal–ligand complexes display luminescence decay times ranging from 100 ns to 100 μs (22, 23). Consequently, these probes extend the observable time scale of anisotropy decay mea surements by orders of magnitude compared with that observed with routinely used fluorophores. As a result of this, metal–ligand complexes have been used to probe the microsecond dynamics of DNA (18). In addition, time-resolved anisotropy measurements of proteins can be ex tended to the microsecond time scale using metal–ligand complexes. Intensity and anisotropy decays of Ru(II) metal–ligand complexes when covalently linked to hu man serum albumin, concanavalin A, human immuno globulin G, and ferritin, demonstrated that this class of probes could be used to measure rotational motions from 10 ns to the 1.5-μs timescale (24), which so far has been inaccessible using the classical organic fluorophores. Fluorescence polarization immunoassays using metal–ligand complexes covalently bound to human serum albumin (as the antigen) demonstrated the potential use of metal–ligand complexes in fluorescence polarization immunoassays of high-molecular-weight analytes (20). The use of metal–ligand complexes enables fluorescence polarization immunoassays to bypass the limitation of low-molecular-weight antigens. This limitation is a consequence of the <10-ns decay times of the previously used fluorophores.
Although a wealth of information is available about luminescent metal–ligand complexes, the use of these complexes as biochemical probes is still in its infancy. In these probes, the ligands and metals may be varied in an easily controlled manner to facilitate a particular application (25). This versatile class of complexes appears to offer a variety of new opportunities for luminescence-based probes. One can expect more and more metal–ligand complexes with photoluminescence properties tailored to specific applications. It is this hope that stimulated the present studies.
In the present report we describe the luminescence spectral properties of a newly synthesized rhenium(I) metal–ligand complex and evaluated its potential as a biomolecular probe. These preliminary data suggest that the high quantum yields, long lifetimes, high an isotropy in the absence of rotational diffusion, and con jugatability to proteins and lipids make this rhenium complex a rather novel probe of macromolecular dynamics.
MATERIALS AND METHODS
Human serum albumin (HSA),3 bovine immunoglobulin G (IgG), dipalmitoyl-L-α-phosphatidylethanol amine (PE), and dipalmitoyl-L-α - phosphatidylglycerol (DPPG) were obtained from Sigma Chemical Co. and were used without further purification. 2,9-Dimethyl-4,7-diphenyl-1,10-phenanthroline (bcp), isonicotinic acid (4-COOHPy), AgClO4, NH4PF6, and Re(CO)5Cl were obtained from Aldrich and used as received. All solvents used were of HPLC or spectroscopic reagent grade. FTIR spectra were obtained on a Perkin Elmer 1600 series spectrophotometer with 4-cm-1 resolution. IR samples were dissolved in dichloromethane and measured in a liquid cell.
Preparation of Compounds
Re(bcp)(CO)3Cl.
Re(CO)5Cl (1 g, 2.76 mmol) was reacted with bcp (1.05 g, 2.9 mmol) in toluene under reflux with stirring for 1 h. The solution was cooled to room temperature and hexane was added which precipitated a yellow solid. This was collected on a coarse frit and washed with toluene followed by hexane. The product was dried under vacuum. Yield: 1.52 g (83%). Anal. Calcd for ReC29H20N2O3Cl: C, 52.29; H, 3.03; N,4.21. Found: C, 52.04; H, 2.93; N, 3.95. IR (nCO: 2021(vs), 1914(vs), 1895(vs) cm−1).
[Re(bcp)(CO)3(4-COOHPy)](ClO4).
Re(bcp)(CO)3Cl(1.5 g, 2.25 mmol), AgClO4 (514 mgs, 2.48 mmol), and 4-COOHPy (8.3 g, 67.5 mmol) were refluxed in 4:1 MeOH:toluene under argon in the dark for 24 h. This was cooled to room temperature and Filtered to remove the AgCl precipitate. The filtrate was rotovaped to dryness and the solid resuspended in CH2Cl2 and filtered (to remove 4-COOHPy). The filtrate was rotovaped to dryness and a bright yellow solid was obtained. Yield:1.8 g (94%). Anal. Calcd for ReC35H25N3O9Cl: C, 49.27;H, 2.95; N, 4.92. Found: C, 50.30; H, 2.98; N, 4.80. IR (nCO: 2034(vs), 2022(vs), 1919(vs) cm−1). The hexafluorophosphate salt was prepared by methathesis of the perchlorate salt by dissolving it in 1:1 acetone:H2O and precipitating it by the addition of a concentrated aqueous solution of NH4PF6. High-purity luminescence samples were prepared using chromatography procedures previously described in the literature (26, 27).
Synthesis of the NHS-Ester of [Re(bcp)(CO)3-(4-COOHPy)](ClO4) and Protein Labeling
Five milligrams of N,N′-dicyclohexylcarbodiimide (DCC) and 3 mg of N-hydroxysuccinimide (NHS) were dissolved in 0.15 ml of DMF with stirring; 10 mg of the Re-complex in 0.15 ml of DMF was then added, and the mixture was stirred for a few hours. The formed precipitate was removed by Filtration through a syringe Filter, and the Filtrate containing the active Re complex (Re–NHS) was used for labeling the substrates.
The proteins HSA and IgG (10 mg of protein) were labeled by adding a 15-fold molar excess of Re–NHS in 50 μl of DMF to 1 ml of stirred protein solution (0.2 M carbonate buffer, pH 8.5), followed by a 5-h incuba tion and purification of the labeled protein by gel Filtration chromatography on Sephadex G-25, using 0.1 M PBS, pH 7.0. Our 0.1 M PBS consisted of 0.1 M NaH2PO4 and 0.1 M NaHPO4 in deionized water. The dye:protein ratio of the Re–HSA conjugate was determined to be 2:1. The concentration of the protein was determined by the Coomassie Plus protein assay (Pierce) and the concentration of the Re(I) complex was determined by its absorbance at 400 nm (ϵ 5040 M−1 cm−1), assuming the same extinction coefficient as the free complex.
Synthesis of Re–PE
Ninety-FIve milligrams of the Re complex and 13 mg of NHS were dissolved in 0.7 ml of CHCl3 at room temperature; 24 mg of DCC was then added. The mixture was sealed and stirred for a few hours. The formed precipitate was removed by Filtration through a syringe Filter, and the Filtrate containing the active Re complex was slowly added to a stirred solution of PE (60 mg in7.5 ml of CHCl3) and triethylamine (4.5 ml) under an argon atmosphere. The mixture was stirred for 20 h in the dark. The solvents were removed under vacuum and the product was redissolved in 1.0 ml of CHCl3/MeOH (1/1, v/v). The pure Re–PE was obtained by TLC on K6F silica gel plates using CHCl3/CH3OH/NH3OH (65/25/4, v/v/v) as the developing solvent. The Rf value of the product is about 0.91, relative to that of PE (0.55).
Preparation of Lipid Vesicles
For vesicle preparation, lipids with a Re–lipid/DPPG mol ratio of 1:200 were dissolved in CHCl3, and the solvent was removed by a stream of argon. Vesicles were prepared by sonicating in 10 mM Tris, 50 mM KCl, pH 7.5, at a Final lipid concentration of 2 mg/ml of DPPG. The DPPG vesicles in the absence of Re–lipid did not display significant emission signals (2%) under the present experimental conditions. Before sonication, the lipid and Re complex were vacuum dessicated overnight to remove any traces of organic solvent. The vesticle solutions were deoxygenated by bubbling argon for 20 min, followed by equilibration with an argon atmosphere for 20 min and then a subsequent 20-min bubbling of the solution with argon.
Photoluminescence Measurements
Emission spectra were recorded on a SLM AB-2 spectrofluorimeter. Frequency-domain instrumentation (ISS) was used for measurements of luminescence intensity decays. The frequency-domain lifetime measurements of the free dye in solution were performed on an ISS (Champaign, IL) K2 fluorimeter, using a Panasonic high-intensity blue LED (light-emitting diode) configured to provide amplitude-modulated light centered at 390 nm (30). An Andover (Salem, NH) 500-nm long-wave pass Filter (500FH90–50S) was used to isolate the emission. For DPPG vesicle samples, frequency-domain lifetime measurements were performed using a Xenon arc lamp (300 W) as the light source. The excitation was amplitude modulated by an electrooptical low-frequency modulator (K2.LF from ISS) using 340 ± 8 nm as the excitation wavelength. A 470-nm long-pass Filter (Corning 3–71) was used to isolate the emission.
The frequency-domain intensity data were Fitted by a nonlinear least squares procedure and were modeled with single and multiexponential decay laws. The intensity decays were described by
| [1] |
where I(t) is the luminescence intensity at time t, and αi and τi are the preexponential weighting factors and the excited-state lifetimes, respectively. The subscripts denote individual components. Mean lifetimes were calculated using Eq. [2].
| [2] |
The measured excitation anisotropy spectra are deFined by
| [3] |
where I∥ and I⊥ are the emission intensities measured with vertically polarized excitation and the emission polarization parallel (I∥) or perpendicular (I⊥) to the excitation. The values of the polarized intensities were corrected for the transmission efficiency of the polarized components by the detection optics.
To probe emission heterogeneity, the excitation spectra method described by Demas and co-workers (28) was used. In brief, two uncorrected excitation spectra were measured with different emission wavelengths (λ1 and λ2). R(λ) is calculated as
| [4] |
where the E’s are the emission intensities while exciting at λ and monitoring at two different wavelengths, λ1 and λ2. Since the sample absorbance and excitation intensities are the same at each excitation wavelength, R is related to the relative contributions of different emission components. If there is no ground-state heterogeneity or the equilibration in the excited state is rapid relative to sample decay times, R(λ) is wavelength-independent. If there are multiple ground-state species that fail to equilibrate in their excited states, R(λ) varies with λ.
RESULTS AND DISCUSSION
Absorption Spectra
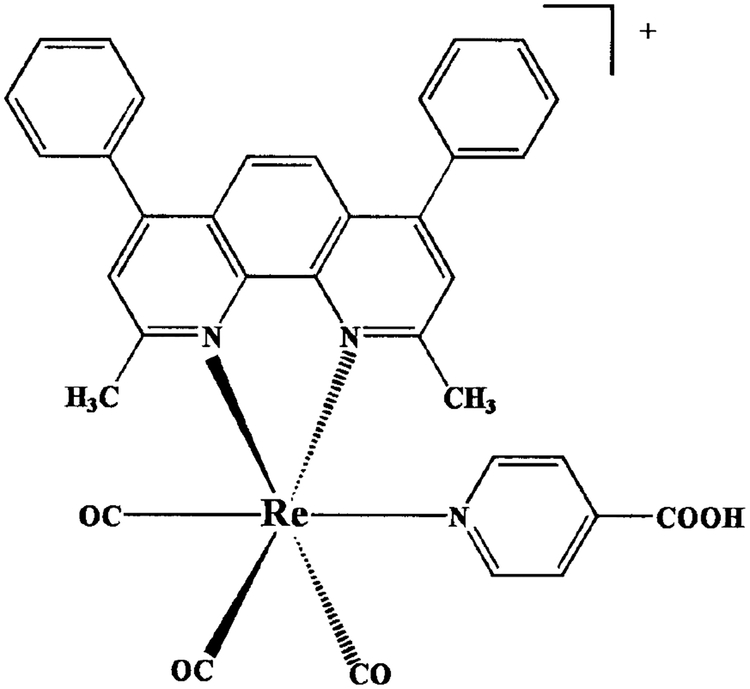
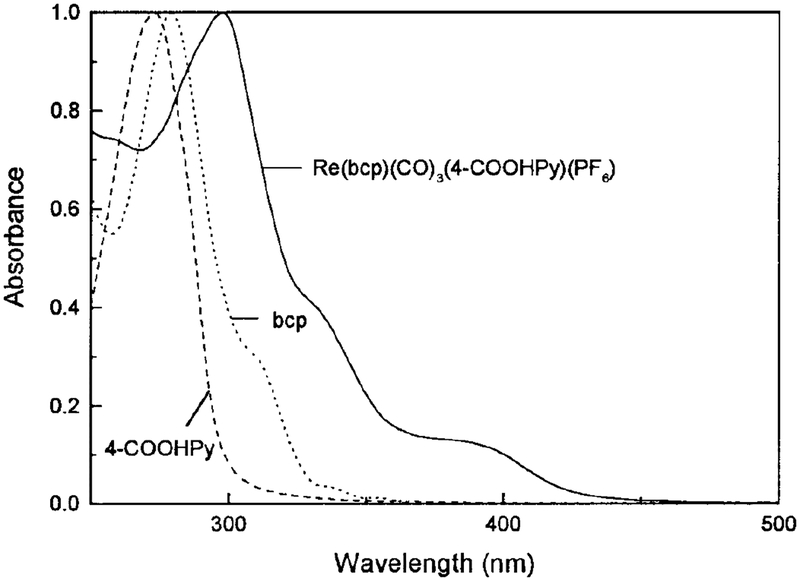
The molecular structure of [Re(bcp)(CO)3(4-COOHPy)]+ is shown in Fig. 1. The absorption spectrum of the Re complex in CH3OH is shown in Fig. 2. The absorption spectra of the ligands in CH3OH are also shown for comparison. The spectra are normalized to unity to facilitate comparison. The maximum of the low-energy absorption band around 340 ~ 450 nm and the more intense higher energy absorption at 298 nm are the characteristic MLCT and π–π * bands, respectively. These assignments are consistent with that previously observed for [Re (bcp) (CO)3(py)]+ (31). It is important to note that this complex can be excited with the UV output of a blue-light-emitting diode.
FIG. 1.
Molecular structure of [Re(bcp)(CO)3(4-COOHPy)]+.
FIG. 2.
Absorption spectra of [Re(bcp)(CO)3(4-COOHPy)]+, 2,9-dimethyl-4,7-diphenyl-1,10-phenanthroline (bcp), and isonicotinic acid (4-COOHPy) in methanol.
Photoluminescence Spectra
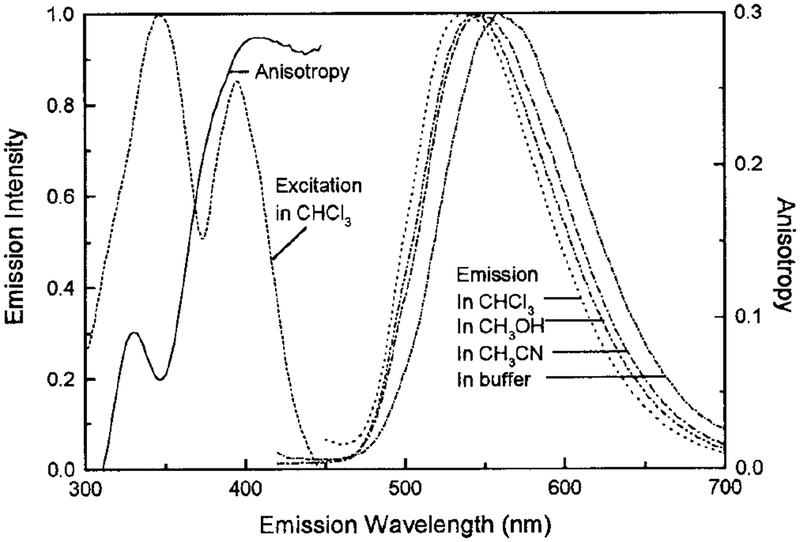
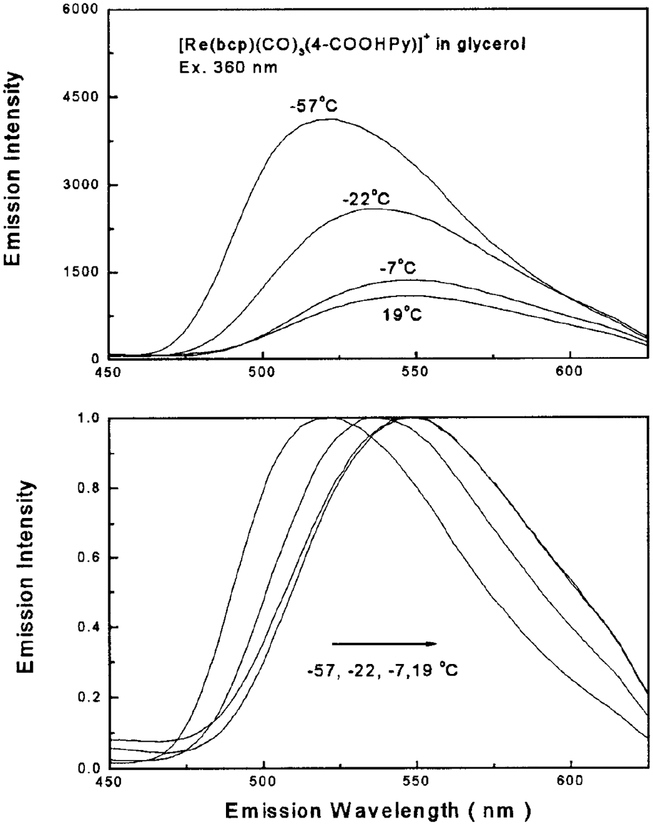
The excitation and emission spectra of the Re complex in CHCl3, CH3OH, and CH3CN are shown in Fig. 3. The large Stokes’ shift of this Re complex (~ 100 nm) makes it a good candidate for energy transfer studies as there is no possibility for self-quenching. The emission of this complex displays a strong sensitivity to local environment, as observed from the spectral shift of 539 nm in CHCl3 to 559 nm in 0.1 M PBS buffer solution at room temperature. When bound to biomolecules it is reasonable to expect that this complex’s emission may respond to subtle changes in the microenvironment of a biological sample. The emission intensity is strongly dependent on temperature as shown by the increased intensity at −57°C compared with 19°C (Fig. 4). There is also a significant blue-shift in emission maximum with decreasing temperature (Fig. 4). These results are consistent with the temperature dependence of many other MLCT complexes, wherein the energy gap between the ground and excited states increases with decreasing temperature, resulting in a blue-shifted emission spectrum, increased lifetime, and higher quantum yield (22,23,28,31).
FIG. 3.
Intensity-normalized excitation and emission spectra of [Re(bcp)(CO)3(4-COOHPy)]+ in CHCl3, CH3CN, and CH3OH and in buffer at room temperature. Excitation wavelength was 400 nm. The solid line shows the excitation anisotropy spectrum in 100% glycerol at −60°C, with the emission wavelength tuned to 550 nm. The band pass was 8 nm for all measurements.
FIG. 4.
Temperature-dependent emission spectra (top) and intensity-normalized emission spectra (bottom) of [Re(bcp)(CO)3−(4-COOHPy)]+ in 100% glycerol. Excitation was 360 nm with a bandpass of 8 nm.
Lifetime and Quantum Yield
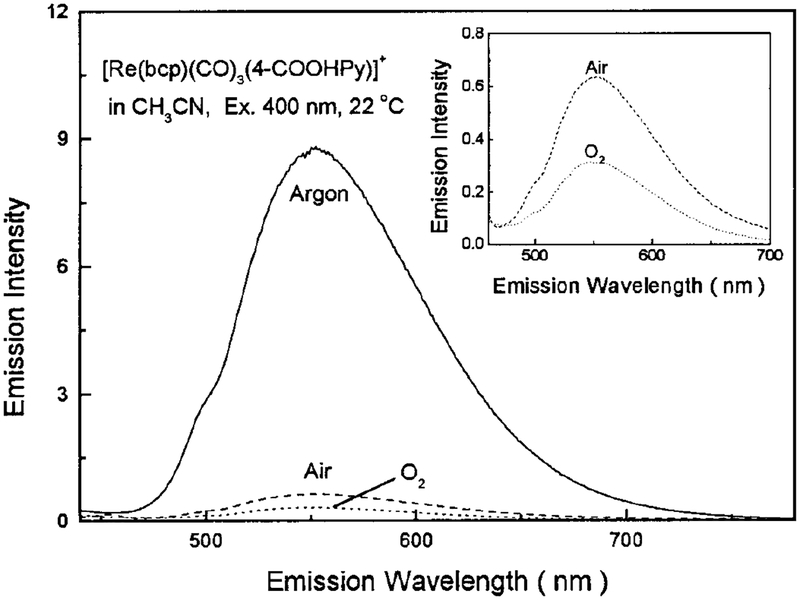
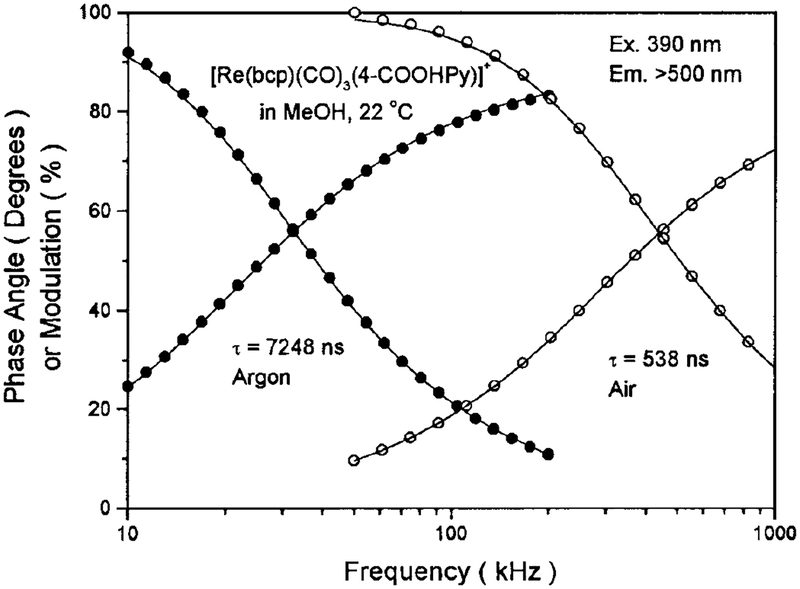
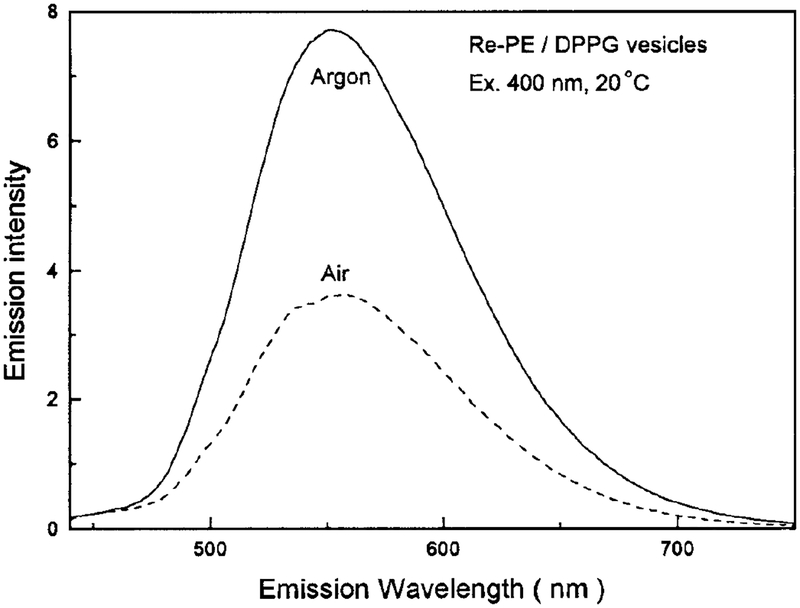
The lifetimes and quantum yields for [Re(bcp)-(CO)3(4-COOHPy)]+ are summarized in Table 1. Demas and co-workers (23) have demonstrated that certain rhenium complexes display high quantum yields, in excess of 0.7, and long lifetimes in excess of 10 μs in fluid solutions at room temperature. Our novel Re(I) complex is a remarkable example of such a high-quan tum-yield long-lifetime probe. It displays a lifetime over 10 μs in air-equilibrated glycerol, and long life times when the lipid conjugate Re–PE is embedded in DPPG model vesicles, as shown in Table 1. Owing to its long lifetime, it is also extremely sensitive to oxygen quenching. There is a significant increase in intensity with the removal of oxygen from the solution, as shown in Fig. 5. In methanol, in the absence of oxygen, a homogeneous intensity decay with a lifetime of 7248 ns was found. In the presence of dissolved oxygen, from equilibrium with air, the lifetime was reduced to 538 ns (Fig. 6). This result suggests that this complex may be used as an oxygen sensor in certain circumstances. The oxygen quenching, however, is much less efficient when the probe is bound to macromolecules, such as phospholipid vesicles, than when free in solvents (Fig. 7). We attribute this to a shielding of the excited state from oxygen quenching by macromolecules. More importantly, this complex displays a lifetime of 2.54 μs and a quantum yield of 0.13 in DPPG vesicles in aqueous solution at 22°C, which indicates that this long-lived probe can be used in the presence of dissolved oxygen and still display a long decay time and exhibit a high quantum yield.
TABLE 1.
Photoluminescence Quantum Yields and Lifetimes of Re(bcp)(CO)3(4-COOHPy)(PF6), at Room Temperature Unless Otherwise Indicated
| Solvent | Conditions | Φa | τ (μs) | Mean τ (μs) |
|---|---|---|---|---|
| CH3OH | Air | 0.039 | 0.54 | |
| CH3OH | Argon | 0.54 | 7.25 | |
| CHCl3 | Air | 0.047 | 0.66 | |
| CHCl3 | Argon | 0.55 | 6.72 | |
| CH3CN | Air | 0.016 | 0.49 | |
| CH3CN | Argon | 0.23 | 4.65 | |
| Glycerol | Air | 0.27 | 10.8 | |
| Re-PE in DPPG vesicles | Air | 0.13 (22°C) | 4.36 (2°C) | |
| 3.31 (10°C) | ||||
| 2.54 (22°C) | ||||
| 1.99 (35°C) | ||||
| 1.82 (50°C) | ||||
| Re-PE in DPPG vesicles | Argon | 0.27 | ||
| Re-IgG | Air | 0.12 | 2.92 | |
| Re-IgG | Argon | 0.22 | 4.07 | |
| Re-HSA | Air | 0.20 | 2.75 | |
| Re-HSA | Argon | 3.44 | ||
| 0.1 M PBS | Air | 0.99 |
Absolute quantum yields are difficult to determine in the presence of uncertain amounts of dissolved oxygen under air-equilibrated conditions.
FIG. 5.
Oxygen-dependent emission spectra of [Re(bcp)(CO)3−(4-COOHPy)]+ in CH3CN at room temperature. Excitation was 400 nm with a bandpass of 8 nm. Inset shows the spectra obtained in air and O2.
FIG. 6.
Frequency-domain intensity decays of [Re(bcp)(CO)3−(4-COOHPy)]+ in methanol. Excitation was 390 nm and a 500-nm cutoff Filter was used to isolate the emission.
FIG. 7.
Oxygen-dependent emission spectra of Re-PE embedded in DPPG vesicles with a mole ratio of Re-PE:DPPG 1:80. Excitation was 400 nm with a bandpass of 8 nm, measured at 20°C.
Anisotropy
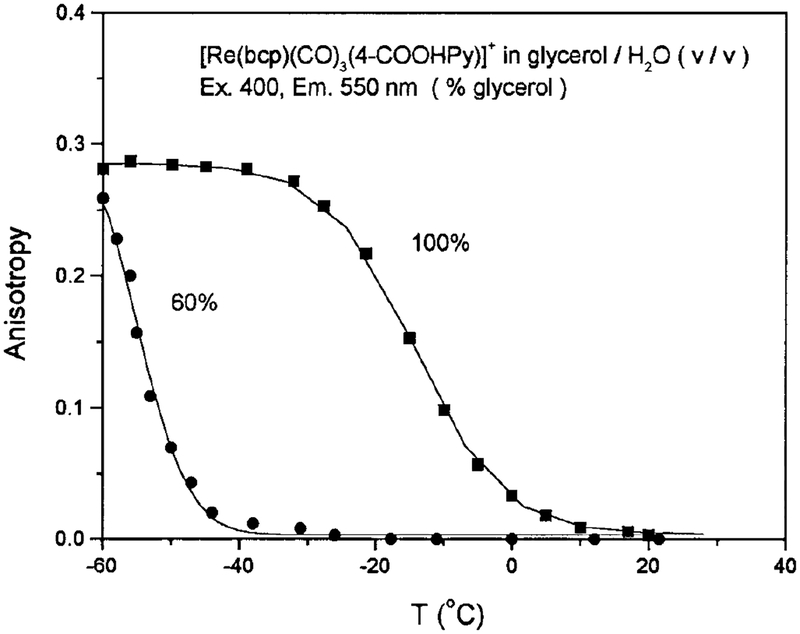
We also studied the polarized emission of this complex in the absence of rotational diffusion (glycerol, −60°C). The excitation anisotropy spectrum is shown in Fig. 3, which displays a maximum anisotropy near 0.3 from 390 to 450 nm. The anisotropy of this complex is also sensitive to solution viscosity, as shown in Fig. 8. Figure 8 is not meant to yield an exact relationship between the anisotropy and solution viscosity. For ex ample, at the same temperature, the viscosity of a 100% glycerol solution is larger than that of a 60% glycerol:water solution, and the anisotropy values demonstrate this behavior.
FIG. 8.
Temperature-dependent emission anisotropy of [Re(bcp)-(CO)3(4-COOHPy)]+ in solutions composed of different ratios of glycerol/H2O (v/v). Emission was monitored at 550 nm with an excitation wavelength of 400 nm and a bandpass of 8 nm.
Emission Characteristics
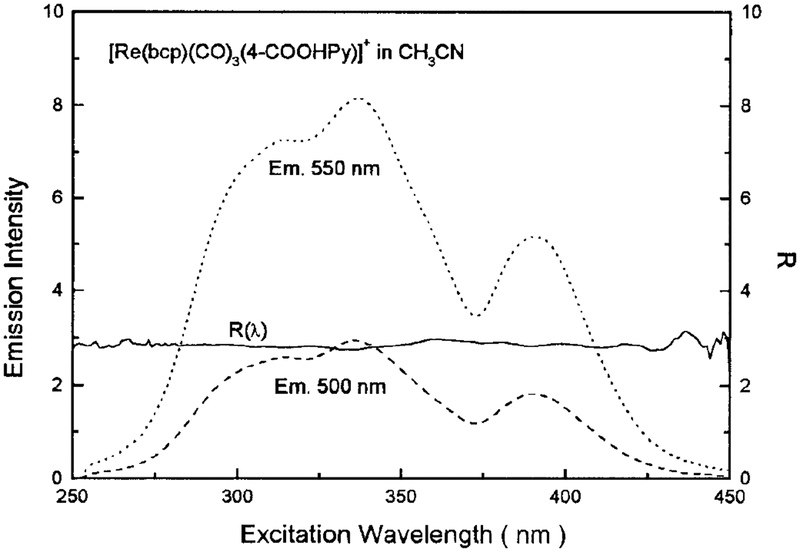
Rhenium (I) complexes are known to display dual emission, which can originate from either a MLCT state or a ligand-centered state (LC) (26, 29). The MLCT states typically show an unstructured emission, whereas the LC states often display a structural emission which is characteristic of ligand. The emission spectra in Fig. 3 are unstructured, suggesting that un der our experimental conditions the emission is from a pure MLCT state. The R(λ) values are flat across the excitation spectrum, which suggests that regardless of excitation wavelength, only one excited state parentage is created (Fig. 9).
FIG. 9.
Excitation spectra and R(l) values for [Re(bcp)(CO)3− (4-COOHPy)]+ in CH3CN. The R(λ) values were calculated from Eq. [4].
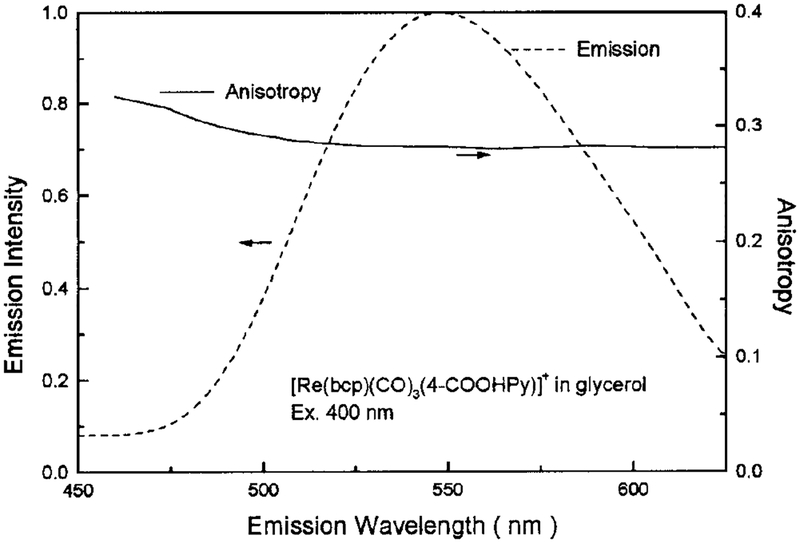
To further clarify the nature of the emission, and to characterize this complex for use as a biophysical probe, we examined the emission anisotropy (Fig. 10). The anisotropy is rather constant across the entire emission spectrum and displays a gradual decrease with increasing wavelength.
FIG. 10.
Emission anisotropy spectrum of [Re(bcp)(CO)3−(4-COOHPy)]+ in 100% glycerol at −06°C. Emission spectrum is shown for comparison. Excitation was 400 nm with a bandpass of 8 nm.
Preliminary Test for Probing Biomolecules
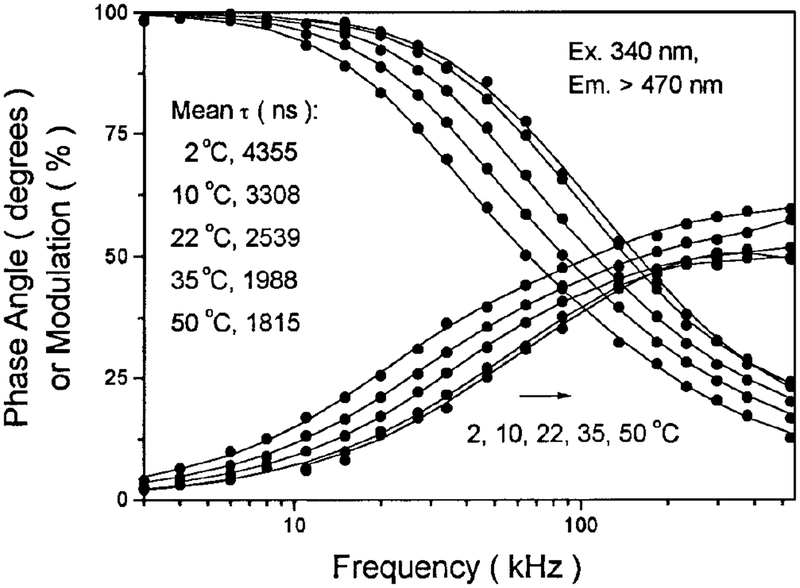
For use as a biomolecular probe, this complex was used to label the proteins bovine IgG and HSA, as well as the lipid PE. The lipid conjugate Re–PE was used to label the DPPG vesicles. The preliminary results demonstrate that this complex is conjugatable and that its water solubility is adequate for the usual labeling procedures used with the biomolecules. The typical frequency-domain intensity decays of DPPG vesicles la beled with Re–PE are shown in Fig. 11. The decays were best FIt using three exponential components, along with a scattering component. The recovered long lifetimes when bound to proteins and lipid model vesicles indicate that this complex might be used to study protein and membrane hydrodynamics and to measure rotational correlation times longer than 10 μs. We are presently evaluating the use of this complex in a polarization immunoassay with Re–HSA as an antigen. Preliminary data suggest that this complex can be utilized in a fluorescence polarization immunoassay for the detection of high-molecular-weight analytes. These results will be described elsewhere.
FIG. 11.
Frequency-domain intensity decays of DPPG vesicles la beled with Re-PE at various temperatures. Excitation was 340 nm and a 470-nm cutoff Filter was used to isolate the emission.
DISCUSSION
The flexibility in selection of the metal and the ligand renders metal–ligand complexes a versatile class of biomolecular probes. A wide range of lifetimes, absorption and emission spectra, and polarization character istics offers numerous experimental opportunities in biophysics and clinical chemistry. For instance, a long lifetime is desirable for fluorescence polarization immunoassays of high-molecular-weight antigens (20), whereas a long wavelength is favorable for noninvasive clinical applications, due to lower autofluorescence and higher tissue transmission at longer wavelengths. Although a variety of luminescence metal–ligand complexes have been synthesized and used as biophysical probes, additional research is needed to identify which of these metal–ligand complexes displays the most favorable spectral properties for a particular application, and to synthesize conjugatable forms of the desired probes.
The results described in this report demonstrate a unique and novel metal–ligand probe. With its high quantum yields, long lifetimes, and its highly polarized emission, it is reasonable to expect that this rhenium(I) complex may expand the measurement of rotational motions to timescales >10 μs when bound to macromolecules. It also suggests the possibility of a fluorescence polarization immunoassay of extremely high-molecular-weight (106–108 Da) antigens.
ACKNOWLEDGMENTS
This work was supported by a grant from the National Institutes of Health (RR-08119), with support for instrumentation from the NIH (RR-07510-01). F.N.C. was supported by the NIH with a post doctoral fellowship (1F32-GM-18653). This work was also supported by the National Natural Science Foundation of China. X.Q.G. also expresses appreciation for support from the Department of Chemistry at Xiamen University, China.
Footnotes
Abbreviations used: HSA, human serum albumin; IgG, immunoglobulin G; Re complex, [Re(bcp)(CO)3(4-COOHPy)](ClO4); PE, dipalmitoyl-L-a-phosphatidylethanolamine; Re–PE, covalent conjugate of the Re complex with PE; MLCT, metal-to-ligand charge transfer; LC, ligand-centered; DMF, dimethylformamide; PBS, phosphate-buf fered saline; DCC, N,N′-dicyclohexylcarbodiimide; NHS, N-hydroxy succinimide; DPPG, dipalmitoyl-L-a-phosphatidylglycerol; bcp, 2,9-dimethyl-4,7-diphenyl-1,10-phenanthroline.
REFERENCES
- 1.Seiler M, Durr H, Willner I, Joselevich E, Doron A, and Stoddart JF (1994) J. Am. Chem. Soc 116, 3399–3404. [Google Scholar]
- 2.Juris A, and Balzani V (1988) Coord. Chem. Rev 84, 85–277. [Google Scholar]
- 3.Kalyanasundaram K (1992) Photochemistry of Polypridine and Porphyrin Complexes, Academic Press, San Diego. [Google Scholar]
- 4.Balzani V, and Scandola F (1991) Supramolecular Photochemistry, Ellis Horwood, Chichester/New York. [Google Scholar]
- 5.Bambot SB, Rao G, Romauld M, Gary M, Carter M, Sipior J, Terpetchnig E, and Lakowicz JR (1995) Biosensors Bioelectronics 10, 643–652. [DOI] [PMC free article] [PubMed] [Google Scholar]
- 6.Caraway ER, Demas JN, Degraff BA, and Bacon JR (1991) Anal. Chem 63, 337–342. [Google Scholar]
- 7.Demas JN, and DeGraff BA (1992) Macromol. Chem. Micro-mol. Symp 59, 35–51. [Google Scholar]
- 8.Jennette KW, Lippard SJ, Vassiliade GA, and Bauer WR (1974) Proc. Natl. Acad. Sci. USA 71, 3839–3843. [DOI] [PMC free article] [PubMed] [Google Scholar]
- 9.Bond PJ, Langride R, Jennettle KW, and Lippard SJ (1975) Proc. Natl. Acad. Sci. USA 72, 4825–4829. [DOI] [PMC free article] [PubMed] [Google Scholar]
- 10.Hertzberg RP, and Dervan PB (1982) J. Am. Chem. Soc 104, 313–315. [Google Scholar]
- 11.Barton JK (1986) Science 233, 724–734. [DOI] [PubMed] [Google Scholar]
- 12.Jenkins Y, Friedman AE, Turro NJ, and Barton JK (1992) Biochemistry 31, 10809–10816. [DOI] [PubMed] [Google Scholar]
- 13.Barton JK, Danishefky AT, and Goldberg JM (1984) J.Am. Chem. Soc 106, 2172–2176. [Google Scholar]
- 14.Barton JK, and Lolis E (1985) J. Am. Chem. Soc 107, 708–709. [Google Scholar]
- 15.Kumar CV, Barton JK, and Turro NJ (1985) J. Am. Chem. Soc 107, 5518–5523. [Google Scholar]
- 16.Murphy CJ, Arkin MR, Jenkins Y, Ghatlia ND, Bossmann SH, Turro NJ, and Barton JK (1993) Science 262,1025–1029. [DOI] [PubMed] [Google Scholar]
- 17.Murphy CJ, Arkin MR, Ghatlia ND, Bossmann S, Turro NJ, and Barton JK (1994) Proc. Natl. Acad. Sci. USA 91,5315–5319. [DOI] [PMC free article] [PubMed] [Google Scholar]
- 18.Lakowicz JR, Malak H, Gryczynski I, Castellano FN, and Meyer GJ (1995) Biospectroscopy 1, 163–168. [Google Scholar]
- 19.Lakowicz JR, Murtaza Z, Jones PB Jr., Kim K, and Szmacinski H (1996) J. Fluoresc 6, 245–249. [DOI] [PubMed] [Google Scholar]
- 20.Terpetschnig E, Szmacinski H, and Lakowicz JR (1995)Anal. Biochem 227, 140–147. [DOI] [PMC free article] [PubMed] [Google Scholar]
- 21.Murtuza Z, Li L, Castellano FN, Szmacinski H, and La kowicz JR (1997) Biophys. J 72, A201 [Part 2 of 2] [Google Scholar]
- 22.Reitz GA, Demas JN, DeGraff BA, and Stephens EM (1988) J. Am. Chem. Soc 110, 5051–5059. [Google Scholar]
- 23.Sacksteder L, Lee M, Demas JN, and DeGraff BA (1993)J. Am. Chem. Soc 115, 8230–8238. [Google Scholar]
- 24.Terpetschnig E, Szmacinski H, Malak H, and Lakowicz JR (1995) Biophys. J 68, 342–350. [DOI] [PMC free article] [PubMed] [Google Scholar]
- 25.Lippard SJ (1978) Acc. Chem. Res 11, 211–217. [Google Scholar]
- 26.Wallace L, and Rillema DP (1993) Inorg. Chem 32, 3836–3843. [Google Scholar]
- 27.Sacksteder L, Zipp AP, Brown EA, Streich J Demas, J. N., and DeGraff, B. A. (1990) Inorg. Chem 29, 4335–4340. [Google Scholar]
- 28.Sacksteder L, Demas JN, and DeGraff BA (1989) Inorg. Chem 28, 1787–1792. [Google Scholar]
- 29.Giordano PJ, and Wrighton MS (1979) J. Am. Chem. Soc 101, 2888–2897. [Google Scholar]
- 30.Sipior J, Carter GM, Lakowicz JR, and Rao G (1997) Rev. Sci. Instrum 68(7), 2666–2670. [Google Scholar]
- 31.Zipp AP, Sacksteder LA, Streich J, Cook A, Demas JN, and DeGraff BA (1993) Inorg. Chem 32, 5629–5632. [Google Scholar]


