Abstract
The anticancer drug topotecan was detected in human plasma and whole blood using two-photon excitation at 730 or 820 nm. These wavelengths are longer than the main absorption bands of hemoglobin. Two-photon excitation of topotecan was demonstrated by a quadratic dependence of the emission intensity on the incident power, compared to a linear dependence for one-photon excitation at 410 nm. The observed emission centered at 525 nm was shown to be topotecan from the similarity of the emission spectrum and decay times observed for one-photon and two-photon excitation. Topotecan was detected at concentrations as low as 0.05 and 1 μM in plasma and whole blood, respectively. Since skin blood and tissues are translucent at long wavelengths, these results suggest the possibility of homogeneous or noninvasive clinical sensing with two-photon excitation.
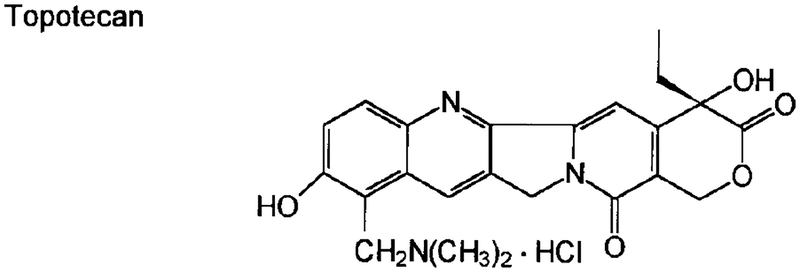
Topotecan (Scheme 1) is a water-soluble topoisomerase inhibiter which displays antitumor activity in animals and humans. This new drug has recently been approved by the FDA for chemotherapeutic treatment of ovarian cancers. Treatment with topotecan requires careful control of its concentration to assure effectiveness without excessive toxicity (1, 2).
SCHEME 1.
Structure of the lactone form of topotecan.
Topotecan and its analogs are known to display fluorescence when excited by one-photon near 350–420 nm (3, 4). However, such wavelengths are inconvenient for clinical monitoring because they are absorbed by tissues such as skin and blood, and these wavelengths also result in significant autofluorescence. In recent years there has been an increasing interest in the biomedical applications of light above 600 nm. This interest arises from the realization that the autofluorescence from tissues decreases with longer wavelength illumination, and that tissues are minimally absorbing at wavelengths above 650 nm. These spectral properties of tissues suggest the possibility of noninvasive diagnostics or imaging based on long-wavelength illumination. However, there are few natural chromophores or analytes of interest which display absorption at these long wavelengths.
Advances in laser technology have resulted in long wavelength lasers with femtosecond pulse widths. The high peak intensity of such sources raises the possibility of two-photon excitation, that is the simultaneous absorption of two long-wavelength photons to yield the first singlet state observed with uv excitation. Two-photon excitation has been applied in analytical chemistry (5–7), time-resolved fluorescence (8–10), and in fluorescence microscopy (11–13). To the best of our knowledge there have been no reports on the use of two-photon-induced fluorescence to detect analytes in human tissues or whole blood. In the present report, we show that physiologically relevant concentrations of the antibiotic topotecan can be detected by two-photon near infrared (NIR)1 excitation, in both human plasma and whole blood. Apparently, two-photon-induced fluorescence of the numerous possible interferences is not significant compared to the signal observed from micromolar concentrations of topotecan. This observation suggests the possibility of using long-wavelength two-photon excitation for direct measurements in whole blood or noninvasive detection through skin.
MATERIALS AND METHODS
Chemicals.
Topotecan was obtained from the National Cancer Institute, Division of Cancer Treatment. The drug was in the 20S configuration and was of high purity (>98%) as determined by HPLC assays with fluorescence detection (14–16). Drug stock solutions (2 × 10⁻³ M) were prepared in dimethyl sulfoxide (DMSO) and stored in the dark at −20°C. All other chemicals used in the study were reagent grade and were used without further purification.
Preparation of whole blood.
Whole human blood was obtained from a healthy male donor by drawing blood into sterile vacutainers containing either ethylenediaminetetraacetic acid (EDTA) or heparin to prevent clot formation. Human plasma samples were obtained from the Red Cross of Ohio and were used without further processing.
Instrumentation.
The emission of topotecan was observed using a combination of Corning filters: 3–71 and 4–96 plus a 03FHA020 heat filter. This combination showed a peak transmission of 55% near 530, with over 10% transmission from 440 to 580 nm.
Two-photon excitation at 820 nm was provided by a femtosecond mode-locked Tsunami Ti:Sapphire laser from Spectra Physics. The repetition rate of 80 MHz was held fixed by the Loc-to-Clock accessory. The repetition rate was divided by 8 by the Loc-to-Clock electronics, and used as the 10-MHz reference signal for the FD instrument. The pulse width was near 80 fs. Two-photon excitation at 730 nm was provided by pyridine dye laser, 7-ps pulse width, which synchronously pumped by mode-locked argon ion laser. Frequency-domain (FD) intensity decays with two-photon excitation were obtained on instrumentation described previously (17, 18). Time-domain (TD) intensity decays were obtained by time-correlated single-photon counting (TCSPC) (19) using a R2809 microchannel plate PMT as the detector.
RESULTS
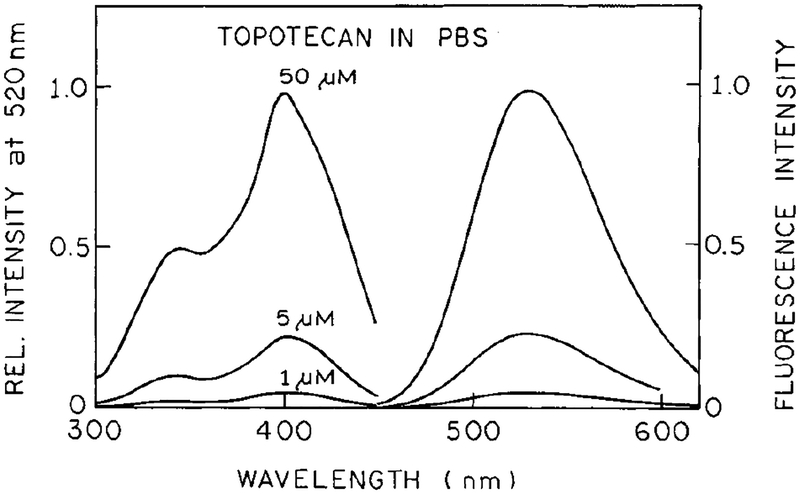
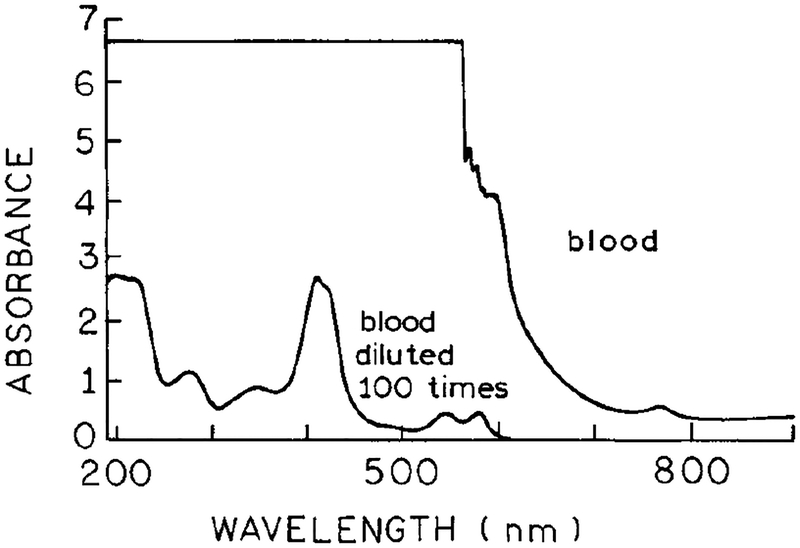
Excitation and emission spectra of topotecan are shown in Fig. 1. One-photon excitation of topotecan requires excitation at wavelengths below 400 nm, resulting in an emission centered at 530 nm. The single-photon excitation wavelength and emission spectrum of topotecan (Fig. 1) overlaps with the absorption of human plasma and whole blood (Fig. 2). These spectra suggest that it would be difficult, if not impossible, to detect topotecan with one-photon excitation.
FIG. 1.
Fluorescence excitation and emission spectra of topotecan in PBS (1, 5, and 50 μM).
FIG. 2.
Absorption spectra of whole blood and whole blood diluted 100-fold.
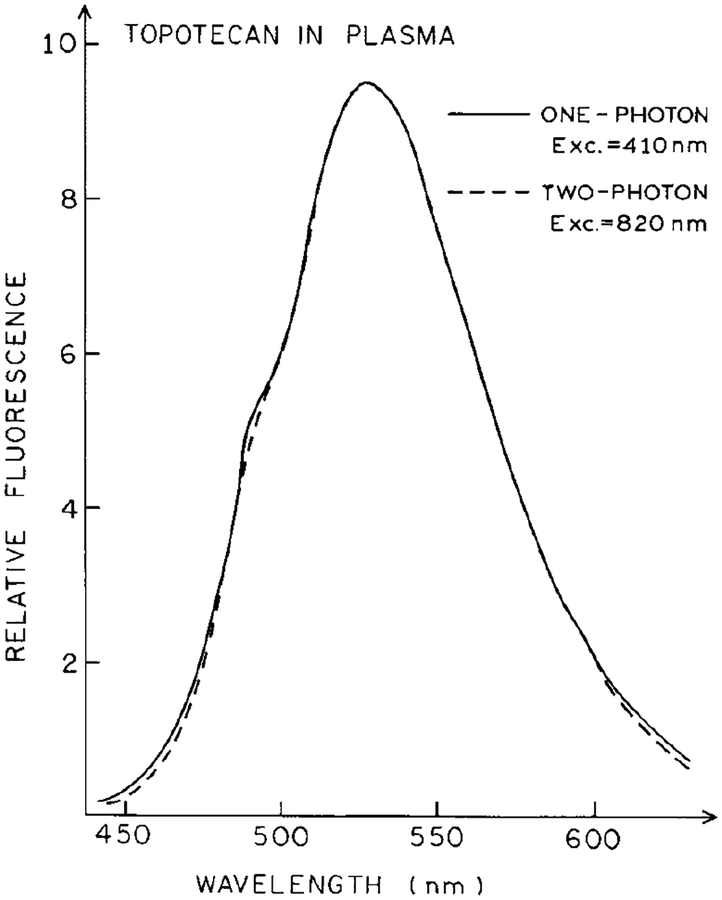
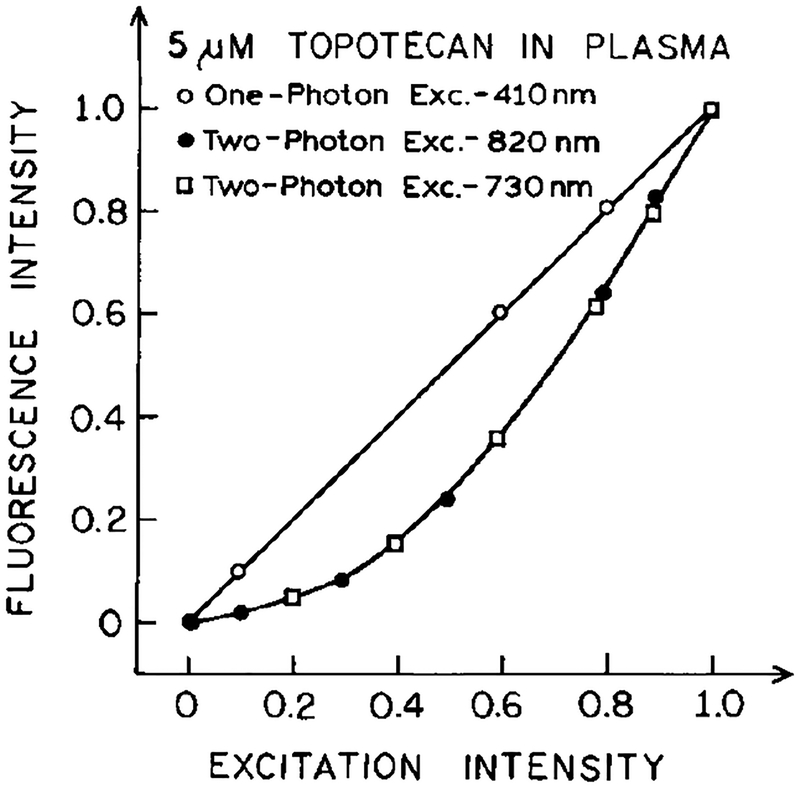
We compared the emission spectra of topotecan in PBS excited with one photon with the emission spectra of topotecan in plasma using two-photon excitation (Fig. 3). Plasma was selected for the initial experiments because one can readily remove the erythrocytes in a clinical setting. The emission spectra of topotecan in PBS and plasma were identical for excitation at 410 and 820 nm, respectively (Fig. 3). At these wavelengths the emission intensities depended linearly and quadratically on the intensity of the incident light, respectively (Fig. 4). The same emission spectrum was observed for excitation at 730 nm (not shown), and the topotecan intensity depended quadratically on the incident intensity at 730 nm (Fig. 4). These results indicate that the emission of topotecan is due to one-photon excitation (1PE) at 410 nm, and due to two-photon excitation (2PE) at 730 and 820 nm.
FIG. 3.
Emission spectra of 5 μM topotecan in plasma or in PBS for excitation at 820 nm or 410 nm, respectively. The intensities were normalized to unity at the highest excitation intensities.
FIG. 4.
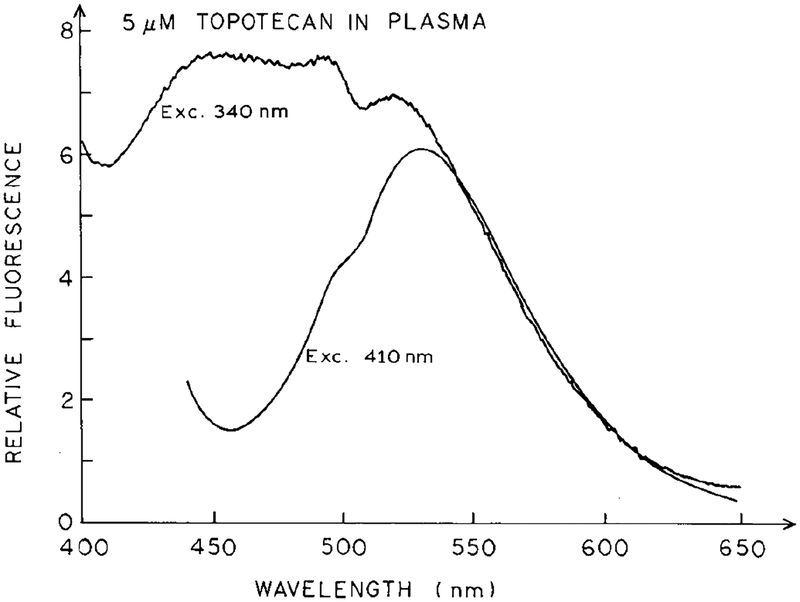
Emission spectra of 5 μM topotecan in plasma for excitation at 340 and 410 nm.
The advantages of two-photon excitation for detection of topotecan are shown in Fig. 5, which shows emission spectra for excitation at 340 and 410 nm. At 340 nm the background fluorescence from the plasma essentially overwhelms the emission from topotecan. At 410 nm one can detect the spectral shape of topotecan but one notices the increased amount of autofluorescence and/or scattered light on the short wavelength side of the emission spectrum. Comparison of the emission spectrum in PBS with 410 nm excitation (Fig. 5), with that observed for topotecan with two-photon excitation at 820 nm in plasma (Fig. 3), demon-strates a lower level of autofluorescence in plasma with two-photon excitation.
FIG. 5.
Dependence of topotecan emission intensity in plasma on the excitation intensity at 410, 730, and 820 nm. The intensities were normalized to unity at the highest excitation intensities.
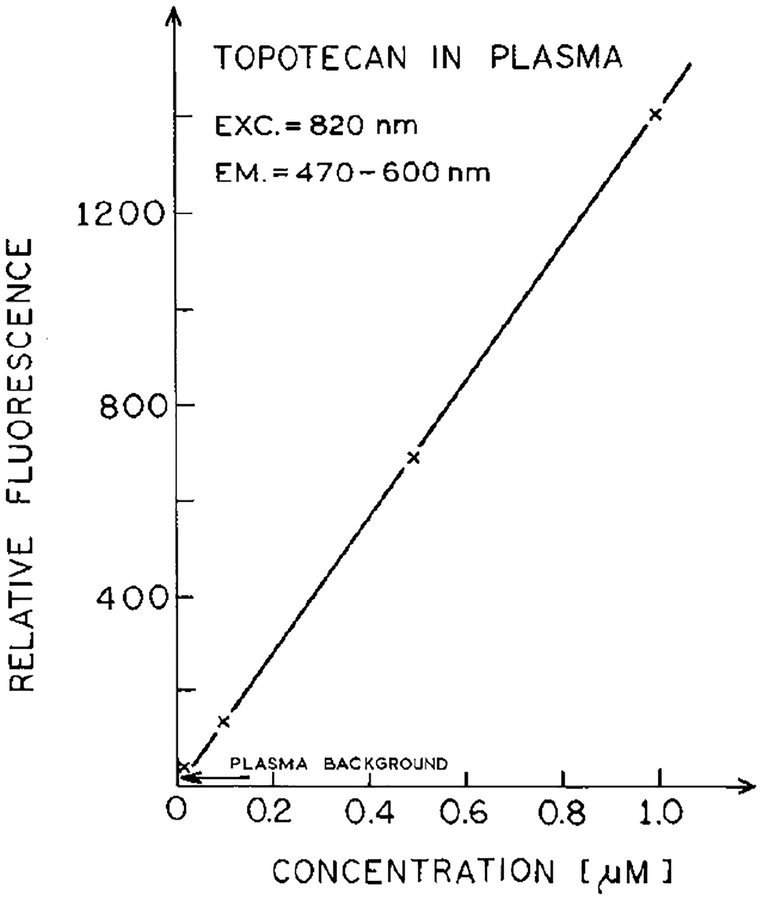
We questioned our ability to detect clinically relevant concentrations of topotecan using two-photon excitation. The concentration-dependent intensity of topotecan in plasma with 820 nm excitation is shown in Fig. 6. Remarkably, concentrations down to 0.2 μM are readily detected (10-fold over background), and the detection limit (2-fold over background) is near 0.05 μM for topotecan.
FIG. 6.
Concentration-dependent emission intensity of topotecan in plasma for excitation at 820 nm.
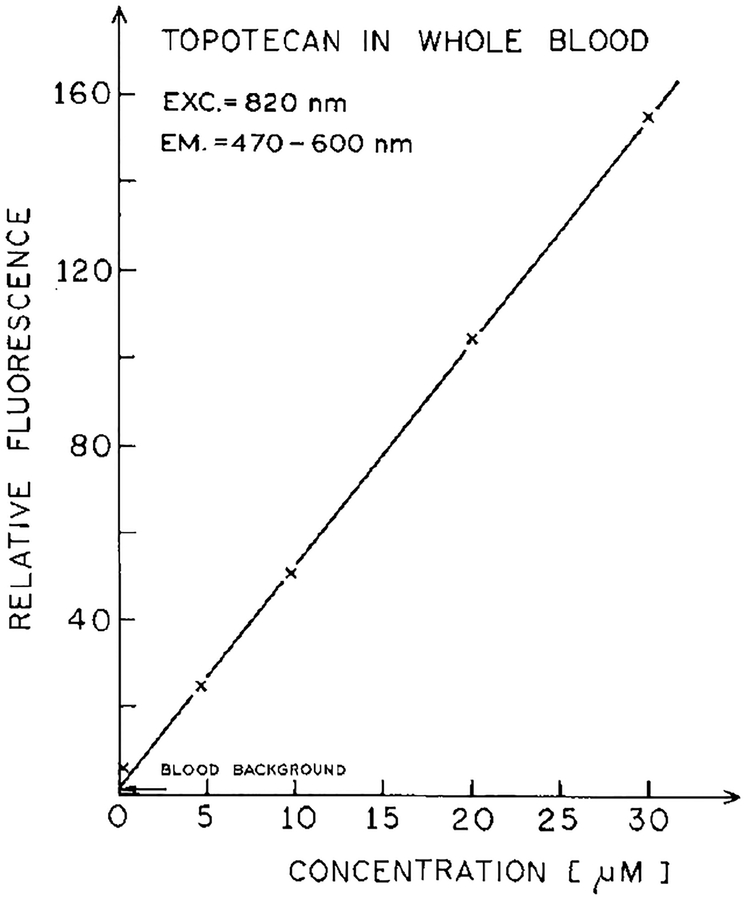
We were also able to detect topotecan in whole blood with 820 nm excitation (Fig. 7). In this case the signal was weaker, probably due to reabsorption of the topotecan emission by blood (Fig. 2). Nonetheless, the signal was linearly dependent on topotecan concentration, and the detection limit is about 1 μM. It was difficult to record the emission spectrum of topotecan in whole blood, but the spectrum we did observe appeared to be characteristic of topotecan (not shown).
FIG. 7.
Concentration-dependent intensity of topotecan in whole blood for excitation at 820 nm.
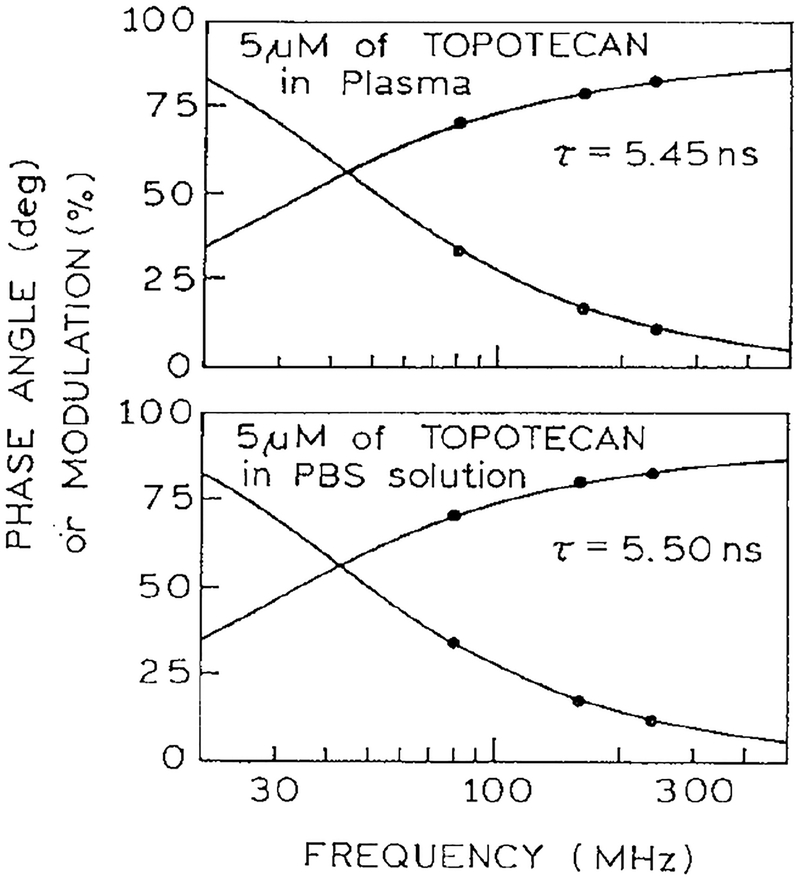
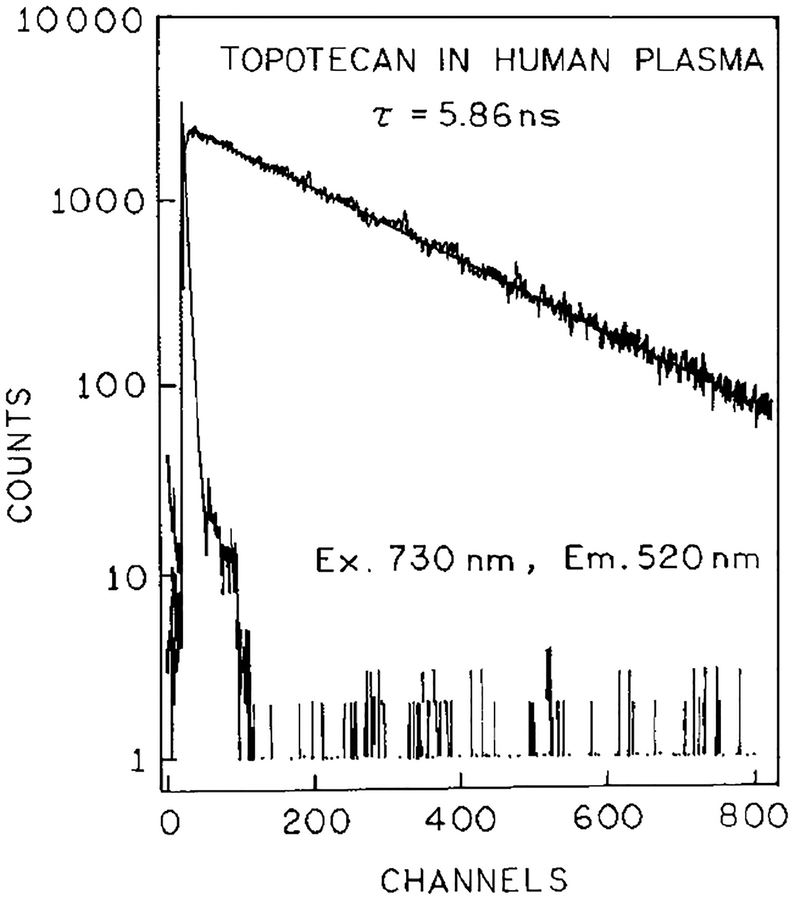
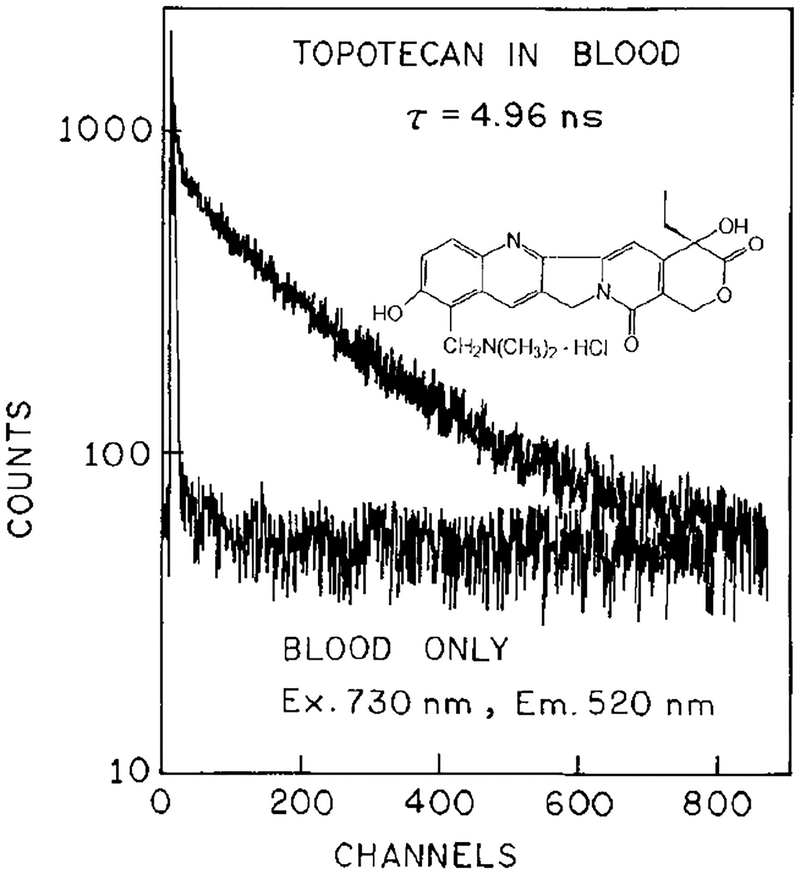
Blood and plasma contain numerous chromophores absorbing from 365 to 410 nm, and some of these may be expected to display 2PE at 730 or 820 nm. To confirm that the emission was in fact due to topotecan, we examined the fluorescence lifetimes. Frequency–domain lifetime data are shown in Fig. 8 for 820 nm excitation. Similar decay times were observed for two-photon excitation in plasma (top) or in PBS (bottom). The observed decay times are comparable to those observed for topotecan with one-photon excitation (5.8 ns). The decay times were also measured by TCSPC, in plasma (Fig. 9) and whole blood (Fig. 10) with 730 nm excitation. Once again the observed decay times in the 5-ns range are characteristic of topotecan. These lifetimes indicate that topotecan is the species responsible for the observed emission.
FIG. 8.
Frequency–domain intensity decay of topotecan in PBS and plasma with 820 nm excitation.
FIG. 9.
Time–domain intensity decay for topotecan in plasma for excitation at 730 nm.
FIG. 10.
Time–domain intensity decay for topotecan in whole blood for excitation at 730 nm.
DISCUSSION
The data described above indicate that at micromolar concentrations the emission of topotecan resulting from two-photon excitation at 730 and 820 nm is the dominant chromophore in whole blood or plasma. Our findings concerning the detectability of topotecan in blood at micromolar levels suggests that topotecan displays a high cross section for 2PE compared to those of endogenous fluorophores. In fact, we have recently confirmed that the cross section of topotecan is comparable to that of the classical fluorescence standard coumarin 110. We also now know that a variety of other camptothecins differing by substitutions in the quinoline fluorochrome can be readily detected at submicromolar concentrations in plasma using 2PE. In addition to the camptothecins, it is possible that other drugs and analytes displaying detectabilities in optically dense media due to high 2PE cross sections and good quantum yields may be identified.
Of profound interest to the medical scientists involved in the design of dosing regimens is the free or unbound fraction of drug present in blood, since it is this species which can exert activity. Previous investigations from this lab have shown that several camptothecins of current clinical interest display lifetimes and emission spectra that exhibit marked changes upon interaction with blood proteins and red blood cells, and these parameters have already been employed to delineate free and bound drug fractions in translucent samples using 1PE (14, 16). We are currently exploring the feasibility of using these spectral properties of the camptothecins in combination with 2PE in order to directly measure free and bound drug fractions in patient blood samples.
The topotecan detection limits of 0.05 and 1 μM in plasma and whole blood, respectively, determined in our experiments are comparable to some of the higher concentrations achieved in patients during treatment. Clinical dosing regimens for camptothecins is an area of active investigation and dosing may be reduced if host tissue toxicities cannot be safely controlled. At present we are examining possible implementation of existing detection and laser technologies in order to improve on the 2PE detectibility limits for topotecan as well as other clinically relevant camptothecins. Low levels of quantitation and the minimal health risks associated with long-wavelength illumination suggest the possible use of two-photon-induced fluorescence for noninvasive detection of camptothecin drugs and perhaps other analytes as well.
ACKNOWLEDGMENTS
This work was supported by the NIHCA 63653 and NIH National Center for Research Resources, RR-08119 and RR-10416.
Footnotes
Abbreviations used: PBS, phosphate-buffered saline; TD, time domain; FD, frequency domain; TCSPC, time-correlated single photon counting; 1PE, one-photon excitation; 2PE, two-photon excitation; NIR, near infrared; DMSO, dimethyl sulfoxide.
REFERENCES
- 1.van Warmerdam LJC, ten Bokkel Huinik WW, Rodenhuis S, Koier I, Davies BE, Rosing H, Maes RAA, and Beijnen JH (1995) J. Clin. Oncol 13(7), 1768–1776. [DOI] [PubMed] [Google Scholar]
- 2.Blaney SM, Cole DE, Godwin K, Sung C, Poplack DG, and Balis FM (1995) Cancer Chemother. Pharmacol 36, 121–124. [DOI] [PubMed] [Google Scholar]
- 3.Burke TG, Mishra AK, Wani MC, and Wall ME (1993) Biochemistry 32, 5352–5364. [DOI] [PubMed] [Google Scholar]
- 4.Mi Z, Malak H, and Burke TG (1995) Biochemistry 34, 13722–13728. [DOI] [PubMed] [Google Scholar]
- 5.Sepaniak MJ, and Yeung ES (1977) Anal. Chem 49(11), 1554–1556. [Google Scholar]
- 6.Steffen RL, and Lytle FE (1988) Anal. Chim 215, 203–210. [Google Scholar]
- 7.Wirth MJ, and Lytle FE (1977) Anal. Chem 49(13), 2054–2059. [Google Scholar]
- 8.Lakowicz JR, and Gryczynski I (1992) Biophys. Chem 45, 1–6. [DOI] [PubMed] [Google Scholar]
- 9.Lakowicz JR, Gryczynski I, Gryczynski Z, and Danielsen E (1992) J. Phys. Chem 96, 3000–3006. [DOI] [PMC free article] [PubMed] [Google Scholar]
- 10.Lakowicz JR, Gryczynski I, Kuśba J, and Danielsen E (1992) J. Fluoresc 2(4), 247–258. [DOI] [PubMed] [Google Scholar]
- 11.Denk W, Stricker JH, and Webb W (1990) Science 248, 73–76. [DOI] [PubMed] [Google Scholar]
- 12.Piston DW, Sandison DR, and Webb WW (1992) SPIE 1640, 379–388. [Google Scholar]
- 13.Huang Z, and Thompson NL (1993) Biophys. Chem 47, 241–249. [DOI] [PubMed] [Google Scholar]
- 14.Burke TG, and Mi Z (1994) J. Med. Chem 37(1), 40–46. [DOI] [PubMed] [Google Scholar]
- 15.Mi Z, and Burke TG (1994) Biochemistry 33(34), 10325–10326. [DOI] [PubMed] [Google Scholar]
- 16.Mi Z, and Burke TG (1994) Biochemistry 33(42), 12540–12545. [DOI] [PubMed] [Google Scholar]
- 17.Lakowicz JR, and Maliwal BP (1985) Biophys. Chem 21, 61–78. [DOI] [PubMed] [Google Scholar]
- 18.Laczko G, Lakowicz JR, Gryczynski I, Gryczynski Z, and Malak H (1990) Rev. Sci. Instrum 61, 2331–2337. [Google Scholar]
- 19.Birch DJS, and Imhof RE (1991) in Topics in Fluorescence Spectroscopy: Techniques (Lakowicz JR, Ed.), Vol. 1, pp. 1–95. Plenum, New York. [Google Scholar]


