

Abstract
Background
We previously found that the structural defects of the coronary collateral microcirculation reserve (CCMR) prevent these preformed collateral vessels from continuously delivering the native collateral blood and supporting the ischemic myocardium in rats. Here, we tested whether these native collaterals can be remodeled by artificially increasing pigment epithelium–derived factor (PEDF) expression and demonstrated the mechanism for this stimulation.
Methods and Results
We performed intramyocardial gene delivery (PEDF‐lentivirus, 2×10⁷ TU) along the left anterior descending coronary artery to artificially increase the expression of PEDF in the tissue of the region for 2 weeks. By blocking the left anterior descending coronary artery, we examined the effects of PEDF on native collateral blood flow and CCMR. The results of positron emission tomography perfusion imaging showed that PEDF increased the native collateral blood flow and significantly inhibited its decline during acute myocardial infarction. In addition, the number of CCMR vessels decreased and the size increased. Similar results were obtained from in vitro experiments. We tested whether PEDF induces CCMR remodeling in a fluid shear stress–like manner by detecting proteins and signaling pathways that are closely related to fluid shear stress. The nitric oxide pathway and the Notch‐1 pathway participated in the process of CCMR remodeling induced by PEDF.
Conclusions
PEDF treatment activates the nitric oxide pathway, and the Notch‐1 pathway enabled CCMR remodeling. Increasing the native collateral blood flow can promote the ventricular remodeling process and improve prognosis after acute myocardial infarction.
Keywords: collateral, collateral circulation, remodeling
Subject Categories: Coronary Circulation, Gene Therapy, Ischemia, Coronary Artery Disease
Clinical Perspective
What Is New?
Pigment epithelium–derived factor induces increased organization of adherens junctions and diameter expansion of coronary collateral microcirculation reserve, which in turn improves collateral blood flow during acute myocardial infarction.
We conclude that pigment epithelium–derived factor induces the remodeling of the coronary collateral microcirculation reserve in a manner similar to that of fluid shear stress.
What Are the Clinical Implications?
Our present findings demonstrate that promoting native collateral remodeling will effectively increase the compensatory blood flow and reduce the adverse effects of ischemic events, and they offer a practical approach for this promising novel therapeutic method for acute myocardial infarction.
In the coronary vascular system, the coronary collateral circulation is critically important for the adaptation of the heart during ischemic events, because it mitigates ischemic injury and preserves cardiac function.1, 2, 3 It is recognized that the presence of well‐functioning collaterals indicates that there will be less severe clinical manifestations of cardiac diseases and higher survival rates.4, 5, 6 In acute coronary occlusion, the extent of native coronary collaterals, preformed in humans regardless of coronary artery disease, is a significant indication of the severity of myocardial infarction (MI). However, for the vast majority of the population, native collaterals only possess a limited ability to deliver compensatory blood flow. In the past few decades, researchers have fully realized that promoting the growth (angiogenesis) or structural remodeling of collateral vessels would theoretically increase the compensatory blood flow of ischemic myocardium.7, 8, 9 Unfortunately, few studies in this area have shown tangible clinical value for patients with coronary artery disease.
Coronary collateral growth is a process involving coordination between growth factors expressed in response to ischemia and mechanical forces.10 Studies have demonstrated that vascular endothelial growth factor and angiotensin II can improve collateral function by promoting collateral angiogenesis in animal models. However, there were negative results in further clinical trials for patients with ischemic heart disease. Therefore, seeking ways to promote preformed collateral remodeling to achieve improved collateral function in patients with ischemic cardiomyopathy may be more feasible.11, 12, 13, 14, 15, 16 Fluid shear stress (FSS) is the key regulator of the adaptive process in recruited collaterals. FSS facilitates vascular endothelial cadherin (VE‐cadherin) assembly, promotes the proliferation of endothelial cells (ECs) and smooth muscle cells, thickens the walls of vessels, dilates the diameter, and promotes arteriogenesis (remodeling).17, 18, 19, 20
Recent studies by Schaper, and Tedgui and Dejan showed that the possible pathways involved in these actions are the Notch 1 pathway, the Ras‐Raf‐MEK‐ERK pathway, the Rho pathway, the nitric oxide (NO) pathway, and others.21, 22, 23 Our previous research showed that preformed coronary collateral microcirculation reserve (CCMR) in rats has enormous potential for the transport of compensatory blood flow. Under physiological conditions, there is typically little to no net blood flow in the CCMR, while effective flow is recruited by acute obstruction. Our further studies have shown that the CCMR is a unique blood vessel with congenital structural defects, including basement membrane discontinuity, VE‐cadherin assembly barrier, and greater permeability.24 It is recognized that VE‐cadherin is the most prominent cadherin at the adherens junction, which is specifically expressed in ECs and is responsible for regulating vascular permeability. VE‐cadherin is in dynamic equilibrium and is continuously recycled between the plasma membrane and intracellular compartments. Research suggests that membranes and VE‐cadherin assemble in an orderly fashion via head‐to‐head contacts in‐trans, thus promoting cell‐to‐cell adhesion. Although these collateral vessels are immature and they are incapable of reversing the outcome of acute myocardial infarction (AMI) because of their transitory characteristics, preformed pipe networks with a huge total cross‐sectional area exist. CCMR, which serves as a blood flow reserve, is an ideal target with a theoretical basis and practical value for collateral remodeling.24
PEDF (Pigment epithelium‐derived factor) is a 50‐kD endogenous secretory multifunctional protein of the serpin superfamily. It is commonly expressed in normal tissues and is implicated in many cardiovascular diseases.25 As an important regulator of the cardiac environment, PEDF plays an important role in the proliferation and development of blood vessels in the heart. It regulates the endothelial barrier function and junction stability, and inhibits EC migration, endothelial‐to‐mesenchymal transition, and retinal angiogenesis. In consideration of PEDF's superior pro‐endothelial maturation activity, we chose it as a factor for the intervention of collateral remodeling.
In the present study, we hypothesized that PEDF induces CCMR remodeling in a manner similar to that of FSS, thus maintaining compensatory blood flow stability, preserving more cardiomyocytes and cardiac function, and promoting ventricular remodeling. This was tested using a rat model with recombinant rat PEDF and positron emission tomography (PET) imaging.
Methods
The data that support the findings of this study are available from the corresponding author upon reasonable request.
All experiments were performed in adherence with the National Institutes of Health (NIH Publication, 8th Edition, 2011) guidelines on the use of laboratory animals. The animal care and experimental protocols were approved by the Xuzhou Medical University Committee on Animal Care.
Animal Feeding and Treatment
Sprague‐Dawley male rats (weighing ≈250±10 g, at 8–10 weeks of age, n=162) were obtained from the Experimental Animal Center of Xuzhou Medical College. Rats were housed in a controlled environment (humidity, 50–60%). A total of 3 rats were housed per cage and were maintained at room temperature under a 12‐hour light/dark cycle; rats were provided free access to food and water.
Preparations of Lentivirus and Plasmids
Recombinant lentivirus (PEDF‐LV; Shanghai GeneChem Co,. Ltd, Shanghai, China) was prepared as previously described.26 PEDF overexpression plasmids and the RNAi vector were successfully constructed and then packaged in 293T cells. The concentrated titer of virus suspension was 2×10¹² TU/L.
Rat MI/R Model and Intramyocardial Gene Delivery
The AMI model was induced by ligation of the left anterior descending (LAD) coronary artery as previously described.24 In brief, Sprague‐Dawley rats were anesthetized with an intraperitoneal injection of sodium pentobarbital (60 mg/kg) and maintained under anesthesia using isoflurane (1.5–2.0%) mixed with air. After adequate anesthesia, the animals were intubated with a 14‐gauge polyethylene catheter and ventilated with room air using a small‐animal ventilator (Model 683: Harvard Apparatus, Boston, MA). Intramyocardial gene delivery was performed 2 weeks before the MI experiment in the rats. PEDF‐LV (2×10⁷ TU) in 20 μL enhanced infection solution was delivered with a 20‐μL syringe and 25‐gauge needle into the myocardium along the LAD coronary artery. For MI model building, 6‐0 Prolene monofilament polypropylene sutures were formed and strategically placed for further manipulation. Sham‐operated animals underwent an identical surgical procedure without arterial ligation. Two weeks later, we tightened the reserved suture to block the LAD coronary artery.
Surface ECG Acquisition
ECG electrodes were attached to the paws to obtain a baseline reading (PowerLab, AD Instruments, Colorado Springs, CO). The criteria for screening rats to include in the study were as follows: (1) no previous Q‐wave, (2) no baseline ECG ST‐segment abnormalities, and (3) no arrhythmia. The ECG of each rat was continuously recorded before euthanasia.
Positron Emission Tomography
In order to detect the effect of PEDF treatment on coronary collateral blood flow in rats, myocardial PET perfusion imaging with 13N‐NH3 was conducted as previously described.24 In brief, PET was performed by Mitro Biotech Co, Ltd (NanJing, China). A micro PET (Siemens) dynamic scan was performed after 13N‐NH3 (500 μCi/kg) injection. The standardized uptake volume (SUV) was calculated using the following equation:
To perform the experiment, 18 rats were randomly divided into 3 groups as follows: (1) Control group; (2) Vector‐LV group; and (3) PEDF‐LV groups. Each rat was subjected to 3 PET scans. For each rat, PET scans were conducted before ligation (Sham), 5 minutes after ligation (AMI 5 minutes), and 4 hours after ligation (AMI 4 hours).
Measurement of MI Size
To measure the MI size, Evans blue/2,3,5‐triphenyltetrazolium staining was conducted at 1 week post‐AMI to detect the contributions of increased native collateral blood flow on MI size. Briefly, 1 week after LAD arterial ligation, 1 mL 3% Evans blue dye (Sigma‐Aldrich) was injected into the ascending aorta. Then, hearts were removed for MI size analyses by 2,3,5‐triphenyltetrazolium staining. The left ventricle was isolated and cut into 2‐mm‐thick sections perpendicular to the axis of the LAD. Then, slices were immediately immersed in 1% 2,3,5‐triphenyltetrazolium (Sigma‐Aldrich) in phosphate buffer (pH 7.4) at 37°C for 10 minutes to discriminate infarcted tissue from viable myocardium. All sections were scanned from both sides using a color charge‐coupled device camera (FV‐10; Fujifilm Holdings Corporation, Tokyo, Japan).
The rats were randomly divided into 4 groups as follows: (1) Sham group, surgical procedure without arterial ligation; (2) Control group, arterial ligation for 1 week; (3) Vector‐LV group, Vector‐LV injection+arterial ligation for 1 week; and (4) PEDF‐LV group, PEDF‐LV injection+arterial ligation for 1 week.
Cardiac Function Evaluation
Echocardiography was performed at the end of 1 week after induction of MI by placing the rats under anesthesia with sodium pentobarbital (30 mg/kg; intraperitoneal injection; Sigma‐Aldrich; Merck KGaA). Two‐dimensional‐guided M‐mode echocardiography was used to determine the left ventricular chamber volume at systole and diastole and contractile parameters, such as left ventricular end‐diastolic volume, left ventricular end‐systolic diameter (LVESD), and left ventricular end‐diastolic diameter (LVEDD). Left ventricular fractional shortening was calculated as follows: fractional shortening (FS) (%)=(LVEDD−LVESD)/LVEDD×100. The ejection fraction (EF) was then derived as EF (%)=(EDV−ESV)/EDV×100. All measurements were based on the average of at least 3 cardiac cycles.
The rats were randomly divided into 4 groups as follows: (1) Sham group, surgical procedure without arterial ligation; (2) Control group, arterial ligation for 1 week; (3) Vector‐LV group, Vector‐LV injection+arterial ligation for 1 week; and (4) PEDF‐LV group, PEDF‐LV injection+arterial ligation for 1 week.
Measurement of Cardiac Fibrosis
In order to study the effect of improved collateral blood flow on ventricular remodeling, cardiac fibrosis was determined by Masson's trichrome (MTC) staining (Solarbio Life Sciences; catalog #G1345). After harvest, hearts were sliced into frozen sections (8 μm), and Masson's trichrome staining was conducted. The fibrotic area in each sample was analyzed utilizing microcomputer‐assisted Image‐Pro Plus software. The fibrotic area was determined by calculating the area of positive Masson's trichrome staining region (blue).
The rats were randomly divided into 3 groups as follows: (1) Control group, arterial ligation for 1 day, 3 days, 1 week, and 4 weeks; (2) Vector‐LV group, Vector‐LV injection+arterial ligation for 1 day, 3 days, 1 week, and 4 weeks; and (3) PEDF‐LV group, PEDF‐LV injection+arterial ligation for 1 day, 3 days, 1 week, and 4 weeks.
Lectin‐Fluorescein Isothiocyanate Perfusion Experiment
Lectin–fluorescein isothiocyanate (FITC) assay was conducted as previously described.24 Lectin+vessels were defined as CCMR in LAD‐dependent regions at AMI 5 minutes and 4 hours. To mark the blood vessels with perfusion in real time, 1 mL of 50 μg/mL lectin from the Bandeiraea Simplicifolia‐FITC kit (Sigma‐Aldrich, catalog #L2895) was injected into the femoral vein of rats. After 30 s of blood circulation, hearts were immediately harvested, and frozen sections were created.
The rats were randomly divided into 3 groups as follows: (1) Control group, arterial ligation for 5 minutes and 4 hours; (2) Vector‐LV group, Vector‐LV injection+arterial ligation for 5 minutes and 4 hours; and (3) PEDF‐LV group, PEDF‐LV injection+arterial ligation for 5 minutes and 4 hours.
Lanthanum Nitrate Perfusion Experiment
To visualize perfusion, 2% lanthanum nitrate (MACKLIN, catalog #L812372, Shanghai, China) was dissolved in sodium dimethyl arsenate buffer. Then, 1 to 2 mL lanthanum nitrate solution was injected into the femoral vein of rat AMI models to mark blood vessels with perfusion in real time. After 30 s of blood circulation, hearts were harvested immediately, and samples (1×1×1 mm) were taken from the infarct area for transmission electron microscope examination.
The rats were randomly divided into 3 groups as follows: (1) Control group, arterial ligation for 5 minutes; (2) Vector‐LV group, Vector‐LV injection+arterial ligation for 5 minutes; and (3) PEDF‐LV group, PEDF‐LV injection+arterial ligation for 5 minutes.
Immunofluorescence
Sections were fixed with 4% paraformaldehyde for 15 minutes, permeabilized with Triton X‐100 (0.1%), and blocked with solution containing 5% bovine serum before applying the primary antibody. Specimens were incubated respectively with anti‐VE‐cadherin (Abcam, catalog #ab33168; 1:300), anti‐VE‐cadherin (Biolegend, catalog #348501), and anti‐vascular endothelial growth factor receptor 2 (Abcam, catalog #ab2349) for 12 hours in 4°C. The specimens were subsequently incubated with secondary antibodies (Life Technologies, catalog #A21207; 1:200), FITC‐conjugated Affinipure anti‐mouse IgG (H+L), and Alexa Fluor 488 goat anti‐mouse IgG (Life Technologies, catalog #A11001) under light‐protected conditions for 1 hour at room temperature. Nuclei were stained with DAPI (4′,6‐diamidino‐2‐phenylindole; KeyGen Biotech, catalog #KGA215–10). After final washing, the coverslips were mounted on slides using 50% glycerin. Then, the sections were observed under a fluorescence microscope (Olympus) or confocal laser scanning microscope (Olympus).
Preparations of PEDF Protein
Recombinant rat PEDF (GenBank accession number: NM_177927) was synthesized by Cusabio Biotech, Co, Ltd (Wuhan, China). In brief, 293T human embryonic kidney cells (American Type Culture Collection, Manassas, VA) were transfected with the recombinant vector pGEX 6P‐1 glutathione S‐transferase–tagged PEDF. Glutathione S‐transferase–tagged PEDF proteins were purified by high‐pressure liquid chromatography (>90% purity) and amino‐terminal sequence determination. The resulting proteins were soluble in aqueous solution.
Cell Culture and Treatment
Human coronary artery endothelial cells (HCAECs, ScienCell, catalog #6020) were used between the third and sixth passage and cultured in EC medium (ECM, ScienCell, catalog #1001) supplemented with 5% fetal bovine serum (ScienCell, catalog #0025), 1% penicillin/streptomycin, and 1% endothelial cell growth supplement (ScienCell, catalog #1052) solution at 37°C in a humidified atmosphere containing 5% CO2. The medium was replaced every 3 days, and HCAECs were subcultured or subjected to experimental procedures at 80% to 90% confluence. Oxygen‐glucose deprivation (OGD) was achieved by culturing cells in glucose‐free Dulbecco's modified Eagle's medium (Gibco) without fetal bovine serum supplement for glucose deprivation and in a tri‐gas incubator (Heal Force, Shanghai, China) saturated with 1% O2/5% CO2/94% N2 at 37°C for oxygen deprivation.
Endothelial Tube Formation
To study the relationship between PEDF and vascular remodeling in vitro, endothelial tubes were grown and observed. HCAECs were seeded on Matrigel (BD Biosciences, catalog #356237)‐coated 24‐well plates at a density of 50 000 cells per well. Groups were divided as follows: (1) Control group; (2) Pre‐PEDF group, PEDF protein (10 nmol/mL) was added to medium before the cells attached; and (3) Post‐PEDF group, PEDF protein (1 nmol/mL) was added to 250 μm ECM after the cells were attached for 6 hours. The extent of tube formation was quantified after 12 and 24 hours by superimposing a grid on microscopic images, and the number of squares containing tubes was counted and averaged from 10 randomly selected fields.
Cardiac Explant Angiogenesis Model
To determine the relationship between PEDF and vascular remodeling in vitro, cardiac explant angiogenesis was performed as previously described.27 In brief, isolated myocardial tissue from neonatal Sprague‐Dawley rats (1–3 days old, weighing 6.0±0.5 g) was minced into 1 to 2 mm3 pieces, and then washed with Ca2+‐Mg2+‐free phosphate‐buffered saline. After a 7‐minute digestion with 0.25% trypsin (VICMED, catalog #VC2005, China), the cardiac explants were seeded on 24‐well tissue culture plates (Corning, USA) coated with 250 μL Matrigel Basement Membrane Matrix. Then, the cardiac explants were cultured in ECM at 37°C. Groups were divided as follows: (1) Control groups; (2) Pre‐PEDF groups, PEDF protein (10 nmol/mL) was added to ECM when explant tissue was obtained; and (3) Post‐PEDF groups, PEDF protein (10 nmol/mL) was added to ECM on day 3 after explant tissue was obtained when angiogenesis had occurred. Hypoxia was achieved by culturing the explants in a tri‐gas incubator (Heal Force, Shanghai, China) saturated with 5% CO2/1% O2 at 37°C for the indicated time periods. Tubular structures were photographed with an inverted microscope (Olympus IX73, Tokyo, Japan). The endothelial network formation was quantified in randomly captured microscopic fields by measuring the number and length of formed vascular sprouts.
Western Blotting Analysis
Rat tissue protein in the myocardium of the infarct zone was extracted with lysis buffer (pH 7.5) containing 50 mmol/L Tris‐HCl, 150 mmol/L NaCl, 0.1% sodium dodecyl sulfate, 1% Triton X‐100, 1% Na‐deoxycholate, 1% protease, and complete protease inhibitor cocktail (Sangon Biotech, catalog #C510003). For the whole cell lysate, cells were lysed with a Cell Total Protein Extraction Kit (Sangon Biotech, catalog #C510003) containing a cocktail of phosphatase inhibitors and protease inhibitors. The membrane and cytoplasmic proteins were extracted using a Membrane and Cytoplasmic Protein Extraction Kit (Beyotime, catalog #P0033) according to the manufacturer's instructions.
Primary antibodies for VE‐cadherin, VEGFR‐2, VEGFR‐3, Ras, Erk1, Erk2, Rho, AKT, Dll4, Notch‐1, Notch intracellular domain (NICD), β‐actin, or Na+/K+‐ATPase were followed by fluorescently labeled anti‐mouse or anti‐rabbit antibodies (Li‐Cor), and the blot was then imaged using the Odyssey infrared imaging system (Li‐Cor). Western blots were quantified using ImageJ software. Protein levels were calculated from the ratio of corresponding protein/β‐actin, and membrane protein levels were calculated from the ratio of corresponding protein/Na+/K+‐ATPase.
Measurement of Intracellular Mitochondrial Reactive Oxygen Species Generation
The levels of mitochondrial reactive oxygen species were obtained by staining with MitoSOX™ as previously described.28 HCAEC cells (1×10⁴ per well) were seeded into each well of a 48‐well plate, underwent their respective treatments as aforementioned, and were subsequently loaded with 200 μL MitoSOX™ (5 mmol/L stock solution in ethanol dissolved in Hanks balanced salt solution for a working solution of 5 μmol/L) for 10 minutes at 37°C. After washing 3 times with phosphate‐buffered saline, nuclei were counterstained with Hoechst 33342 dye for 15 minutes at 37°C. Following 3 washes with phosphate‐buffered saline, the sample was observed using a fluorescence microscope (Olympus IX73; Olympus Corporation). Fluorescence was calculated by viewing in 5 randomly selected fields for each group. Image‐Pro Plus software (v6.0; Media Cybernetics, Inc) was used for quantification.
Measurement of NADPH Oxidase Activity
NADPH oxidase activity was assessed in all experimental groups using the NADPH oxidase activity assay kit.
Statistical Analysis
Numerical data are expressed as the mean±SEM. Two independent sample data sets were tested using 2‐tailed Student t test. Multiple group comparisons were evaluated by 1‐way ANOVA followed by least significant difference t test for post hoc analysis. Comparisons between repeated measurements, which were taken over time on the same sample, were performed using 2‐way repeated‐measures ANOVA. Analyses were performed using SPSS software (SPSS, Inc, Chicago, IL). P<0.05 was considered a significant difference.
Results
PEDF Improves the Native Collateral Blood Flow During AMI
The blood flow in LAD‐dependent myocardial tissue before ligation, 5 minutes, and 4 hours after ligation was detected by micro‐PET. It was observed that 5 minutes after ligation, there was an uneven low‐intensity compensatory blood flow in the ischemic area of each group of rats (Figure 1A). Compared with the 5‐minute ligation, the compensatory blood flow intensity in each group decreased by varying degrees after 4 hours of ligation (Figure 1B and 1C). PEDF treatment significantly increased the perfusion level of ischemic myocardium (3.23±0.222 versus 1.72±0.10 [control], P<0.001) and reduced the volume of ischemic myocardium (31.39±2.61% versus 41.56±2.23% [control], P<0.05) (Figure 1C and 1D). In addition, it is necessary to emphasize that PEDF treatment significantly inhibited the decrease in the native collateral flow (delta mean‐SUV, 0.31±0.05 versus 0.90±0.05 [control], P<0.05) and the expansion of ischemic myocardial volume (delta ischemic myocardial volume, 3.77±0.64 versus 10.08±0.77 [control], P<0.05) in the early stage of AMI (Figure 1F and 1G).
Figure 1.
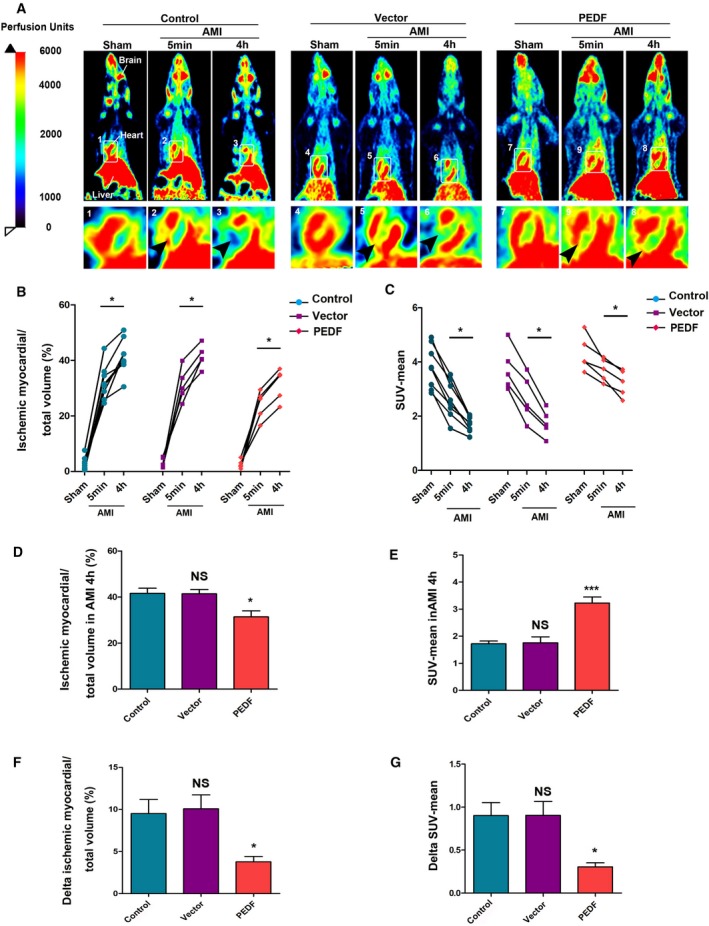
PEDF improves native collateral blood flow during AMI. A, Representative myocardial perfusion images of the control, vector, and PEDF group during AMI by positron emission tomography scan (arrows indicate perfusion in ischemic areas). B, Quantification of ischemic myocardial volume, *P<0.05 vs the indicated group. C, Quantification of SUV‐mean, *P<0.05 vs the indicated group. D, Quantification of ischemic myocardial volume in AMI 4 hours, *P<0.05, not significant (NS), P>0.05 vs the control group. E, Quantification of SUV‐mean in AMI 4 hours. ***P<0.001, NS, P>0.05 vs the control group. F, Quantification of the expansion of ischemic myocardial volume (delta ischemic myocardial volume), NS, P>0.05, *P<0.05 vs the control group. G, Quantification of the decline of SUV‐mean (delta SUV‐mean), NS>0.05, *P<0.05 vs the control group, n (control)=8; n (vector and PEDF)=5, each bar represents the mean±SEM. AMI indicates acute myocardial infarction; NS, not significant; PEDF, pigment epithelium–derived factor; PET, positron emission tomography; SUV, standardized uptake volume.
PEDF Promotes the Process of Ventricular Remodeling and Protects the Ischemic Myocardium and Cardiac Function
The degree of blood and oxygen obtained by the ischemic myocardium is the dominant factor that determines the survival of the myocardium, and the greater the degree, the better the prognosis. At 1 week post‐AMI, staining to determine infarct size indicated that PEDF treatment significantly reduced the infarct size (14.42±1.49% versus 23.89±2.50% [control], P<0.001) compared with the control groups (Figure 2A). Next, cardiac contractile function was measured using transthoracic 2‐dimensional‐guided M‐mode echocardiography (Figure 2B). The EF and FS were both significantly higher in the PEDF treatment groups compared with the control groups (EF: 67.52±2.59% versus 59.16±1.28% [control], P<0.01; FS: 34.50±1.18% versus 25.52±0.97% [control], P<0.01) (Figure 2C and 2D).
Figure 2.
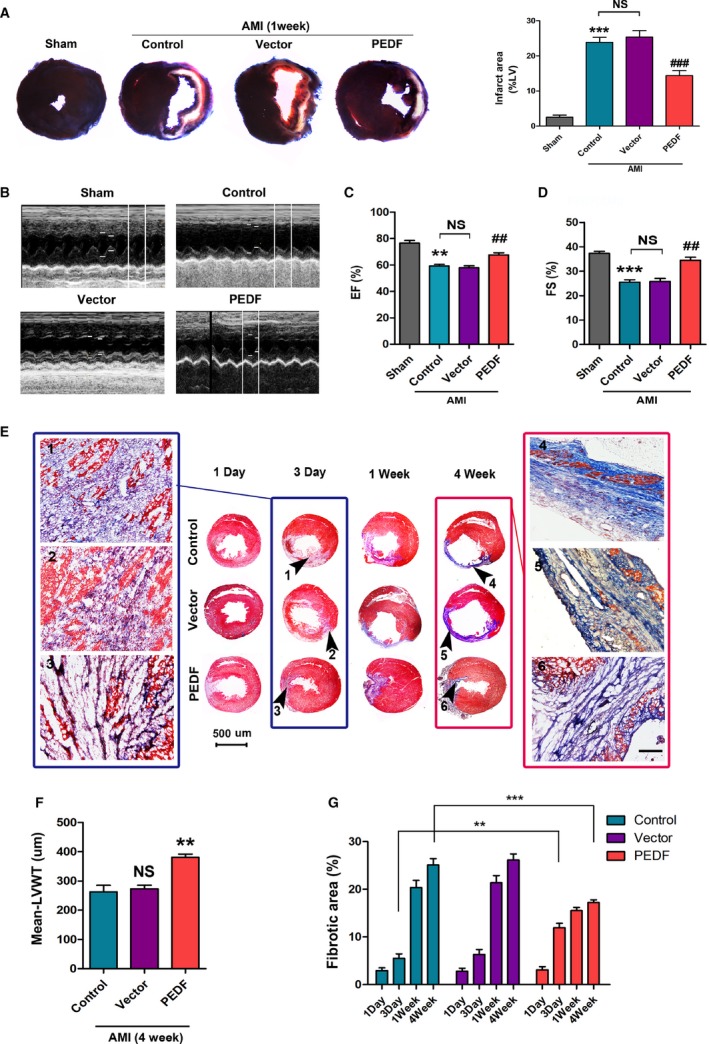
PEDF promotes the process of ventricular remodeling and protects the ischemic myocardium and cardiac function. A, Representative figures of the Evans blue/2,3,5‐triphenyltetrazolium–stained myocardial tissues in each indicated experimental condition, with quantification of the infarct size, ***P<0.001 vs the sham group, ### P<0.001 vs the control group, NS, P>0.05 vs the indicated group, n=6. B, Cardiac function was measured by transthoracic M‐mode echocardiography. C, Left ventricular ejection fraction (EF%), **P<0.01, vs the sham group, ## P<0.01, vs the control group, NS, P>0.05 vs the indicated group. D, Left ventricular fractional shortening (FS%), ***P<0.05, vs the sham group, ## P<0.01, vs the control group, NS, P>0.05 vs the indicated group, n=6. E, Representative Masson staining of the heart sections 1 day‐4 weeks post‐AMI; the black arrows indicate the infarct areas. The results of AMI 3 days are shown in the blue box; the results of AMI 4 weeks are shown in the red box, bar=50 μm. F, Quantitative analysis of mean‐left ventricular wall thickness (mean‐LVWT), **P<0.01, NS, P>0.05 vs the control group. G, Quantitative analysis of the fibrotic area, **P<0.01, ***P<0.001 vs the indicated group, n=6. AMI indicates acute myocardial infarction; NS, not significant; PEDF, pigment epithelium–derived factor.
The process of cardiac fibrosis was determined at 1 day, 3 days, 1 week, and 4 weeks by Masson staining (Figure 2E). The results revealed that tissue fibrosis occurred ≈3 days after AMI, significantly at 1 week, and the ventricular remodeling was completed at 4 weeks. PEDF promotes the process of fibrosis in 3 days (12.53±1.81% versus 6.09±0.85% [control], P<0.01). In 4 weeks, the PEDF‐treated rat hearts showed greater ventricular wall thickness (380.70±10.91 μm versus 262.78±22.30 μm [control], P<0.01) and smaller fibrotic area (17.21±1.66% versus 25.13±1.88% [control], P<0.001) (Figure 2F and 2G, respectively).
PEDF Induces the CCMR Remolding In Vivo
Next, the lectin‐FITC assay was performed to determine the relationship between PEDF and these native collaterals (Figure 3A). The results demonstrated that the number of CCMR vessels in the PEDF group was significantly reduced (372.01±35.52 versus 985±37.94 [control], P<0.001). In addition, we found that PEDF treatment enabled inducement of the CCMR diameter to double and effectively prolong its working time (Figure 3B through 3D). This observation helped us solve the previous dilemma. The dilation of the vascular diameter not only counteracts the effect of the decrease in the number of blood vessels, but also increases the vascular volume and the ability of the blood vessels to continuously work. In Figure 3E, we found that CCMR vessels affected by PEDF were able to confine lanthanum nitrate to the lumen of the vessel and prevent it from leaking out. Immunofluorescence analysis showed that the loose distribution of VE‐cadherin was reversed to a certain extent after PEDF treatment (Figure 3F). Based on these results, we conjectured that PEDF treatment has the ability to induce CCMR remodeling, and we called this process “pruning.”
Figure 3.
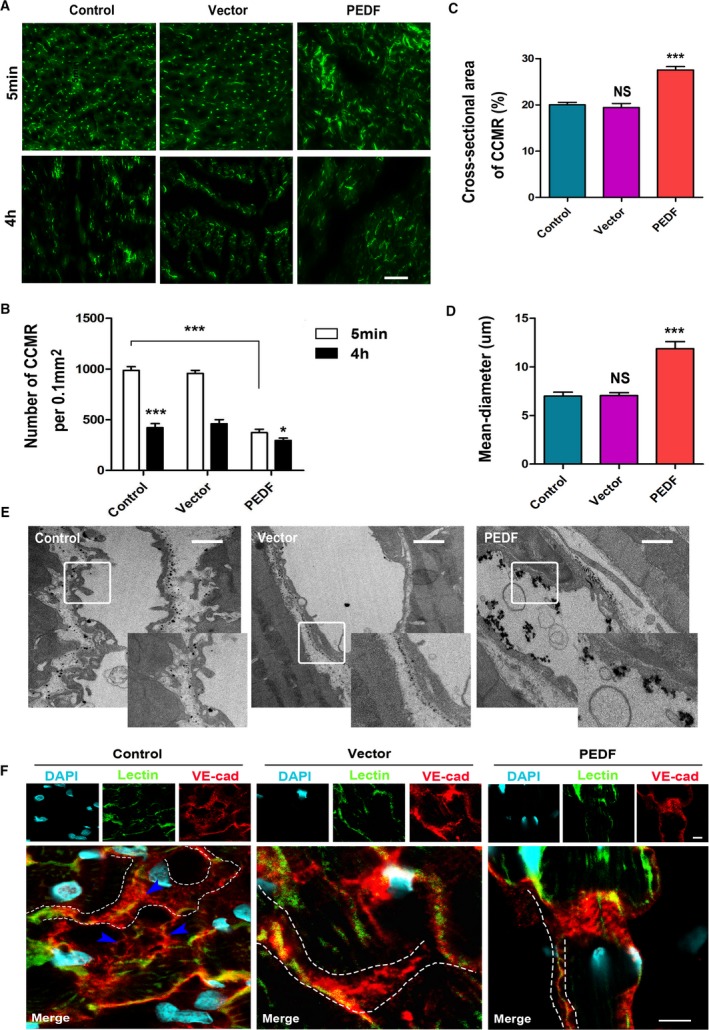
PEDF induces the CCMR remodeling in vivo. A, Representative figures of CCMR in the infarct area in each indicated experimental condition (bar=50 μm). B, Quantification of the density of CCMR, *P<0.05, ***P<0.001 vs the respective result of 5 minutes, ***P<0.001 vs the indicated group. C, Total cross‐sectional area of CCMR, NS, P>0.05, ***P<0.001 vs the control group. D, Quantification of the mean diameter of CCMR, NS, P>0.05, ***P<0.001 vs the control group, n=6. E, Representative image of the lanthanum nitrate perfusion experiment (bar=1 μm). F, Confocal immunofluorescence analysis of the expression and distribution of VE‐cadherin in CCMR vessels (bar=10 μm). CCMR indicates coronary collateral microcirculation reserve; DAPI, 40,6‐diamidino‐2‐phenylindole; NS, not significant; PEDF, pigment epithelium‐derived factor; VE‐cadherin, vascular endothelial‐cadherin.
PEDF Remodels the Nascent Blood Vessels In Vitro
An experimental protocol of HCAEC tube formation assay and cardiac explant Matrigel assay is shown in Figure 4A and 4B. We performed the tube formation assay with HCAEC to determine the relationship between PEDF and vascular remodeling. The results demonstrated that PEDF not only inhibits tube formation, but it also remodels the formed tubes (Figure 4C and 4D). After PEDF treatment, cumbersome cells were removed, and it was observed that the morphology of the tube significantly changed. Next, we established cardiac explant angiogenesis models using Matrigel. Unsurprisingly, light micrographs were acquired that showed the role of PEDF in inhibiting angiogenesis in the pre‐PEDF group. In the post‐PEDF group, we added PEDF 3 days after implantation when many nascent vessels had been generated (Figure 4B and 4E). We found that PEDF effectively remodels these immature, small, and messy nascent blood vessels (Day 6: 14.20±0.49% versus 33.45±2.01% [control], P<0.001) and drives selected vessels to be thicker, longer, and stronger (Day 6: 15.31±1.28 μm versus 6.93±0.67 μm [control], P<0.001) (Figure 4F and 4G).
Figure 4.

PEDF remodels nascent blood vessels in vitro. A and B, Experimental protocol of HCAEC tube formation assay and cardiac explant Matrigel assay. C, HCAEC tube formation in Matrigel in response to pre‐PEDF or to post‐PEDF. D, Percentage of area covered with tubes, *P<0.05, **P<0.01, ***P<0.001 vs the respective result of 12 hours, ### P<0.001 vs the indicated group, n=4 to 6 (bar=50 μm). E, Cardiac explant Matrigel assay. F, Quantification of density of area covered with nascent vessels, *P<0.05, ***P<0.001 vs the respective result of 3 days. ### P<0.001 vs the indicated group. G, Quantification of the average diameter of nascent vessels, *P<0.05, ***P<0.001, NS, P>0.05 vs the respective result of 3 days, ### P<0.001 vs the indicated group, n=6 (bar=50 μm). HCAEC indicates human coronary artery endothelial cells; NS, not significant; PEDF, pigment epithelium–derived factor.
PEDF Induces Increased Organization of Adherens Junctions on Membranes and Enhances Their Tolerance to Hypoxia in HCAEC Tubes
Immunofluorescence determination of the HCAEC tubes showed that the distribution of VE‐cadherin in the control group was disordered. PEDF remodels cumbersome ECs and was responsible for the regular, tight, and orderly assembly of VE‐cadherin (Figure 5A). In addition, PEDF treatment significantly reduced the expression of vegfr2 (0.51±0.02 versus 0.29±0.01 [control], P<0.001) and vegfr3 (0.40±0.02 versus 0.28±0.02 [control], P<0.01) and inhibited the proliferation of ECs (Figure 5A and 5B). The adherens junctions in the endothelium control vascular homeostasis. Thus, it is of interest to determine whether the vessels treated with PEDF have increased tolerance to hypoxia.
Figure 5.
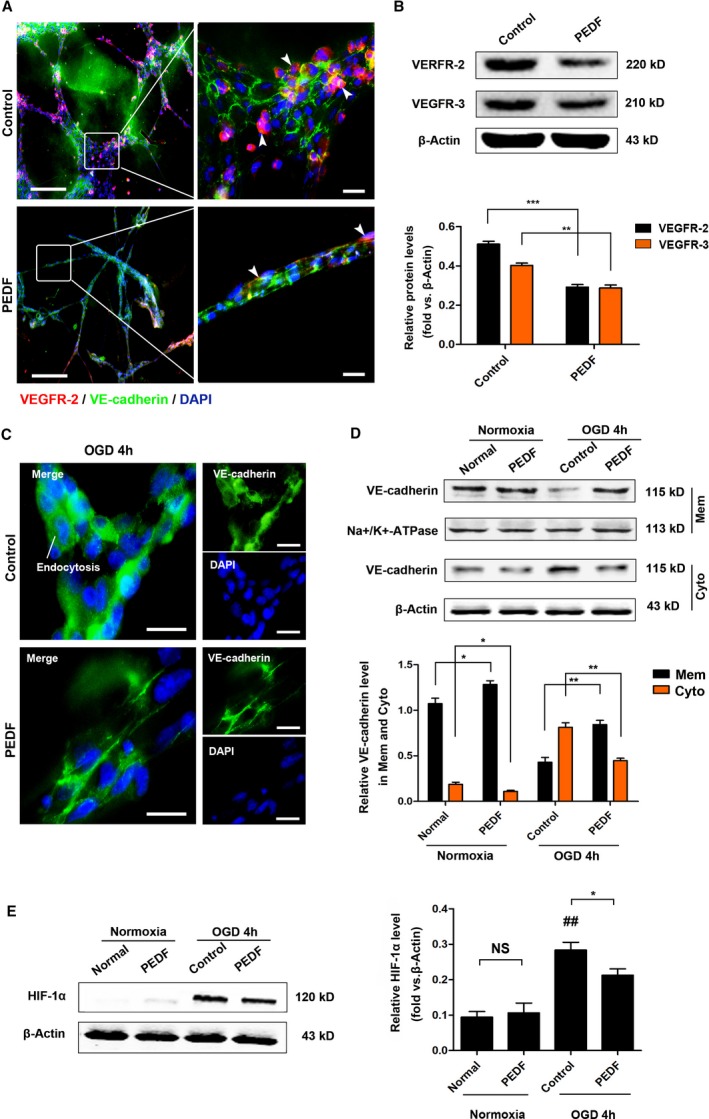
PEDF induces AJs that are better organized on membranes and enhanced their tolerance to hypoxia in HCAEC tubes. A, Representative immunofluorescence staining images of HCAEC tubes (bar=50 μm [left], bar=10 μm [right]). B, Western blot determination of VEGFR2 and VEGFR3 protein expression, **P<0.01, ***P<0.001 vs the indicated group. C, Immunofluorescence images of VE‐cadherin of HCAEC tubes (bar=10 μm). D, Western blot determination of VE‐cadherin in membrane and cytoplasm under normoxia or OGD, *P<0.05, **P<0.01 vs the indicated group, n=3. E, Verification of HIF‐1α expression, NS, P>0.05, *P<0.05 vs the indicated group, ## P<0.01 vs the normal group, n=5. AJs indicates adherens junctions; HCAEC, human coronary artery endothelial cells; HIF‐1α, hypoxia‐inducing factor‐1α; NS, not significant; OGD, glucose and oxygen deprivation; PEDF, pigment epithelium–derived factor; VE‐cadherin, vascular endothelial‐cadherin; VEGFR2, vascular endothelial growth factor receptor 2.
To address this, HCAEC tubes underwent OGD for 4 hours, and then the expression of VE‐cadherin in the membrane and cytoplasm was detected. We found that OGD for 4 hours led to severe VE‐cadherin endocytosis in the control group and significant reduction of VE‐cadherin endocytosis by PEDF (Figure 5C and 5D). We also detected the expression of hypoxia‐inducible factor‐1α in normoxic and OGD conditions, and the results demonstrated that PEDF effectively reduces the OGD‐induced increase in hypoxia‐inducible factor expression (0.21±0.01 versus 0.28±0.01 [control], P<0.05) (Figure 5E).
PEDF Induces Nascent Blood Vessel Remodeling That May Be Associated With the NO and Notch‐1 Pathways
From the above findings, we noted that the effects of PEDF on CCMR, HCAEC tubes, and nascent blood vessels were similar to those of the remodeling caused by FSS. Therefore, we made a reasonable inference: PEDF induces CCMR remodeling via activating some pathways regulated by FSS.
To corroborate this conjecture, we next set out to examine key potential regulators. Western blotting confirmed that PEDF reduces Ras expression in myocardial tissue but not for HCAECs, and the expression of Erk1 and Erk2 did not change. This result showed that PEDF‐induced vessel remodeling was independent of the Ras/Erk pathway, which is closely related to FSS. The Rho and AKT pathways have also been shown not to be activated by PEDF under normoxic conditions. Excitingly, examination of the Notch‐1 signaling cascade demonstrated somewhat increased Dll4 (heart tissue: 0.90±0.11 versus 0.62±0.09 [control], P<0.01; HCAEC: 0.95±0.13 versus 0.70±0.12 [control], P<0.05) and NICD (heart tissue: 0.58±0.08 versus 0.43±0.07 [control]; HCAEC: 0.65±0.11 versus 0.28±0.06 [control], P<0.01), suggesting increased Notch‐1 activation. We also found that PEDF significantly increased the expression of endothelial nitric oxide synthase in ECs (0.82±0.09 versus 0.58±0.05 [control], P<0.05) and myocardial tissue (1.09±0.11 versus 0.63±0.10 [control], P<0.01), which suggested that PEDF‐induced nascent blood vessel remodeling may be associated with the NO pathway (Figure 6A through 6C).
Figure 6.
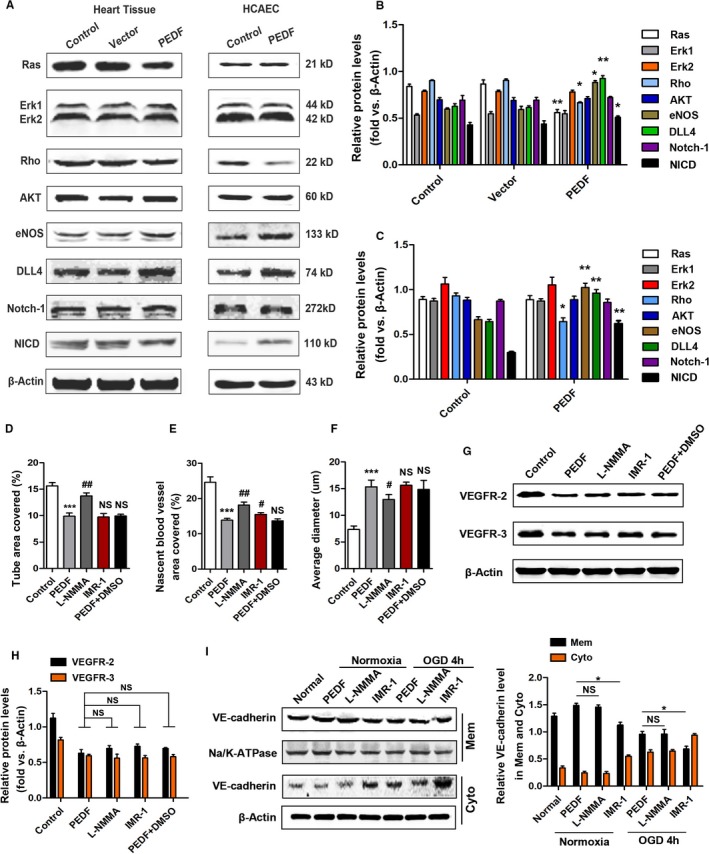
PEDF induces nascent blood vessel remodeling that may be associated with the NO and Notch‐1 pathway. A, Western blotting showing the levels of protein related to FSS in myocardial tissue and HCAECs. B, Quantitative analysis of protein levels in myocardial tissue, *P<0.05, **P<0.01, vs the control group, respectively. C, Quantitative analysis of protein levels in HCAECs, *P<0.05, **P<0.01, vs the control group, respectively. D, HCAEC tube formation in Matrigel in response to IMR‐1 or l‐NMMA, ***P<0.001 vs the control group, ## P<0.01, NS, P>0.05 vs the PEDF group, n=6. E, Quantification of the nascent vessel area, ***P<0.001 vs the control group, # P<0.05, ## P<0.01, NS, P>0.05 vs the PEDF group, n=6. F, Quantification of the average diameter, ***P<0.001 vs the control group, # P<0.05, NS, P>0.05 vs the PEDF group, n=6. G, Western blot determination of VEGFR2 and VEGFR3 protein. H, Quantification of VEGFR2 and VEGFR3 protein levels, NS, P>0.05 vs the indicated group, n=5. I, Western blot determination of VE‐cadherin in membrane and cytoplasm in response to IMR‐1 or l‐NMMA, *P<0.05, NS, P>0.05 vs the indicated group, n=5. FSS indicates fluid shear force; HCAEC, human coronary artery endothelial cells; IMR‐1, inhibitor of mastermind recruitment‐1; l‐NMMA, l‐nitromonomethylarginine; NS, not significant; PEDF, pigment epithelium–derived factor; VEGFR2/3, vascular endothelial growth factor receptor 2/3.
l‐Nitromonomethylarginine acetate, which inhibits endothelial nitric oxide synthase (NOS1, NOS, and NOS3), effectively blocked the remodeling activity of PEDF in HCAEC tubes and nascent vessels (tube area: 13.75±0.55% versus 9.89±0.60% [PEDF], P<0.01; nascent vessel area: 18.15±0.86 versus 13.88±0.51 [PEDF], P<0.01; diameter: 12.04±0.64 versus 15.81±1.08 [PEDF], P<0.05) (Figure 6D through 6F). Western blot analysis showed that l‐nitromonomethylarginine had little effect on the regulation of EC proliferation and VE‐cadherin assembly by PEDF (Figure 6G through 6I). Inhibitor of mastermind recruitment‐1 (IMR‐1) is an inhibitor from a novel class of Notch inhibitors targeting transcriptional activation with an IC50 of 6 μmol/L. We found that IMR‐1 almost completely blocked the positive effects of PEDF on promoting the transfer and assembly of VE‐cadherin on membranes (Mem: 0.68±0.09 versus 0.99±0.07 [PEDF], P<0.05) (Figure 6I). However, IMR‐1 did not affect other activities of PEDF in this study.
In addition, under normoxic conditions, PEDF did not affect the production of mitochondrial reactive oxygen species or the activity of NO in ECs. In other words, there was no connection between the remodeling of collateral vessels induced by PEDF and oxidative stress (Figure 7).
Figure 7.
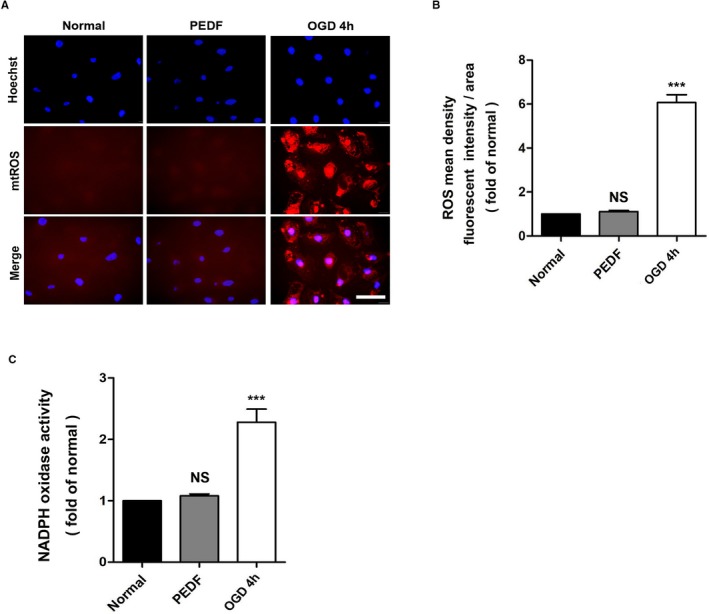
Oxidative stress does not participate in the collateral remodeling induced by PEDF. A, mtROS production was monitored by MitoSOX™ Red in HCAECs, with (B) quantification. ROS production was observed by red fluorescence of MitoSOX™ by fluorescence microscopy and analyzed by Image‐Pro Plus software (scale bar=50 μm; n=5). C, NOX activity was assessed in all experimental groups using the NOX activity assay kit (n=5). ***P<0.001, NS, P>0.05 vs the normal group. HCAEC indicates human coronary artery endothelial cells; NOX, NADPH oxidase; NS, not significant; OGD, oxygen‐glucose deprivation; PEDF, pigment epithelium–derived factor; ROS, reactive oxygen species.
Discussion
The major finding in this study is that PEDF induces the remodeling of the native collateral circulation in a manner similar to that of FSS. PEDF remodels the immature CCMR, expands the diameter, and promotes native collateral blood flow in the early stage of AMI. It also contributes to improving cardiac function, reducing infarct size, and promoting ventricular remodeling in the late stage of AMI, which may occur by promoting NO release and activating the Notch‐1 signaling pathway of the CCMR. During in vitro experiments, we observed that PEDF induced tube formation by HCAECs and nascent blood vessel remodeling and enhanced EC tolerance to hypoxia injury, which mimics the actions of PEDF on native collaterals.
In our previous studies, we found that the protective effects of PEDF on cardiomyocytes and vascular ECs during AMI were usually triggered by ischemic or hypoxic events. PEDF inhibits OGD‐induced oxidative stress in H9c2 cells, improves cardiac function in rats with AMI via inhibiting vascular permeability and cardiomyocyte apoptosis, and inhibits angiogenesis in the heart.26, 27, 28, 29, 30, 31 The stimulation of CCMR remodeling in the absence of ischemia was surprising, because we had predicted that PEDF would not affect coronary collateral growth in the absence of ischemia. The observation that PEDF increases the release of NO and upregulates the activity of notch1/NO in ECs in the normoxic state helped us to resolve the dilemma.
In this study, we found that PEDF significantly promoted the native collateral blood flow after AMI and improved the prognosis. It is emphasized that PEDF does not accomplish this by inducing collateral proliferation. After 2 weeks of PEDF treatment, the CCMR decreased by ≈60%, the average diameter increased 1.5 to 2 times, and the defective adherens junction was reassembled. Intriguingly, the transformations of the CCMR induced by PEDF coincide with the shearing and remodeling of collateral vessels driven by FSS in outcomes. During AMI, the sudden decrease in peripheral pressure after an arterial occlusion leads to blood flow and FSS in collateral. Numerous studies have documented the influence of FSS as an arterial molding force.21, 32, 33 FSS leads to the elimination of most native collateral vessels and nascent collaterals that had initially participated in the growth transformation in favor of a few large ones, which is known as “pruning.”34, 35 Studies of large and small arteries indicate that acute flow‐induced dilation is mediated by the endothelial release of NO.36 Therefore, we further detected the effects of PEDF on NO in ECs, nascent vessels, and rat myocardial tissue.
Our results demonstrated that PEDF increases the expression of endothelial nitric oxide synthase and promotes the production of NO in endothelial cells. l‐Nitromonomethylarginine completely blocked the shearing effects of PEDF. However, further studies are required to fully explore the detailed mechanisms of PEDF‐induced collateral remodeling involved in the NO and Notch‐1 signaling pathways. In this study, some signaling pathways closely related to FSS, such as the Ras, Akt, and Rho pathways, and regulation of oxidative stress, do not participate in PEDF‐induced collateral remodeling.
Arteriogenesis is frequently used in colloquial terms to represent an expansion of pre‐existing collaterals that is triggered by ischemia.32, 37 Compared with angiogenesis, arteriogenesis is accompanied by lumen enlargement and wall thickening (smooth‐muscle proliferation).10, 38 It provides more blood flow and has the capacity to compensate for an occluded artery. However, because of the rapid increase in collateral diameter by cellular proliferation, FSS quickly decreases again. Thus, premature normalization of FSS limits the role of arteriogenesis.32 Different from arteriogenesis, PEDF does not induce the CCMR to produce smooth muscle that turns into arterioles.
Regardless of whether arteriogenesis or angiogenesis is triggered by ischemia, these processes are too time‐consuming for effective repair after AMI. The extent of native collateral flow directly determines the outcome of AMI. Our previous study showed that the native collateral flow is relatively abundant when it is initially recruited because of the CCMR.24 However, a short‐lived CCMR leads to a decrease in collateral blood flow that is subsequently unable to continuously support the ischemic myocardium. Here, we found that 2 weeks of PEDF treatment resulted in the remodeling of CCMR in the absence of ischemia. When AMI occurs, abundant native collateral blood flow enables sufficient support of the ischemic myocardium and effectively reduces infarct size and improves prognosis. Our present and previous findings support the hypothesis that promoting native collateral remodeling will effectively increase the compensatory blood flow and reduce the adverse effects of ischemic events, and it offers a practical approach for this promising novel therapeutic method for AMI.
Sources of Funding
This work was supported by grants from the National Nature Science Foundation of China (81570242 and 81270173) and Natural Science Foundation of Jiangsu Province (BK20150207).
Disclosures
None.
(J Am Heart Assoc. 2019;8:e013323 DOI: 10.1161/JAHA.119.013323.)
References
- 1. Schaper W, Ito WD. Molecular mechanisms of coronary collateral vessel growth. Circ Res. 1996;79:911–919. [DOI] [PubMed] [Google Scholar]
- 2. Piek JJ, van Liebergen RA, Koch KT, Peters RJ, David GK. Clinical, angiographic and hemodynamic predictors of recruitable collateral flow assessed during balloon angioplasty coronary occlusion. J Am Coll Cardiol. 1997;29:275–282. [DOI] [PubMed] [Google Scholar]
- 3. Pung YF, Sam WJ, Hardwick JP, Yin L, Ohanyan V, Logan S, Di Vincenzo L, Chilian WM. The role of mitochondrial bioenergetics and reactive oxygen species in coronary collateral growth. Am J Physiol Heart Circ Physiol. 2013;305:H1275–H1280. [DOI] [PMC free article] [PubMed] [Google Scholar]
- 4. Seiler C, Engler R, Berner L, Stoller M, Meier P, Steck H, Traupe T. Prognostic relevance of coronary collateral function: confounded or causal relationship? Heart. 2013;99:1408–1414. [DOI] [PubMed] [Google Scholar]
- 5. Seiler C, Stoller M, Pitt B, Meier P. The human coronary collateral circulation: development and clinical importance. Eur Heart J. 2013;34:2674–2682. [DOI] [PubMed] [Google Scholar]
- 6. Habib GB, Heibig J, Forman SA, Brown BG, Roberts R, Terrin ML, Bolli R. Influence of coronary collateral vessels on myocardial infarct size in humans. Results of phase I thrombolysis in myocardial infarction (TIMI) trial. The TIMI Investigators. Circulation. 1991;83:739–746. [DOI] [PubMed] [Google Scholar]
- 7. Sherman JA, Hall A, Malenka DJ, De Muinck ED, Simons M. Humoral and cellular factors responsible for coronary collateral formation. Am J Cardiol. 2006;98:1194–1197. [DOI] [PubMed] [Google Scholar]
- 8. Grundmann S, Piek JJ, Pasterkamp G, Hoefer IE. Arteriogenesis: basic mechanisms and therapeutic stimulation. Eur J Clin Invest. 2007;37:755–766. [DOI] [PubMed] [Google Scholar]
- 9. Schirmer SH, van Nooijen FC, Piek JJ, van Royen N. Stimulation of collateral artery growth: travelling further down the road to clinical application. Heart. 2009;95:191–197. [DOI] [PubMed] [Google Scholar]
- 10. Chilian WM, Penn MS, Pung YF, Dong F, Mayorga M, Ohanyan V, Logan S, Yin L. Coronary collateral growth—back to the future. J Mol Cell Cardiol. 2012;52:905–911. [DOI] [PMC free article] [PubMed] [Google Scholar]
- 11. Emanueli C, Madeddu P. Angiogenesis gene therapy to rescue ischaemic tissues: achievements and future directions. Br J Pharmacol. 2001;133:951–958. [DOI] [PMC free article] [PubMed] [Google Scholar]
- 12. Simons M, Bonow RO, Chronos NA, Cohen DJ, Giordano FJ, Hammond HK, Laham RJ, Li W, Pike M, Sellke FW, Stegmann TJ, Udelson JE, Rosengart TK. Clinical trials in coronary angiogenesis: issues, problems, consensus: an expert panel summary. Circulation. 2000;102:E73–E86. [DOI] [PubMed] [Google Scholar]
- 13. Jadhav R, Dodd T, Smith E, Bailey E, Delucia AL, Russell JC, Madison R, Potter B, Walsh K, Jo H, Rocic P. Angiotensin type I receptor blockade in conjunction with enhanced Akt activation restores coronary collateral growth in the metabolic syndrome. Am J Physiol Heart Circ Physiol. 2011;300:H1938–H1949. [DOI] [PMC free article] [PubMed] [Google Scholar]
- 14. Weihrauch D, Tessmer J, Warltier DC, Chilian WM. Repetitive coronary artery occlusions induce release of growth factors into the myocardial interstitium. Am J Physiol. 1998;275:H969–H976. [DOI] [PubMed] [Google Scholar]
- 15. Losordo DW, Vale PR, Isner JM. Gene therapy for myocardial angiogenesis. Am Heart J. 1999;138:S132–S141. [DOI] [PubMed] [Google Scholar]
- 16. Wang S, Zhang H, Dai X, Sealock R, Faber JE. Genetic architecture underlying variation in extent and remodeling of the collateral circulation. Circ Res. 2010;107:558–568. [DOI] [PMC free article] [PubMed] [Google Scholar]
- 17. Malek AM, Izumo S. Mechanism of endothelial cell shape change and cytoskeletal remodeling in response to fluid shear stress. J Cell Sci. 1996;109(Pt 4):713–726. [DOI] [PubMed] [Google Scholar]
- 18. Unthank JL, Fath SW, Burkhart HM, Miller SC, Dalsing MC. Wall remodeling during luminal expansion of mesenteric arterial collaterals in the rat. Circ Res. 1996;79:1015–1023. [DOI] [PubMed] [Google Scholar]
- 19. Kamiya A, Togawa T. Adaptive regulation of wall shear stress to flow change in the canine carotid artery. Am J Physiol. 1980;239:H14–H21. [DOI] [PubMed] [Google Scholar]
- 20. Sorrells SF, Paredes MF, Cebrian‐Silla A, Sandoval K, Qi D, Kelley KW, James D, Mayer S, Chang J, Auguste KI, Chang EF, Gutierrez AJ, Kriegstein AR, Mathern GW, Oldham MC, Huang EJ, Garcia‐Verdugo JM, Yang Z, Alvarez‐Buylla A. Human hippocampal neurogenesis drops sharply in children to undetectable levels in adults. Nature. 2018;555:377–381. [DOI] [PMC free article] [PubMed] [Google Scholar]
- 21. Eitenmuller I, Volger O, Kluge A, Troidl K, Barancik M, Cai WJ, Heil M, Pipp F, Fischer S, Horrevoets AJ, Schmitz‐Rixen T, Schaper W. The range of adaptation by collateral vessels after femoral artery occlusion. Circ Res. 2006;99:656–662. [DOI] [PubMed] [Google Scholar]
- 22. Castier Y, Brandes RP, Leseche G, Tedgui A, Lehoux S. p47phox‐dependent NADPH oxidase regulates flow‐induced vascular remodeling. Circ Res. 2005;97:533–540. [DOI] [PubMed] [Google Scholar]
- 23. Lehoux S, Tronc F, Tedgui A. Mechanisms of blood flow‐induced vascular enlargement. Biorheology. 2002;39:319–324. [PubMed] [Google Scholar]
- 24. Liu X, Dong H, Huang B, Miao H, Xu Z, Yuan Y, Qiu F, Chen J, Zhang H, Liu Z, Quan X, Zhu L, Zhang Z. Native coronary collateral microcirculation reserve in rat hearts. J Am Heart Assoc. 2019;8:e011220 DOI: 10.1161/JAHA.118.011220. [DOI] [PMC free article] [PubMed] [Google Scholar]
- 25. He X, Cheng R, Benyajati S, Ma JX. PEDF and its roles in physiological and pathological conditions: implication in diabetic and hypoxia‐induced angiogenic diseases. Clin Sci (Lond). 2015;128:805–823. [DOI] [PMC free article] [PubMed] [Google Scholar]
- 26. Qiu F, Zhang H, Yuan Y, Liu Z, Huang B, Miao H, Liu X, Zhao Q, Zhang H, Dong H, Zhang Z. A decrease of ATP production steered by PEDF in cardiomyocytes with oxygen‐glucose deprivation is associated with an AMPK‐dependent degradation pathway. Int J Cardiol. 2018;257:262–271. [DOI] [PubMed] [Google Scholar]
- 27. Zhang H, Pan J, Qiu F, Wei T, Wei T, Li Z, Jiang X, Zhuang W, Liu Z, Zhang Z, Dong H. A novel modified physiologically relevant model for cardiac angiogenesis. Microvasc Res. 2017;14:84–91. [DOI] [PubMed] [Google Scholar]
- 28. Zhao Q, Liu Z, Huang B, Yuan Y, Liu X, Zhang H, Qiu F, Zhang Y, Li Y, Miao H, Dong H, Zhang Z. PEDF improves cardiac function in rats subjected to myocardial ischemia/reperfusion injury by inhibiting ROS generation via PEDFR. Int J Mol Med. 2018;41:3243–3252. [DOI] [PMC free article] [PubMed] [Google Scholar]
- 29. Zhang H, Wei T, Jiang X, Li Z, Cui H, Pan J, Zhuang W, Sun T, Liu Z, Zhang Z, Dong H. PEDF and 34‐mer inhibit angiogenesis in the heart by inducing tip cells apoptosis via up‐regulating PPAR‐gamma to increase surface FasL. Apoptosis. 2016;21:60–68. [DOI] [PubMed] [Google Scholar]
- 30. Zhang H, Wang Z, Feng SJ, Xu L, Shi HX, Chen LL, Yuan GD, Yan W, Zhuang W, Zhang YQ, Zhang ZM, Dong HY. PEDF improves cardiac function in rats with acute myocardial infarction via inhibiting vascular permeability and cardiomyocyte apoptosis. Int J Mol Sci. 2015;16:5618–5634. [DOI] [PMC free article] [PubMed] [Google Scholar]
- 31. Miao H, Qiu F, Huang B, Liu X, Zhang H, Liu Z, Yuan Y, Zhao Q, Zhang H, Dong H, Zhang Z. PKCalpha replaces AMPK to regulate mitophagy: another PEDF role on ischaemic cardioprotection. J Cell Mol Med. 2018;22:5732–5742. [DOI] [PMC free article] [PubMed] [Google Scholar]
- 32. Schaper W, Scholz D. Factors regulating arteriogenesis. Arterioscler Thromb Vasc Biol. 2003;23:1143–1151. [DOI] [PubMed] [Google Scholar]
- 33. Pipp F, Boehm S, Cai WJ, Adili F, Ziegler B, Karanovic G, Ritter R, Balzer J, Scheler C, Schaper W, Schmitz‐Rixen T. Elevated fluid shear stress enhances postocclusive collateral artery growth and gene expression in the pig hind limb. Arterioscler Thromb Vasc Biol. 2004;24:1664–1668. [DOI] [PubMed] [Google Scholar]
- 34. Hacking WJ, VanBavel E, Spaan JA. Shear stress is not sufficient to control growth of vascular networks: a model study. Am J Physiol. 1996;270:H364–H375. [DOI] [PubMed] [Google Scholar]
- 35. Schaper W. Collateral circulation: past and present. Basic Res Cardiol. 2009;104:5–21. [DOI] [PMC free article] [PubMed] [Google Scholar]
- 36. Zhang J, Han Y, Wang Y, Cheng X, Wang CJ. Neuronal nitric oxide synthase inhibition reduces brain damage by promoting collateral recruitment in a cerebral hypoxia‐ischemia mice model. Eur Rev Med Pharmacol Sci. 2018;22:3166–3172. [DOI] [PubMed] [Google Scholar]
- 37. Carmeliet P. Mechanisms of angiogenesis and arteriogenesis. Nat Med. 2000;6:389–395. [DOI] [PubMed] [Google Scholar]
- 38. Carmeliet P. VEGF gene therapy: stimulating angiogenesis or angioma‐genesis? Nat Med. 2000;6:1102–1103. [DOI] [PubMed] [Google Scholar]