

Abstract
Background
Chronic chagasic cardiomyopathy (CCC), caused by Trypanosoma cruzi infection, is an important public health problem attributable to progressive cardiomyopathy in patients, for which there is no cure. Chronic chagasic cardiomyopathy is characterized by myocarditis and cardiac fibrosis, which leads to life‐threatening arrhythmogenic and circulatory abnormalities. This study aimed to investigate cardiac fibrosis progression in a mouse model of chronic chagasic cardiomyopathy.
Methods and Results
Cardiac cells infected with T cruzi produced significantly higher concentrations of transforming growth factor‐β (TGF‐β), connective tissue growth factor, endothelin‐1, and platelet‐derived growth factor‐D than noninfected controls. Female Balb/c mice infected with T cruzi were compared with naïve mice. TGF‐β genes and other TGF‐β superfamily genes, as well as connective tissue growth factor, endothelin‐1, and platelet‐derived growth factor, were upregulated in infected mouse hearts. Serum concentrations of TGF‐β, connective tissue growth factor, and platelet‐derived growth factor‐D were higher in infected mice and correlated with cardiac fibrosis. Strain analysis performed on magnetic resonance images at 111 and 140 days postinfection and echocardiography images at 212 days postinfection revealed significantly elevated left ventricular strain and cardiac fibrosis and concomitantly significantly decreased cardiac output in infected mice.
Conclusions
TGF‐β, connective tissue growth factor and platelet‐derived growth factor‐D are potentially useful biomarkers of cardiac fibrosis, as they correlate with cardiac fibrosis. Strain analysis allows for use of noninvasive methods to measure fibrosis in the chronic stages of chagasic cardiomyopathy in a mouse model. These findings can be applied as noninvasive tools to study the effects of interventions and/or therapeutics on cardiac fibrosis development when using a mouse model of chronic chagasic cardiomyopathy.
Keywords: cardiac remodeling, echocardiography, Chagas heart failure
Subject Categories: Heart Failure, Magnetic Resonance Imaging (MRI), Echocardiography, Animal Models of Human Disease, Biomarkers
Clinical Perspective
What Is New?
This study describes transforming growth factor‐β, connective tissue growth factor, and platelet‐derived growth factor‐D as potentially useful biomarkers of cardiac fibrosis, which are induced by chronic infection with Trypanosoma cruzi.
Cardiac strain analysis with either magnetic resonance imaging or echocardiography can analyze cardiac fibrosis in vivo in the chronic stages of chagasic cardiomyopathy and is a more sensitive tool for measurement of cardiac dysfunction than traditional cardiac imaging parameters, including ejection fraction.
What Is the Clinical Perspective?
Transforming growth factor‐β, connective tissue growth factor, and platelet‐derived growth factor‐D are profibrotic biomarkers that represent treatment targets to specifically address cardiac fibrosis in chronic chagasic cardiomyopathy, as well as a means to monitor cardiac fibrosis signaling.
Profibrotic biomarkers have the potential to enhance the characterization and assessment of cardiomyopathy development in chronic chagasic cardiomyopathy, in addition to traditional cardiac biomarkers, such as troponin and natriuretic peptides.
Cardiac strain analysis is a sensitive method to acquire longitudinal measurements in the same animal, which is not possible with the traditional method of measuring fibrosis on histopathology, and will have many applications in monitoring disease progression and analysis of therapeutic and preventative treatments.
Introduction
Chagas disease is a neglected tropical disease caused by infection with the parasite Trypanosoma cruzi that currently affects an estimated 6 to 7 million people.1, 2 Following T cruzi infection, patients typically enter an asymptomatic (or indeterminate) phase. Approximately 30% of indeterminate patients will eventually progress to the chronic cardiomyopathy stage of Chagas disease, also known as chronic chagasic cardiomyopathy (CCC).3 Patients with CCC can experience fatal arrhythmias or develop progressive heart failure, characterized by heart failure symptoms at a less‐than‐ordinary level of physical activity and the presence of heart failure symptoms at rest, respectively.4 The World Health Organization estimates that >1 million people suffer from CCC.1
There is a need to improve the diagnosis and treatment of CCC. Some risk factors for patients with Chagas disease who develop CCC have been identified. However, there are currently no reliable biomarkers for predicting its onset.5 Moreover, the current treatment for patients with CCC is mainly palliative and includes medical management with angiotensin‐converting enzyme inhibitors, β‐blockers, digoxin, antiarrhythmics, pacemaker implantation or heart transplant, and antiparasitic treatment with benznidazole and nifurtimox.6 Parasite‐specific treatment, while reducing parasitemia, does not have an effect on the progression of cardiomyopathy.7
Cardiac fibrosis is the signature lesion in the hearts of patients with CCC, so understanding the sequence of events leading to fibrosis is fundamental to elucidating the pathogenesis of this condition. Fibrosis is also the most important predictive variable for the presence of ventricular arrhythmia.8, 9 The discovery of specific cytokines or chemical mediators that lead to cardiac fibrosis might also help to identify new biomarkers or diagnostic tools for CCC, especially for resource‐poor areas where cardiac imaging is not readily accessible. Revealing these chemical mediators might also help to shape a road map toward discovering new therapeutics for CCC. For example, noninfectious models of cardiac disease have identified several signaling molecules integral to the profibrotic pathway in the heart, including transforming growth factor‐β (TGF‐β), connective tissue growth factor (CTGF), endothelin‐1 (ET‐1), and platelet‐derived growth factor (PDGF). Inhibition of these factors or treatments that block these factors significantly reduce fibrosis signaling and development in other models of cardiac fibrosis.10, 11, 12, 13, 14, 15, 16, 17, 18, 19, 20, 21, 22
Our overall goal is to develop both in vitro and in vivo (animal model) approaches to studying the sequence of events leading to cardiac fibrosis in Chagas disease, with an aim to identify and develop biomarkers or potential treatment targets for CCC. The in vitro studies identified the participation of cardiac‐specific cell types and chemical mediators in fibrotic signaling, while the mouse model determines how these signaling events lead to the chronic phase of CCC in vivo. In addition, we correlated cardiac fibrosis with cardiac strain analysis of noninvasive cardiac imaging, including magnetic resonance imaging (MRI) and echocardiography. Visualizing progression of cardiac fibrosis will allow us to begin pairing imaging with signaling pathways.
Materials and Methods
Parasites and Lysate
T cruzi H1 strain, originally isolated from a human patient in Mexico,23 was used for infection studies. T cruzi TcI H1 strain blood‐form trypomastigotes were collected from the blood of infected Balb/c mice at peak parasitemia at 24 to 32 days postinfection (DPI), washed once with sterile phosphate buffered saline, then resuspended in appropriate cell culture media (Complete Cell Culture Media for cardiac cells, Complete Fibroblast Media for cardiac fibroblasts; Cell Biologics, Chicago, IL). Parasite lysate was generated from T cruzi TcI H1 strain epimastigotes that were grown from trypomastigotes in liver‐infusion tryptose medium at 28°C. The lysate was made using 10 million log phase epimastigotes with the cOmplete Lysis‐M kit (Sigma‐Aldrich, St. Louis, MO) according to the manufacturer's instructions, followed by 3 freeze‐thaw cycles. The lysate was sonicated for 15 seconds at the minimum setting 3 times to form a more homogenous lysate. The protein concentration of the lysate was quantified using the BCA protein assay kit (Thermo Fisher Scientific, Waltham, MA), following the manufacturer's instructions.
Cell and Animal Infections
Adult Balb/c mouse primary cardiac cells and cardiac fibroblasts (Cell Biologics, Chicago, IL) were cultured according to supplier guidelines and grown for 24 hours before infection. Cell cultures were washed once with phosphate buffered saline, then infected with blood‐form trypomastigotes suspended in appropriate medium at a multiplicity of infection of 3 blood‐form trypomastigotes per cell. Control cultures were grown in identical conditions but were treated with medium alone or 100 μg/mL of parasite lysate. Cell culture medium was replaced every 24 hours. Supernatant samples were collected during medium changes, at the following time points: 6 hours, 24 hours, 48 hours, and 72 hours after infection.
All experimental procedures using animals in this study were performed in compliance with the National Institutes of Health Guide for the Care and Use of Laboratory Animals, Eighth Edition, under a protocol reviewed and approved by the Baylor College of Medicine Institutional Animal Care and Use Committee (protocol no. AN‐5973).24 Two groups of BALB/c female mice, age 6 to 8 weeks (Taconic Biosciences, Rensselaer, NY) were injected intraperitoneally with 500 T cruzi H1 blood‐form trypomastigotes suspended in 0.1 mL of sterile saline (n=40) or sterile saline alone (n=10), as previously described.25 Mice were evaluated daily for systemic signs of disease, including ruffled coat, lethargy, hunched posture, dyspnea, and visible weight loss. These signs were used as end point determinants and mice that reach end point were humanely euthanized.
Successful infection was assessed by evaluation of parasitemia. Briefly, blood was collected via tail puncture at 28 DPI, total DNA was isolated using DNEasy blood and tissue kit (Qiagen, Hilden, Germany), and 10 ng DNA was used in quantitative real‐time polymerase chain reaction as previously described.25 Animal survival was also measured over the course of the infection. The mice were followed for 111, 140, and 209 DPI, with 1 cohort of mice (n=10–14) euthanized at each of these time points. Before euthanasia, these animals were imaged with cardiac MRI (111 and 140 DPI) and echocardiography (209 DPI). At each end point, hearts were collected and sections were flash frozen for real‐time polymerase chain reaction analysis and immersed in 10% neutral buffered formalin for histopathology processing and analysis. Serum from the mice collected at endpoint was immediately frozen for ELISA analysis. The infection timeline is illustrated in Figure 1.
Figure 1.
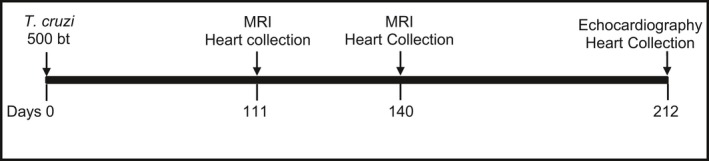
Timeline for experimental infection, anatomical real‐time cardiac magnetic resonance imaging (MRI), echocardiography, and cardiac tissue collection in a chronic chagasic mouse model. bt indicates blood‐form trypomastigotes.
Cardiac Imaging
Cardiac MRI
Mice were induced and maintained at a surgical plane of anesthesia with inhaled isoflurane and positioned in dorsal recumbency on a temperature‐regulated sled. Mice were monitored with a rectal thermometer, pneumatic pillow, and Doppler ECG with 2 leads to allow for gating for respiration and cardiac rhythm, which was controlled for optimum anesthetic depth at 315 to 350 bpm. A Bruker Advance 9.4 Tesla horizontal 20‐cm bore MRI scanner (Bruker Corporation, Billerica, MA) was used for image acquisition. Short‐axis images were obtained with a Bruker software package, Intragrate, of the left ventricle at the level of the papillary muscles with the following parameters: TE=2.5 ms, TR=8 ms, NEX=6. Tagged short‐axis images of the left ventricle were obtained with gating for respiration and heart rhythm, with 50 representative images obtained per animal, using the spatial modulation of magnetization technique. The field of view was 3 cm, the matrix was 256×256 with a slice thickness of 1 mm, resulting in an in‐plane spatial resolution of 117 micrometers. Images were analyzed with Myocardial Solutions (Morrisville, NC) software by harmonic‐phase analysis of tagged images to obtain measurements of circumferential strain of the left ventricle.
Echocardiography
Mice were anesthetized and positioned on a temperature‐regulated plate, as stated above. Fur from the entire ventral thorax was removed with motor trimmers. Mice were monitored with a rectal thermometer and Doppler ECG with 4 leads. Heart rate was maintained at 370 to 410 bpm to achieve appropriate anesthesia as a method of chemical restraint. Echocardiography was performed with Vevo 2100 imaging system (FUJIFILM VisualSonics, Inc, Toronto, Ontario, Canada) with a 40‐megahertz probe transducer. The sternum was coated with a layer of ultrasound gel and the left parasternal window was used to obtain both long‐ and short‐axis echocardiogram images of the left ventricle in B‐mode. M‐mode images were then obtained at the papillary level of the short‐axis view to determine systolic and diastolic chamber dimensions. The images were analyzed with VevoLab echocardiogram analysis software (FUJIFILM VisualSonics, Inc, Toronto, Ontario, Canada). The left ventricle dimensions were obtained from the M‐mode images to determine ejection fraction (EF), stroke volume, and cardiac output. Each measurement represents the mean of 15 cardiac cycles of identical projection, transducer position, and angle of frozen images. The short‐ and long‐axis left ventricle B‐mode images were analyzed using VevoStrain software (FUJIFILM VisualSonics, Inc, Toronto, Ontario, Canada), with each measurement representing 3 cardiac cycles per position. The short‐axis images were used to obtain circumferential strain. The long‐axis images were used to obtain longitudinal strain.
Cardiac Tissue Gene Expression Analysis
Cardiac tissues were processed using the RNeasy Mini kit (Qiagen, Hilden, Germany) to isolate and purify mRNA. cDNA synthesis was performed using the RT2 First Strand kit (Qiagen, Hilden, Germany). The cDNA (20 μg) was used in the RT2 Profiler PCR Array Mouse Fibrosis kit (Qiagen, Hilden, Germany; genes listed in Table S1) with SYBR Green RoxMastermix (Thermo Fisher Scientific, Waltham, MA). Gene expression was quantified and normalized against mouse housekeeping gene expression levels.
Measurement of Secreted Profibrotic Factors
Cell culture supernatants were tested for concentrations of TGF‐β, CTGF, PDGF‐D, and ET‐1 using ELISA kits (Thermo Fisher Scientific, Waltham, MA; G‐Biosciences, St. Louis, MO; Abclonal, Woburn, MA) according to manufacturers’ instructions. Two technical and biological replicates were measured for each factor analyzed. Serum harvested from infected mice was used to measure concentrations of TGF‐β, CTGF, PDGF‐D, and ET‐1 by ELISA (Thermo Fisher Scientific, Waltham, MA; G‐Biosciences, St. Louis, MO; Abclonal, Woburn, MA) according to manufacturers’ instructions. Three technical replicates were measured for each factor analyzed.
Histopathology of Cardiac Inflammation and Fibrosis
Cardiac tissue was removed from euthanized mice and immediately fixed in 10% formalin solution for histopathological analysis. The samples were dehydrated, embedded in paraffin, sectioned to 5 mL, fixed, and stained with hematoxylin‐eosin and Masson's trichrome for the quantification of inflammation and fibrosis, respectively.
Analysis of the stained sections was performed on 3 representative images of the left ventricle, at the basal, apical, and midventricular regions. Images of the sections were obtained with an AmScope ME580 bright field microscope (AmScope, Irvine, CA) equipped with LMPLAN40‐065 40X objective using an 18‐megapixel camera at fixed upper and lower light levels. The images were analyzed using ImageJ software (National Institutes of Health, Bethesda, MD) to obtain quantitative measurements of pixels corresponding to inflammation on the hematoxylin‐eosin–stained sections and fibrosis on the Masson's trichrome–stained sections. Three sampling areas per section were analyzed, with 2 sections per heart per mouse analyzed. Briefly, for total fibrosis and inflammation, a numerical value of the total myocardium and the fibrosis or inflammation volume were obtained. The fraction of total volume of fibrosis or inflammation per area of the myocardial section analyzed was calculated for each animal. Total myocardial area was quantified as the area of inflammation or fibrosis added to the area of myocardium (white background in the images was subtracted from total area).
Statistical Analysis
The in vitro profibrotic factor concentration measurements from cell culture supernatant were compared using 2‐way ANOVA with Tukey's correction for multiple comparisons. The Student t test was utilized for the remainder of the data to determine differences between the means of 2 groups for variables with normal distribution and homogenous variance. Correlation and linear regression were measured by using the least‐squares method, including multiple regression analysis. Analyses were performed using Prism software, version 8.0 (GraphPad Software, La Jolla, CA), with all differences between treatment groups considered significant if the P value was ≤5%.
Results
Infection and Mortality
Successful infection was measured by detecting T cruzi parasites in the blood at 28 DPI. All infected animals had positive parasitemia, while none of the control animals were found to have parasitemia. Infected groups had an overall mortality of 40% compared with 0% in uninfected age‐matched controls (Table S1). Mortality was higher in the acute phase of the disease (35%) than in the chronic phase (5%). Thus, a total of 20 animals (10 at each time point, with 4 uninfected control animals) underwent cardiac MRI at 111 and 140 DPI. A total of 14 animals at 209 DPI underwent echocardiography (10 infected and 4 naïve control mice).
Histopathological Findings
Analysis of the histopathological sections revealed progressive development of diffuse fibrosis in the cardiac tissue of the infected mice. Cardiac fibrosis was quantified as a total percentage of the heart tissue. Infected mice showed significant progressive cardiac fibrosis (Figure 2B), with an average of 4.2% at 111 days, increasing to 6.09% at 140 days and 10% at 212 DPI (Figure 2E).
Figure 2.
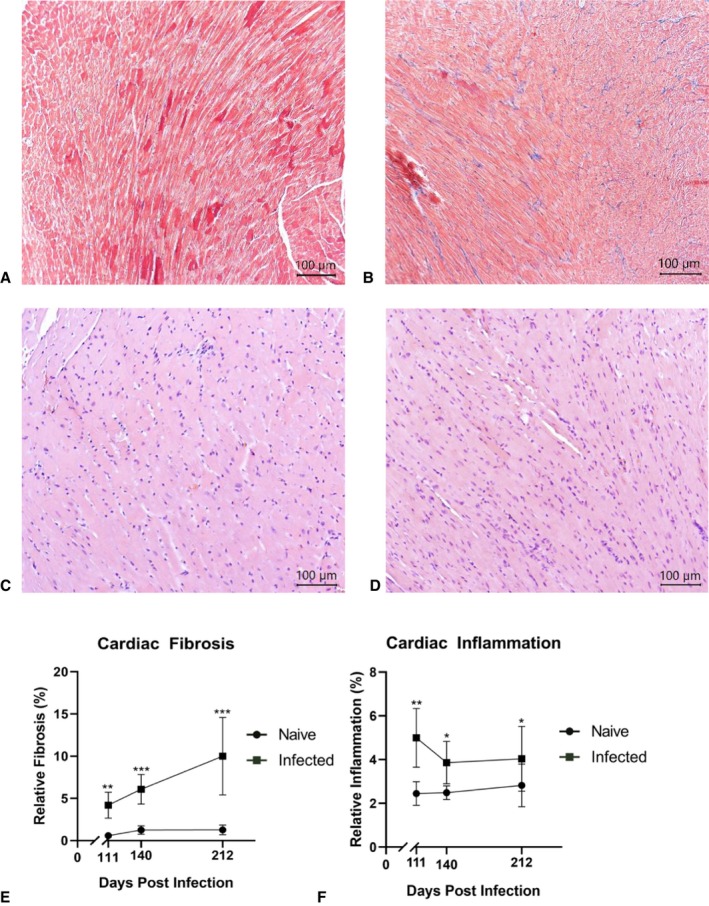
Cardiac tissue histopathology. Illustrative representations of histological sections stained with Masson's trichrome obtained from naïve control (A) and infected (B) mice at 140 days postinfection (DPI). Histological sections were stained with Masson's trichrome, with cardiac muscle appearing in red and collagen fibers (quantified for fibrosis), appearing in blue. Illustrative representations of histological sections stained with hematoxylin and eosin stain from naïve control (C) and infected (D) mice at 140 DPI. Histological sections were stained with hematoxylin and eosin (H&E), with cardiac muscle with this staining appears pink and the nuclei of infiltrating inflammatory cells appears purple. Each point represents the mean of all animal data (n=10–14). Longitudinal representation of the percentage of relative inflammation (E) and fibrosis (F) progression over the course of the infection timeline is shown. Data are plotted as mean±standard deviation (SD). *P<0.05, **P<0.01, ***P<0.001.
Cardiac inflammation was quantified as a total percentage of the heart tissue and found to be increased in the infected mice over time as infection progressed (Figure 2F). At 111 DPI, the infected group had significantly more inflammation, at 4.996%, than the control group, at 2.448%. At 140 DPI, the infected group was again found to have significantly more inflammation (Figure 2D), at 3.915%, than the naïve uninfected group, at 2.487%. At 212 DPI, the infected group was found to have significantly higher inflammation, with 4.057% total area, than the control group, at 2.821% total area. Inflammation in the infected groups decreased over the course of infection, from 4.996% at 111 DPI to 4.047% at 212 DPI.
Cardiac Tissue Fibrosis Gene Expression
Hearts collected at 140 DPI from infected and control mice were analyzed for expression of genes known to be associated with fibrosis in the mouse. Genes in the TGF‐β superfamily were found to be highly upregulated in infected cardiac tissue compared with naïve control cardiac tissue, ranging from 139.97‐ to 3630.62‐fold increases (Table 1). Growth factor genes were also found to be highly upregulated in infected cardiac tissue compared with naïve control cardiac tissue, including the following: CTGF, ET‐1, PDGF, hepatocyte growth factor, and vascular endothelial growth factor A (Table 1).
Table 1.
Cardiac Tissue Expression of Fibrosis Genes
| Gene | Fold Upregulation Infected/Control | Gene | Fold Upregulation Infected/Control |
|---|---|---|---|
| TGF‐β Superfamily | Growth Factors | ||
| Cav1 | 332.45 | Ctgf | 822.57 |
| Dcn | 593.46 | Edn1 | 241.69 |
| Grem1 | 625.56 | Pdgfa | 453.51 |
| Ltbp1 | 336.86 | Pdgfb | 2443.95 |
| Smad2 | 311.91 | Vegfa | 1342.77 |
| Smad3 | 665.36 | Hgf | 766.42 |
| Smad4 | 535.22 | ||
| Smad6 | 482.04 | ||
| Smad7 | 473.75 | ||
| Tgfb1 | 123.13 | ||
| Tgfb2 | 1705.52 | ||
| Tgfb3 | 615.24 | ||
| Tgfbr1 | 139.97 | ||
| Tgfbr2 | 176.31 | ||
| Tgif1 | 233.45 | ||
| Thbs1 | 3630.62 | ||
| Thbs2 | 2076.59 | ||
Shown are the fold changes in gene expression for genes belonging to the TGF‐β superfamily and growth factor group. Fibrosis Profile RT2 PCR panel was used to analyze the fold difference in gene expression between hearts from infected and naïve control mice. TGF‐β indicates transforming growth factor‐β.
Cardiac Cell Profibrotic Factors
TGF‐β was significantly elevated in cardiac cells at 24 hours after infection (Figure 3A) and at 6 and 24 hours after infection in cardiac fibroblasts (Figure 3B). CTGF was significantly elevated in cardiac cells and cardiac fibroblasts at 6 and 24 hours after infection (Figure 3C and 3D). PDGF‐D was significantly elevated in cardiac cells at 6 and 24 hours after infection (Figure 3E) and at 6 hours after infection in cardiac fibroblasts (Figure 3F). Significant elevations of ET‐1 were seen only in the supernatant of T cruzi–infected cardiac fibroblasts at 24, 48, and 72 hours postinfection (Figure 3H). Importantly, the only groups with elevations of any of these profibrotic factors were cells exposed to whole, live parasites, indicating the necessity of infection for these factors to be released from these cells in higher amounts. There were no significant differences in the concentrations of any of the factors between the cell groups treated with parasite lysate or medium alone at any time point.
Figure 3.
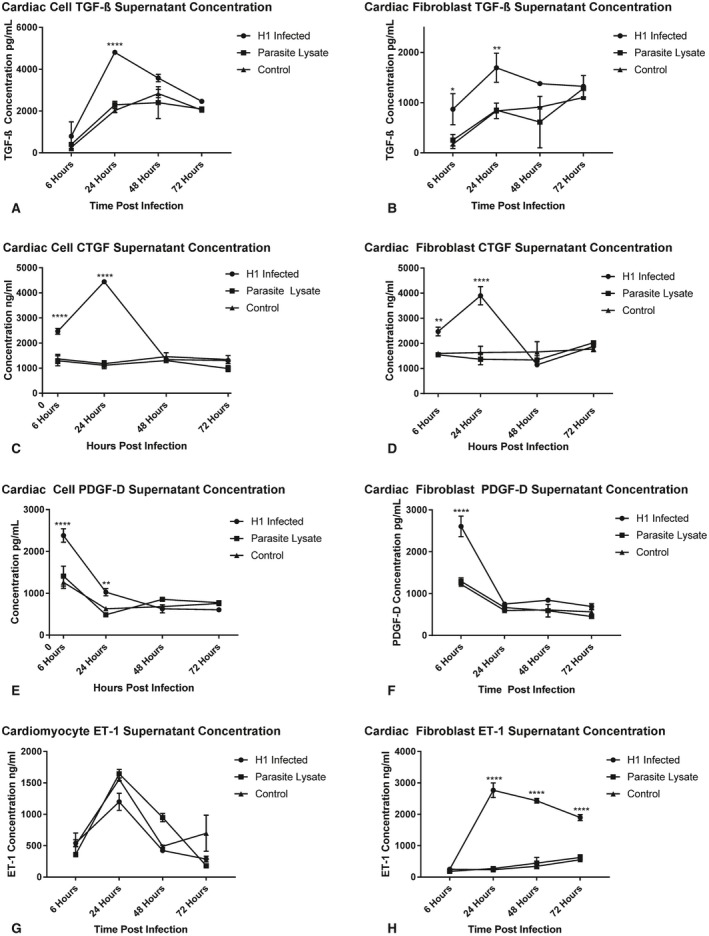
Profibrotic factor protein concentrations in supernatant of primary Balb/c cardiac cells and cardiac fibroblasts treated with T. cruzi TcI H1 blood‐form trypomastigotes (H1 infected), parasite lysate, or media alone (control) were measured with ELISA. Shown are the concentrations of transforming growth factor‐β (TGF‐β) in cardiac cells (A) and cardiac fibroblasts (B), connective tissue growth factor (CTGF) in cardiac cells (C) and cardiac fibroblasts (D), platelet‐derived growth factor‐D (PDGF‐D) in cardiac cells (E) and cardiac fibroblasts (F) and endothelin‐1 (ET‐1) in cardiac cells (G) and cardiac fibroblasts (H). Data are plotted as mean±SD. *P<0.05, **P<0.01, ****P<0.0001.
Fibrosis Biomarkers in a Mouse Model of CCC
The profibrotic factors elevated in the supernatant of infected cardiac cell cultures were measured in the serum of both chronically infected mice and naïve control mice. ET‐1 was not detectable in any of the serum samples collected from either infected or control mice (data not shown). TGF‐β was significantly elevated in the serum of infected mice at all time points, with the highest concentration at 140 DPI (Figure 4A). CTGF was significantly elevated in the serum of infected mice from 140 to 212 DPI, with the highest concentration at 212 DPI (Figure 4B). PDGF‐D was significantly elevated in the serum of infected mice at all time points, increasing at each time point to the highest concentration at 212 DPI (Figure 4C).
Figure 4.
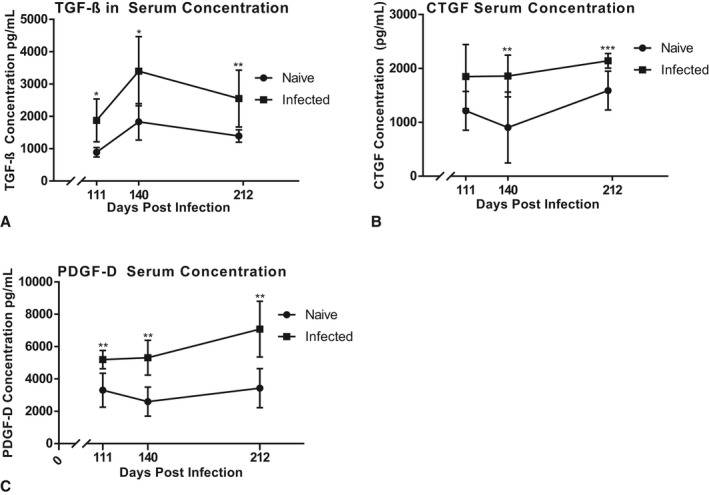
Profibrotic factor concentrations in mouse serum throughout CCC progression. Mice infected with T cruzi TcI H1 strain (infected) were compared with naïve control mice (naïve). Serum was collected at 111, 140, and 212 days postinfection (DPI) end points. Concentrations of transforming growth factor‐β (TGF‐β) (A), connective tissue growth factor (CTGF) (B), and platelet‐derived growth factor‐D (PDGF‐D) (C) were measured with ELISA. Data are plotted as mean±SD. *P<0.05, **P<0.01, ***P<0.001.
Cardiac Imaging
Analysis of LV Circumferential Strain MRI
Peak circumferential strain at 111 DPI was significantly greater in the infected group, at −7%, compared with the control group, at −13% (P=0.0276), illustrated in Figure 5A. The infected group at 140 DPI had significantly more strain, at −3.3%, than the control, at −8% (P=0.0001), illustrated in Figure 5A. No arrhythmias were seen during the MRI in any group at either time point.
Figure 5.
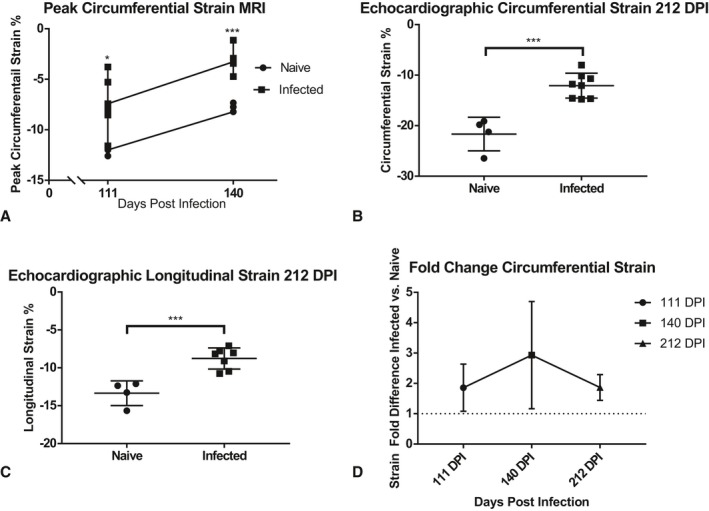
Left ventricle (LV) strain quantified from short‐axis magnetic resonance imaging (MRI) and short‐ and long‐axis echocardiography. Illustrated are individual values from global LV peak circumferential strain analysis measured on short‐axis cardiac MRI at 111 days postinfection (DPI) and 140 DPI (A). Short‐axis echocardiography images were used to determine circumferential strain (B), and long‐axis images were used to determine longitudinal strain (C) at 212 DPI. Each point represents an individual animal (n=10–14). Cardiac strain in infected animals was compared with naïve controls and the fold increase in strain is illustrated (D). Data are plotted as mean±SD. *P<0.05, ***P<0.001.
Analysis of Left Ventricular Endocardial Strain Echocardiography
Left ventricular (LV) strain was quantified with the short axis (circumferential strain) and longitudinal axis (longitudinal strain) echocardiography and compared between infected and control groups. Peak LV endocardial circumferential strain was significantly greater in the infected group, at −11%, than the control group, at −22% at 209 DPI (Figure 5B). Peak LV endocardial longitudinal strain (Figure 5C) was also significantly greater in the infected group, at −8.9%, than the control group, at −13.8% at 209 DPI (P=0.0008).
Infected animals exhibited a consistent elevation in circumferential strain (measured with MRI and echocardiography) compared with controls at all time points (Figure 5D), with a 1.86‐fold difference (average difference, 5.45%) at 111 DPI, 2.93‐fold difference (average difference, 4.61%) at 140 DPI and 1.87‐fold difference (average difference, 9.57%) at 212 DPI. No arrhythmias were seen during echocardiography in any group.
Analysis of LV Function
Quantitative analysis of short‐axis echocardiography was performed on echocardiography images from infected and control animals to determine EF and cardiac output. Overall EF in the infected group was not significantly different than EF in the naïve group, at 209 DPI (Figure 6A). However, 3 animals in the infected group (37.5%) had reduced EF (38.6%, 45.06%, 47.49%), compared with the mean of the control group (EF=53.01% ±5.138). Cardiac output was significantly lower in the infected group (Figure 6B), with an average of 12.66 mL/min, than the control group, with an average of 14.77 mL/min (P=0.0044). Reduction in cardiac output was not dependent on EF, as there was no significant difference between infected animals with or without reduced EF.
Figure 6.
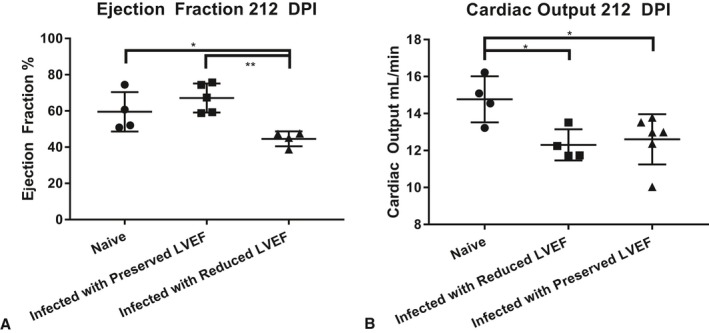
Individual measurements of left ventricle ejection fraction (LVEF) (A) and cardiac output (B) measured by M‐mode echocardiography at 209 days postinfection (DPI). Error bars represent SD. ***P<0.001.
Correlation Analysis
Serum concentrations of TGF‐β, CTGF, and PDGF‐D had a significant positive correlation with cardiac fibrosis measured with histopathology at all time points (Table 2). Serum concentrations of TGF‐β, CTGF, and PDGF‐D had a significant positive correlation with both circumferential and longitudinal cardiac strain measured with echocardiography at 212 DPI (Table 2). Serum concentration of CTGF was found to have a significant positive correlation with circumferential strain measured with MRI at 140 DPI (Table 2). Serum concentrations of TGF‐β, CTGF, and PDGF‐D had a significant negative correlation with cardiac output measured with echocardiography at 212 DPI (Table 2).
Table 2.
Correlation Analysis of Fibrosis Monitoring Methods
| Monitoring Method | Monitoring Method | Correlation Coefficient (r) 111 DPI | Correlation Coefficient (r) 140 DPI | Correlation Coefficient (r) 212 DPI |
|---|---|---|---|---|
| Serum TGF‐β | Cardiac fibrosis | 0.8303* | 0.8156* | 0.8400** |
| Serum TGF‐β | Circumferential strain | 0.433 | 0.5334 | 0.7249* |
| Serum TGF‐β | Longitudinal strain | ND | ND | 0.7108*** |
| Serum TGF‐β | Cardiac output | ND | ND | −0.7969* |
| Serum CTGF | Cardiac fibrosis | 0.7916* | 0.8675* | 0.7785* |
| Serum CTGF | Circumferential strain | 0.5278 | 0.4982 | 0.8688** |
| Serum CTGF | Longitudinal strain | ND | ND | 0.676*** |
| Serum CTGF | Cardiac output | ND | ND | −0.6935*** |
| Serum PDGF‐D | Cardiac fibrosis | 0.8940** | 0.8710* | 0.9114**** |
| Serum PDGF‐D | Circumferential strain | 0.625 | 0.6236 | 0.619*** |
| Serum PDGF‐D | Longitudinal strain | ND | ND | 0.9013** |
| Serum PDGF‐D | Cardiac output | ND | ND | −0.6892*** |
| Cardiac fibrosis | MRI circumferential strain | 0.7635** | 0.8273* | ND |
| Cardiac fibrosis | Echocardiography circumferential strain | ND | ND | 0.9193**** |
| Cardiac fibrosis | Echocardiography longitudinal strain | ND | ND | 0.8721** |
| Cardiac fibrosis | Ejection fraction | ND | ND | −0.6193 |
| Cardiac fibrosis | Cardiac output | ND | ND | −0.8215* |
| Cardiac output | Cardiac inflammation | ND | ND | −0.1912 |
| Cardiac output | Echocardiography circumferential strain | ND | ND | −0.8365** |
| Cardiac output | Echocardiography longitudinal strain | ND | ND | −0.8387* |
Histopathology images were used to quantify cardiac fibrosis and inflammation. Fibrosis biomarker levels were measured in the serum of mice by ELISA. Cardiac strain was measured from magnetic resonance and echocardiography imaging. Cardiac output and ejection fraction were measured from echocardiography imaging. Shown are the correlative coefficients and significance of the correlations. Correlations not performed are labeled ND. CTGF indicates connective tissue growth factor; DPI, days postinfection; PDGF‐D, platelet‐derived growth factor‐D; TGF‐β, transforming growth factor‐β.
*P<0.01, **P<0.001, ***P<0.05, ****P<0.0001.
Peak LV circumferential strain measured with MRI was significantly correlated to relative fibrosis measured on histopathology (Table 2). Correlation between the 2 measurements was stronger at 140 DPI than 111 DPI.
LV endocardial circumferential strain measured with echocardiography had a significant positive correlation with fibrosis quantified on histopathology. LV endocardial longitudinal strain measured with echocardiography had a strong, significant positive correlation with fibrosis quantified on histopathology (Table 2).
Cardiac output had a significant negative correlative relationship with cardiac fibrosis. LV endocardial circumferential strain measured with echocardiography had a significant positive correlation with fibrosis quantified on histopathology. LV endocardial longitudinal strain measured with echocardiography had a strong, significant positive correlation with fibrosis quantified on histopathology (Table 2).
Because of the findings that cardiac inflammation was significantly increased in infected mice relative to controls, the correlative relationship between cardiac inflammation and cardiac output measured with echocardiography was investigated. Cardiac inflammation measured on histopathology did not have a correlative relationship with cardiac output decline (Table 2).
Discussion
We developed an in vitro method and characterized a mouse model that replicates the progressive fibrosis and cardiac dysfunction seen in human disease. In our mouse model, significantly increased cardiac strain and decreased cardiac output were detectable using 2 noninvasive imaging modalities. At each time point, cardiac strain correlated with cardiac fibrosis as measured on histopathology. Taken together, these data demonstrate that strain analysis using MRI and echocardiography is useful for monitoring progressive cardiac fibrosis. Further, we showed that the serum biomarkers of fibrosis, PDGF‐D, CTGF, and TGF‐β, correlate with tissue fibrosis, cardiac strain, and cardiac output, making them potentially useful biomarkers for monitoring the progression of fibrosis in this model of cardiomyopathy. Importantly, this is the first study to identify CTGF and PDGF‐D as participants in fibrosis signaling in CCC and as candidates for biomarkers of fibrosis in CCC. This study also confirmed elevated serum TGF‐β in a mouse model of CCC and was the first to define a correlation between cardiac fibrosis and TGF‐β in this model. To our knowledge, this is the first study to demonstrate correlations between tissue fibrosis, fibrosis biomarkers, and progressive cardiac dysfunction in a mouse model of CCC.
Cardiac Fibrosis as the Pathognomonic Lesion in CCC
Existing studies using mouse models of CCC have focused on the prevention or amelioration of cardiac fibrosis as only 1 component of disease pathology in the heart.10, 11, 25, 26 In this model, cardiac inflammation was identified in chronically infected mice. However, only fibrosis correlated with decline in cardiac function. Although cardiac inflammation is clearly present in our model of CCC, these results suggest that assessment of cardiac fibrosis is paramount.
Improved Imaging Analysis of Cardiac Structure and Function
To our knowledge, this is the first study to investigate longitudinal cardiac fibrosis in a mouse model of CCC using LV strain quantification. This high‐resolution imaging analysis allows for inspection of fine details of the disease in mice, even in the absence of electrical or circulatory abnormalities. In our study, at 111 and 140 DPI, all infected animals showed significantly elevated global peak circumferential strain measured with MRI, which significantly correlated with cardiac fibrosis on histopathology. Evaluating 111 and 140 DPI time points allowed us to follow the progression of cardiac fibrosis, whereas previously only pre‐ and postfibrosis time points were examined.27
The progressive cardiac MRI strain results in mice align with comparable findings in human CCC patients, confirming that our mouse model successfully replicates myocardial fibrosis seen in humans.8, 9, 28, 29 In the current study, we were able to measure similar trends in mice without contrast enhancement, using a simplified method with both circumferential and longitudinal LV endocardial strain from echocardiography. The cardiac strain findings also significantly correlated with the marked increased cardiac fibrosis quantified on histopathology. In humans, longitudinal strain from MRI is preferred; however, in our animal model, we were able to see comparable differences with both longitudinal and circumferential strain from echocardiography. The relative ease of echocardiography versus MRI when imaging animals demonstrates that this approach is suitable for characterizing the progression of physical alterations in the ventricular wall to monitor heart function in animal models. This finding will be particularly useful for future preclinical studies designed to evaluate the impact of novel treatments on infection‐induced myocardial fibrosis. No electrocardiographic abnormalities were seen with any of the infected animals at any time point, further suggesting that strain analysis allows for characterization of subclinical cardiac dysfunction in this animal model. Myocardial fibrosis is seen in a significant number of indeterminate human patients in the absence of overt cardiac disease, that is, arrhythmias, supporting this conclusion.30 Taken together, these findings demonstrate the significance of cardiac fibrosis as a mechanism to increase cardiac strain, detectable on 2 modalities of cardiac imaging.
The correlation between cardiac output decline, in the face of preserved EF and relatively low cardiac inflammation and increased cardiac fibrosis, is an important finding. EF was significantly reduced in only 37.5% of the infected animals, suggesting that this parameter alone is not a reliable indicator of overall cardiac performance in animal models and thus should be used in conjunction with other echocardiographic parameters for successful assessment of LV functional decline in animal models of CCC. The finding of significantly reduced cardiac output in the face of preserved EF shows that our mouse model of CCC develops heart failure with either preserved or reduced EF.
The current study also illustrates the significant link between cardiac fibrosis development with overall decline in heart function in animal models. This association has several components. First, we noted how cardiac fibrosis correlated with both decreased cardiac output and increased LV strain. As decreased cardiac output also correlated with increased LV strain, the value of cardiac strain as a measure of cardiac function is high in animal models of CCC. Assessment of LV strain using echocardiography will be a valuable tool in efficacy testing at the preclinical stage of therapeutic development.
Yet another aspect of our studies was the use of serial imaging using either MRI or echocardiography. Previously, fibrosis was evaluated only with examination of end point histopathology. While this method is the gold standard for detecting myocardial fibrosis, it is limited to evaluating only one time point during disease progression. The use of cardiac MRI and echocardiography strain analysis to quantify cardiac fibrosis in a longitudinal fashion will greatly benefit serial preclinical evaluations of disease interventions and therapeutics aimed at ameliorating pathology caused by chronic T cruzi infection in individual animals. Using cardiac strain analysis of cardiac MRI and echocardiography is a method that offers longitudinal measurements of changes in ventricular wall composition, which informs on levels of cardiac fibrosis throughout disease.
Improved Biomarkers for Monitoring CCC
Fibrosis biomarkers represent a valuable diagnostic assessment tool that can be used to longitudinally measure cardiac fibrosis in a noninvasive manner. Biomarkers of cardiac injury and dysfunction have been investigated in animal models and humans with CCC, including cardiac troponin, B‐type natriuretic protein, galectin‐3, and others.31 However, none of these biomarkers can be used to predict onset of disease, as they are all elevated after cardiac dysfunction already exists. Here, we show that the serum biomarkers PDGF‐D, CTGF, and TGF‐β are elevated in a mouse model of CCC.
Measurement of these factors was done at both the protein and gene expression levels. In the serum, the levels of PDGF‐D, CTGF, and TGF‐β were elevated in mice with fibrotic hearts. We also saw increased secretion of PDGF‐D, CTGF, and TGF‐β from both cardiac cells and cardiac fibroblasts upon infection with T cruzi in vitro. In addition, the gene expression of these markers was significantly elevated in the hearts of infected mice. Thus, it is highly likely that all these factors are participatory in the signaling that promotes development of cardiac fibrosis in response to chronic T cruzi infection. The ability to measure circulating levels in the blood throughout disease potentially provides a powerful noninvasive monitoring tool in these animal models.
In late chronic infection, we were able to find a correlative relationship among all 3 biomarkers and both cardiac strain and cardiac output. PDGF‐D serum levels showed an increasing trend over time, similar to the increased trend of myocardial fibrosis over time and correlating with cardiac strain measured with echocardiography. The correlative relationship between serum PDGF‐D and cardiac fibrosis was strongest of the 3 fibrosis biomarkers. Thus, we propose that PDGF‐D is a particularly useful serum biomarker to monitor progression of myocardial fibrosis and cardiac dysfunction in a mouse model of CCC. We confirmed that TGF‐β is upregulated because of T cruzi infection, and we were the first to directly correlate serum levels with cardiac fibrosis in CCC. We were also the first to investigate and correlate CTGF and PDGF‐D serum concentrations to cardiac fibrosis. Measuring these biomarkers allows for characterization and detection of cardiac fibrosis before development of clinical signs attributable to cardiac dysfunction.
Potential Mechanism of Progressive Fibrosis in CCC
We observed that T cruzi infection of cardiac cell culture significantly increases cell supernatant concentrations of the following profibrotic factors: TGF‐β, CTGF, ET‐1, and PDGF‐D. These findings demonstrate that the functional cells of the heart participate in creating a profibrotic environment. As these factors have been implicated in development of cardiac fibrosis, the finding that they are produced in higher quantities by cardiac cells, including cardiac fibroblasts, suggests that inhibiting the pathway to which these factors contribute may lessen the amount of fibrosis that develops throughout disease. All the genes for these factors were upregulated in the infected mouse heart, compared with naïve controls, suggesting their importance in the fibrotic cardiac response to infection.
Future studies are needed to uncover the essential signaling relationship that promotes the worsening fibrosis. Previous work shows that TGF‐β, CTGF, and PDGF are all involved in a profibrotic feedback loop, which may be essential to the propagation of cardiac fibrosis in patients and animals with CCC.32 Extensive research on fibrosis suggests TGF‐β to be a master regulator of fibrosis development, and has been previously reported to activate signal transducer and activator of transcription 3 (STAT3) through SMAD2/SMAD3‐dependent signaling.33, 34, 35, 36, 37 As shown in Figure 7A, we propose a possible mechanism for TGF‐β, PDGF‐D, CTGF, and ET‐1 upregulation and release by cardiac cells upon T cruzi infection, leading to fibroblast recruitment and/or differentiation, followed by deposition of collagen. Fibrosis and collagen deposition, when it occurs in the conduction system leads to arrhythmias, or CCC when it occurs in the heart muscle tissue. It is likely that these effects are most potent locally, within the heart tissue, but also contribute to the circulating profibrotic factors described as biomarkers of fibrosis in this study.
Figure 7.
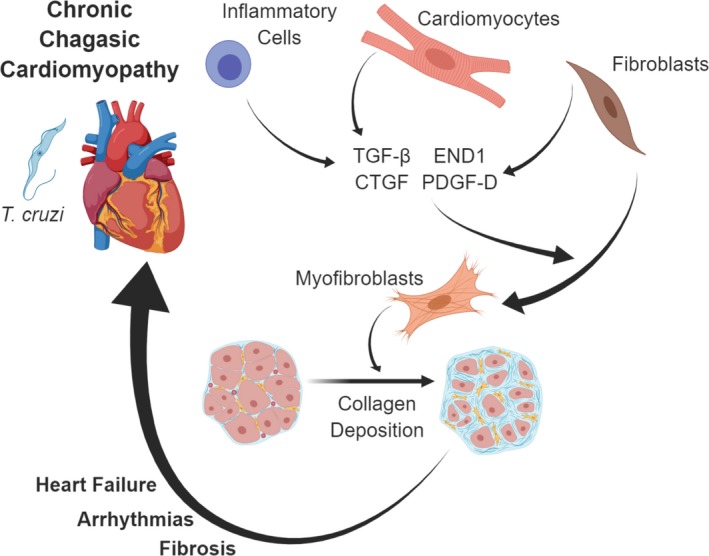
Pathophysiologic events leading to cardiac fibrosis and chronic chagasic cardiomyopathy (CCC) in patients with T cruzi infection. T cruzi in cardiac tissue causes damage to cardiomyocytes and inflammatory response to infection. Immune cells, cardiomyocytes, and fibroblasts produce transforming growth factor‐β (TGF‐β), connective tissue growth factor (CTGF), endothelin‐1 (ET‐1), and platelet‐derived growth factor‐D (PDGF‐D). These profibrotic factors act to stimulate recruitment of fibroblasts, differentiation into myofibroblasts, and secretion of fibrotic tissue components, including collagen. This process continues throughout the chronic stage of infection, leading to pathologic consequences, including cardiac fibrosis, arrhythmias and heart failure. Image created with assistance of Biorender.
Limitations of This Model
Cardiac imaging of mice presents the limitation that the animals must be under general anesthesia. An additional limitation of this model is the increased complexity of imaging by MRI when compared with echocardiography. Cardiac MRI was used at the first 2 chronic time points to measure peak LV strain, but echocardiography was used for the final time point for multiple reasons. First, the period of anesthesia required to obtain the cardiac magnetic resonance images was extensive, at 4 to 6 times longer than echocardiography, which raised concerns about the effects of prolonged anesthesia on the strain results. Echocardiography partially resolved this concern, as the animals were only briefly anesthetized for imaging (10–15 minutes), which allowed for heart rates to be maintained closer to waking physiologic range, compared with MRI. Despite the reduced heart rates under anesthesia compared with waking physiologic range, the strain results from the infected animals remained significantly different from the naïve animals, so we are confident that the findings using MRI are attributable to infection status. Second, the prolonged anesthesia precluded the acquisition of imaging of multiple axes with MRI, as obtaining tagged images in the longitudinal plane would have doubled the imaging and anesthesia time. However, images in both longitudinal and short‐axis images were obtained within the brief anesthesia period with echocardiography. This allowed for strain analysis of 2 axes instead of 1, which provided a much more detailed perspective of the LV walls.
Another limitation of this study is that both imaging modalities were not performed at all time points, allowing direct comparison of the strain analysis results. Because of the length of anesthesia and technical expertise required for both modalities, we elected to focus on 1 modality for each time point. We were able to acquire MRI cines in only 1 plane, thus only circumferential strain analysis was measured. Despite this, we were able to detect significant differences in LV wall strain at both time points. Because we showed that echocardiographic examination with strain analysis provides enough resolution to detect significant differences in LV longitudinal and circumferential strain, we will use this modality for future studies of fibrosis in mouse models of CCC.
Implications Regarding Model Translation to Human Disease
In this model of CCC, we found that infection using a human patient isolate of T cruzi TcI was successful in recapitulating cardiac pathology in mice, similar to that most commonly found in human patients with CCC. In South America, extensive cardiac fibrosis in 72.2% of subclinical patients, including those without previously detected systolic dysfunction, was visualized with late gadolinium enhancement by cardiac MRI.29 Here, we describe a similar manifestation of cardiac fibrosis in a mouse model of CCC. In the current study, we defined 3 profibrotic biomarkers that represent viable treatment targets to specifically address cardiac fibrosis in CCC. Future studies should include investigations into whether inhibition of 1 or all of these biomarkers or their downstream effectors, particularly SMAD and STAT phosphorylation, can ameliorate development of cardiac fibrosis in CCC. Previous studies show that STAT inhibition with a small‐molecule inhibitor, C188‐9, is effective at reducing lung fibrosis in an animal model.38 Using a similar approach in our model of CCC may illustrate similar reduction of cardiac fibrosis development. Development of improved treatments for CCC should include investigation into antifibrotic treatments to improve overall cardiac health.
We also describe the longitudinal alterations in cardiac strain detected with cardiac MRI and echocardiography in a mouse model of Chagas disease and correlate these findings to cardiac pathology and changes on histopathology. This mouse model of CCC can be used to assess efficacy of treatments for CCC. These findings have the potential to translate to human patients with CCC. In addition to the current monitoring of cardiac function through imaging and levels of biomarkers like troponin and others, PDGF‐level monitoring may provide additional insight into treatment efficacy, particularly regarding cardiac fibrosis development.
Conclusions
Cardiac fibrosis development in an experimental mouse model of CCC using the H1 strain of T cruzi is quantifiable with profibrotic biomarkers and noninvasive cardiac imaging with strain analysis closely correlates to decline in cardiac output. The profibrotic biomarkers TGF‐β, CTGF, and PDGF‐D correlate to levels of cardiac fibrosis throughout T cruzi infection. Monitoring levels of these biomarkers over the course of chronic infection is a time‐ and cost‐effective way to assess disease progression and the effects that treatment strategies have on development of cardiac fibrosis in CCC. Longitudinal monitoring of cardiac strain with cardiac MRI or echocardiography will be a valuable tool in the approach to preclinical research and development of treatment plans specific to cardiac fibrosis in patients with CCC. These findings are consistent with the hypothesis that cardiac fibrosis in CCC is an important pathological development, which can be monitored via LV wall strain as a prognostic indicator of total cardiac health throughout CCC disease.
Sources of Funding
This study was supported by Texas Children's Hospital Center for Vaccine Development intramural funding. Equipment and reagents used were funded in part by Baylor Research Advocates for Student Scientists. The authors do not have any financial or personal interests that may pose a conflict of interest. Several experiments for this paper were performed with assistance of the Mouse Phenotyping Core at Baylor College of Medicine with funding from the NIH (UM1HG006348) and NIH (RO1DK114356), the Pathology and Histology Core at Baylor College of Medicine with funding from the NIH (P30 CA125123), and the Baylor College of Medicine Small Animal ATC core, directed by Dr Robia Pautler.
Disclosures
All the authors of this manuscript currently are involved in a program for the development of a therapeutic Chagas disease vaccine.
Supporting information
Table S1. List of Fibrosis‐Associate Genes Measured in Heart Tissue From Infected and Naïve Mice With Reverse Transcriptase Polymerase Chain Reaction
Acknowledgments
The authors thank Dr Steen Pederson for his role in MRI analysis.
(J Am Heart Assoc. 2019;8:e013365 DOI: 10.1161/JAHA.119.013365.)
References
- 1. World Health Organization . Chagas disease (American trypanosomiasis). Available at: http://www.who.int/mediacentre/factsheets/fs340/en/. March 2017. Accessed March 14, 2019.
- 2. Bocchi EA, Arias A, Verdejo H, Diez M, Gómez E, Castro P. The reality of heart failure in Latin America. J Am Coll Cardiol. 2013;62:949–958. [DOI] [PubMed] [Google Scholar]
- 3. Laranja FS, Dias E, Nobrega G, Miranda A. Chagas’ disease: a clinical, epidemiologic, and pathologic study. Circulation. 1956;14:1035–1060. [DOI] [PubMed] [Google Scholar]
- 4. Criteria Committee of the New York Heart Association . Nomenclature and Criteria for Diagnosis of Diseases of the Heart and Great Vessels. 9th ed Boston: Little, Brown & Co.; 1994:253–256. [Google Scholar]
- 5. González B, Silva M, Al‐Atrache Y, Delgado Y, Serrano JL, Doccimo A, Hernández H, Verde J, Morillo D, Marín J, Concepción JL, Bonfante‐Cabarcas R, Rodríguez‐Bonfante C. Risk factors associated with the diagnosis of chronic chagasic miocardiopathy in seropositive individuals from Barinas state. Venezuela. Invest Clin. 2014;55:119–132. [PubMed] [Google Scholar]
- 6. Tanowitz HB, Machado FS, Spray DC, Friedman JM, Weiss OS, Lora JN, Nagajyothi J, Moraes DN, Garg NJ, Nunes MCP, Ribeiro ALP. Developments in the management of Chagas cardiomyopathy. Expert Rev Cardiovasc Ther. 2015;13:1393–1409. [DOI] [PMC free article] [PubMed] [Google Scholar]
- 7. Morillo CA, Marin‐Neto JA, Avezum A, Sosa‐Estani S, Rassi A Jr, Rosas F, Villena E, Quiroz R, Bonilla R, Britto C, Guhl F, Velazquiz E, Bonilla L, Meeks B, Rao‐Melacini P, Poque J, Mattos A, Lazdins J, Rassi A, Connolly SJ, Yusuf S. Randomized trial of benznidazole for chronic Chagas’ cardiomyopathy. N Engl J Med. 2015;373:1295–1306. [DOI] [PubMed] [Google Scholar]
- 8. Tassi EM, Continentino MA, do Nascimento EM, Pereira BdB, Pedrosa RC. Relationship between fibrosis and ventricular arrhythmias in Chagas heart disease without ventricular dysfunction. Arq Bras Cardiol. 2014;102:456–464. [DOI] [PMC free article] [PubMed] [Google Scholar]
- 9. Uellendahl M, Siqueira ME, Calado EB, Kalil‐Filho R, Sobral D, Ribeiro C, Oliveira W, Martins S, Narula J, Rochitte CE. Cardiac magnetic resonance‐verified myocardial fibrosis in chagas disease: clinical correlates and risk stratification. Arq Bras Cardiol. 2016;107:460–466. [DOI] [PMC free article] [PubMed] [Google Scholar]
- 10. Kapur NK, Wilson S, Yunis AA, Qiao X, Mackey E, Paruchuri V, Baker C, Aronovitz MJ, Karumanchi SA, Letarte M, Kass DA, Mendelsohn ME, Karas RH. Reduced endoglin activity limits cardiac fibrosis and improves survival in heart failure. Circulation. 2012;125:2728–2738. [DOI] [PMC free article] [PubMed] [Google Scholar]
- 11. Tank J, Lindner D, Wang X, Stroux A, Gilke L, Gast M, Zietsch C, Skurk C, Scheibenbogen C, Klingel K, Lassner D, Kühl U, Schultheiss HP, Westermann D, Poller W. Single‐target RNA interference for the blockade of multiple interacting proinflammatory and profibrotic pathways in cardiac fibroblasts. J Mol Cell Cardiol. 2014;66:141–156. [DOI] [PubMed] [Google Scholar]
- 12. Wang X, Guo Z, Ding Z, Khaidakov M, Lin J, Xu Z, Sharma SG, Jiwani S, Mehta J. Endothelin‐1 upregulation mediates aging‐related cardiac fibrosis. J Mol Cell Cardiol. 2015;80:101–109. [DOI] [PubMed] [Google Scholar]
- 13. Widyantoro B, Emoto N, Nakayama K, Anggrahini DW, Adiarto S, Iwasa N, Yagi K, Miyagawa K, Rikitake Y, Suzuki T, Kisanuki YY, Yanagisawa M, Hirata K. Endothelial cell‐derived endothelin‐1 promotes cardiac fibrosis in diabetic hearts through stimulation of endothelial‐to‐mesenchymal transition. Circulation. 2010; 121:2407–2418. [DOI] [PubMed] [Google Scholar]
- 14. Brigstock DR. Connective tissue growth factor (CCN2, CTGF) and organ fibrosis: lessons from transgenic animals. J Cell Commun Signal. 2010;4:1–4. [DOI] [PMC free article] [PubMed] [Google Scholar]
- 15. Pontén A, Folestad EB, Pietras K, Eriksson U. Platelet‐derived growth factor D induces cardiac fibrosis and proliferation of vascular smooth muscle cells in heart‐specific transgenic mice. Circ Res. 2005;97:1036–1045. [DOI] [PubMed] [Google Scholar]
- 16. Yoon PO, Lee MA, Cha H, Jeong MH, Kim J, Jang SP, Choi BY, Jeong D, Yang DK, Hajjar RJ, Park WJ. The opposing effects of CCN2 and CCN5 on the development of cardiac hypertrophy and fibrosis. J Mol Cell Cardiol. 2010;49:294–303. [DOI] [PubMed] [Google Scholar]
- 17. Shen N, Li X, Zhou T, Bilal MU, Du N, Hu Y, Qin W, Xie Y, Wang H, Wu J, Ju J, Fang Z, Wang L, Zhang Y. Shensong Yangxin Capsule prevents diabetic myocardial fibrosis by inhibiting TGF‐β1/Smad signaling. J Ethnopharmacol. 2014;157:161–170. [DOI] [PubMed] [Google Scholar]
- 18. Jeong MH, Kim SJ, Kang H, Park KW, Park WJ, Yang SY, Yang DK. Cucurbitacin I attenuates cardiomyocyte hypertrophy via inhibition of connective tissue growth factor (CCN2) and TGF‐ β/SMADS signalings. PLoS ONE. 2015;10:1–14. [DOI] [PMC free article] [PubMed] [Google Scholar]
- 19. Chatzifrangkeskou M, Le Dour C, Wu W, Morrow JP, Joseph LC, Beuvin M, Sera F, Homma SS, Vignier N, Mougenot N, Bonne G, Lipson KE, Worman HJ, Muchir A. ERK1/2 directly acts on CTGF/CCN2 expression to mediate myocardial fibrosis in cardiomyopathy caused by mutations in the lamin A/C gene. Hum Mol Genet. 2016;25:2220–2233. [DOI] [PMC free article] [PubMed] [Google Scholar]
- 20. McCollum LT, Gallagher PE, Tallant EA. Angiotensin‐(1‐7) abrogates mitogen‐stimulated proliferation of cardiac fibroblasts. Peptides. 2012;34:380–388. [DOI] [PMC free article] [PubMed] [Google Scholar]
- 21. Fujita S, Shimojo N, Terasaki F, Otsuka K, Hosotani N, Kohda Y, Tanaka T, Nishioka T, Yoshida T, Hiroe M, Kitaura Y, Ishizaka N, Imanaka‐Yoshida K. Atrial natriuretic peptide exerts protective action against angiotensin II‐induced cardiac remodeling by attenuating inflammation via endothelin‐1/endothelin receptor A cascade. Heart Vessels. 2013;28:646–657. [DOI] [PubMed] [Google Scholar]
- 22. Fan B, Ma L, Li Q, Wang L, Zhou J, Wu J. Correlation between platelet‐derived growth factor signaling pathway and inflammation in desoxycorticosterone‐induced salt‐sensitive hypertensive rats with myocardial fibrosis. Int J Clin Exp Pathol. 2013;6:2468–2475. [PMC free article] [PubMed] [Google Scholar]
- 23. Ruiz‐Sanchez R, de Leon MP, Matta V, Reyes PA, Lopez R, Jay D, Monteon VM. Trypanosoma cruzi isolates from Mexican and Guatemalan acute and chronic chagasic cardiopathy patients belong to Trypanosoma cruzi I. Mem Inst Oswaldo Cruz. 2005;100:281–283. [DOI] [PubMed] [Google Scholar]
- 24. National Research Council (US) Committee for the Update of the Guide for the Care and Use of Laboratory Animals . Guide for the Care and Use of Laboratory Animals, 8th ed Washington, DC: National Academies Press; 2011. [PubMed] [Google Scholar]
- 25. Barry MA, Wang Q, Jones KM, Heffernan MJ, Buhaya MH, Beaumier CM, Keegan BP, Zhan B, Dumonteil E, Bottazzi ME, Hotez PJ. A therapeutic nanoparticle vaccine against Trypanosoma cruzi in a BALB/c mouse model of Chagas disease. Hum Vaccin Immunother. 2016;12:976–987. [DOI] [PMC free article] [PubMed] [Google Scholar]
- 26. Morris SA, Weiss LM, Factor S, Bilezikian JP, Tanowitz H, Wittner M. Verapamil ameliorates clinical, pathologic and biochemical manifestations of experimental chagasic cardiomyopathy in mice. J Am Coll Cardiol. 1989;14:782–789. [DOI] [PubMed] [Google Scholar]
- 27. Dumonteil E, Escobedo‐Ortegon J, Reyes‐Rodriguez N, Arjona‐Torres A, Ramirez‐Sierra MJ. Immunotherapy of Trypanosoma cruzi infection with DNA vaccines in mice. Infect Immun. 2004;72:46–53. [DOI] [PMC free article] [PubMed] [Google Scholar]
- 28. Rochitte CE, Oliveira PF, Andrade JM, Oliveira PF, Andrade JM, Ianni BM, Parga JR, Avila LF, Kalil‐Filho R, Mady C, Meneghetti JC, Lima JA, Ramires JA. Myocardial delayed enhancement by magnetic resonance imaging in patients with Chagas’ disease: a marker of disease severity. J Am Coll Cardiol. 2005;46:1553–1558. [DOI] [PubMed] [Google Scholar]
- 29. Torreão JA, Ianni BM, Mady C, Naia E, Rassi CH, Nomura C, Parga JR, Avila LF, Ramires JA, Kalil‐Filho R, Rochitte CE. Myocardial tissue characterization in Chagas heart disease by cardiovascular magnetic resonance. J Cardiovasc Magn Reson. 2015;17:97. [DOI] [PMC free article] [PubMed] [Google Scholar]
- 30. Macedo CT, Larocca TF, Noya‐Rabelo M, Correia LCL, Moreira MIG, Caldas AC, Torreao JA, de Freitas Souza BC, Dos Santos RR, Soares MBP. Assessment of speckle tracking strain predictive value for myocardial fibrosis in subjects with Chagas disease. Int J Cardiol Heart Vasc. 2015;8:75–80. [DOI] [PMC free article] [PubMed] [Google Scholar]
- 31. Echeverria LE, Rojas LZ, Calvo LS, Roa ZM, Rueda‐Ochoa OL, Morillo CA, Muka T, Franco OH. Profiles of cardiovascular biomarkers according to severity stages of Chagas cardiomyopathy. Int J of Card. 2016;227:577–582. [DOI] [PubMed] [Google Scholar]
- 32. Leask A. Potential therapeutic targets for cardiac fibrosis. Circ Res. 2010;106:1675–1680. [DOI] [PubMed] [Google Scholar]
- 33. Su SA, Yang D, Wu Y, Xie Y, Zhu W, Cai Z, Shen J, Fu Z, Wang Y, Jia L, Wany Y, Wang JA, Xiang M. EphrinB2 regulates cardiac fibrosis through modulating the interaction of Stat3 and TGF‐β/Smad3 signaling. Circ Res. 2017;121:617–627. [DOI] [PubMed] [Google Scholar]
- 34. Massague J. TGF‐beta signal transduction. Annu Rev Biochem. 1998;67:753–791. [DOI] [PubMed] [Google Scholar]
- 35. Leask A, Abraham DJ. TGF‐beta signaling and the fibrotic response FASEB J. 2004;18:816–827. [DOI] [PubMed] [Google Scholar]
- 36. Roberts AB. TGF‐beta signaling from receptors to the nucleus. Microbes Infect. 1999;1:1265–1273. [DOI] [PubMed] [Google Scholar]
- 37. Bujak M, Ren G, Kweon HJ, Dobaczewski M, Reddy A, Taffet G, Wang XF, Frangogiannis NG. Essential role of Smad3 in infarct healing and in the pathogenesis of cardiac remodeling. Circulation. 2007;116:2127–2138. [DOI] [PubMed] [Google Scholar]
- 38. Pedroza M, Le TT, Lewis K, Karmouty‐Quintana H, To S, George AT, Blackburn MR, Tweardy DJ, Agarwal SK. STAT‐3 contributes to pulmonary fibrosis through epithelial injury and fibroblast‐myofibroblast differentiation. FASEB J. 2016;30:129–140. [DOI] [PMC free article] [PubMed] [Google Scholar]
Associated Data
This section collects any data citations, data availability statements, or supplementary materials included in this article.
Supplementary Materials
Table S1. List of Fibrosis‐Associate Genes Measured in Heart Tissue From Infected and Naïve Mice With Reverse Transcriptase Polymerase Chain Reaction