Abstract
Calcium alginate gel (CAG) has been widely investigated for the development of artificial foods; however, there are few studies on its thermal stability. This study aimed to monitor changes in the physical properties of CAG beads during heat treatment using response surface methodology. Heating temperature (X1, 40–100 °C) and heating time (X2, 5–60 min) were chosen as independent variables. The dependent variables were rupture strength (Y1, kPa), size (Y2, μm), and sphericity (Y3, %). The heating temperature (X1) was the independent variable that had a significant effect on the rupture strength (Y1) and size (Y2). Rupture strength (Y1) increased as the heating temperature (X1) increased; at the same time, the CAG beads size (Y2) decreased. With all conditions, the values of sphericity (Y3) were over 94%. SEM images revealed that increase in the rupture strength of the CAG beads by heat treatment resulted from their porous structures. Loss of moisture by syneresis, occurring with heat treatment, was judged to create a dense porous structure of CAG beads. Our findings offer useful information for cooking or sterilizing food products utilizing CAG beads. In addition, thermal treatment could be applied to produce hard CAG beads with a high rupture strength.
Keywords: calcium alginate gel, bead, thermal treatment, physical property, response surface methodology
1. Introduction
Alginate is a linear anionic polysaccharide derived from brown seaweeds and is composed of (1-4)-linked β-D-mannuronic (M) and α-L-guluronic acid (G) residues [1,2]. It can form gel through cross linking with divalent cations, forming an egg-box structure [1,3]. Among divalent cations, calcium is the most commonly used cation for ionotropic gelation of alginate [1]. Calcium alginate gel (CAG) is easily produced by extrusion methods, by dripping the alginate solution into a calcium ion solution [4]. CAG has been investigated as a thickener, stabilizer, and restructuring agent in food processing because of its unique gelling abilities [5]. Furthermore, CAG has been applied in cell encapsulation, drug delivery and tissue engineering [6].
In recent years, there has been an increasing interest in CAG as a biomaterial for making artificial or imitative foods. Some researchers have studied the optimization of the processing of fish roe [7,8] and effects of the physicochemical parameters of cooked rice [9] analogs using CAG. Many studies have focused on optimizing the processing conditions, such as concentration of the alginate or calcium and gelation time. To date, little attention has been paid to the thermal stability of CAG. In the food industry, foods prepared with CAG are subjected to various forms of heat treatment. For example, food safety issues require thermal processes for sterilization of the CAG; moreover, CAG foods may be heated for cooking or manufacturing. During thermal treatments, CAG’s physical properties undergo changes; however, no information can be found. The physical properties of alginate gels are used to enhance food product quality and stability during storage [10,11]. Therefore, it is important to investigate the effects of thermal treatment on physical property changes in CAG, for application and processing of CAG-based foods.
This study aimed to understand the effects of heat treatment on the physical properties of CAG beads for its application to fish roe analogs. The central composite design (CCD) of response surface methodology (RSM) was adopted to monitor the effects of heat treatment. RSM is a statistical procedure frequently used for optimization and monitoring of food processes. The basic principle of RSM is to describe model equations defining the effect of test variables on responses and determine interrelationships among test variables in any response [12]. The CCD was reported for designing the experiment, to create a model, and to optimize the process variables with sensory and hedonic properties of food products [13]. Heating temperature and time were chosen as the independent variables. Rupture strength, size, and sphericity were measured to explore the physical property changes of the CAG beads after heat treatment. Furthermore, microstructures were analyzed using scanning electron microscopy.
2. Materials and Methods
2.1. Materials
Sodium alginate (Junsei Chemical Co., Ltd., Tokyo, Japan) and calcium lactate (Daejung chemical & metal Co., Ltd., Siheung, Korea) were used as the functional materials for CAG beads. All chemicals and reagents used in this study were of an analytical grade.
2.2. Preparation of CAG Beads
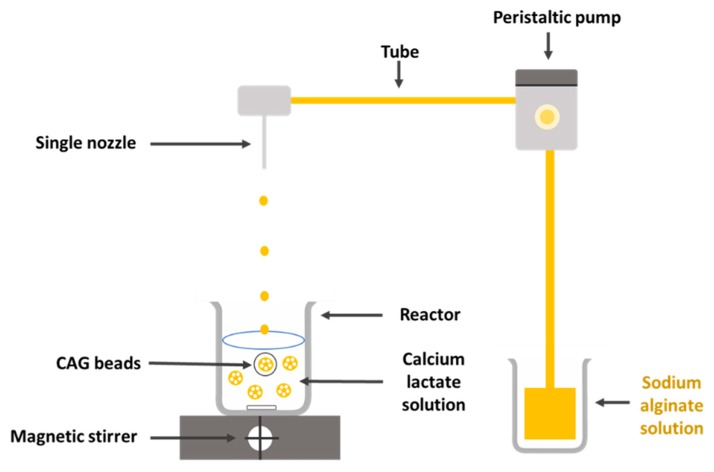
A sodium alginate solution (2.57%, w/v) was dropped through a single nozzle 20G (inner diameter: 0.60 mm, outer diameter: 0.90 mm) using a peristaltic pump (Cassette tube pump SMP-23, Eyela, Tokyo, Japan) into a calcium lactate solution (1.52%, w/v). The stirring speed of calcium lactate solution (250 mL) in the reactor (500 mL) was 300 rpm. The distance between the nozzle tip and the surface of the calcium lactate solution was 8 cm. The allowed gelation time was 20 min. The CAG beads were rinsed with distilled water to remove any remaining calcium lactate. A schematic diagram for preparation of CAG beads is shown in Figure 1.
Figure 1.
Simple schematic diagram for the preparation of calcium alginate gel (CAG) beads using a single nozzle.
2.3. Measurement of Size and Sphericity of CAG
CAG beads sizes were measured by a stereomicroscope (Olympus SZX16; Tokyo, Japan) and were represented as diameter (mm). Sphericity (%) was determined by the percent ratio of the minor diameter to major diameter, obtained from the size measurements; five beads were randomly selected from each experimental condition for measurement.
2.4. Measurement of Rupture Strength
The rupture strength was measured using a rheometer (Model CR-100D, Sun Scientific Co., Ltd., Tokyo, Japan) with the following conditions: plunger diameter, 25 mm; penetration speed, 80 mm/min; adaptor area, 4.91 cm2; and load cell force, 0.1 kN. Five samples were measured for each experiment.
2.5. Experimental Design
To monitor the effects of heat treatment on the physical properties of the CAG beads, a central composite design (CCD) was adopted in the optimization of the CAG beads. CCD in this design comprises 22 factorial points, 4 axial points (α = 1.414), with 3 replicates of the central points. Heating temperature (X1, °C) and time (X2, min) were chosen as independent variables. The range and center point values of the two independent variables were based on the results of preliminary experiments (Table 1). The dependent variables were rupture strength (Y1, kPa), size (Y2, μm), and sphericity (Y3, %), indicating the physical characteristics of the CAG beads. The experiments were randomized to minimize the effects of unexpected variability in the observed responses.
Table 1.
Experimental range and values of independent variables in the central composite design for monitoring the effects of thermal treatment on the physical properties of CAG beads.
| Independent Variables | Symbol | Range and Levels | ||||
|---|---|---|---|---|---|---|
| –1.414 | –1 | 0 | +1 | +1.414 | ||
| Heating temperature (°C) | X1 | 40 | 49 | 70 | 91 | 100 |
| Heating time (min) | X2 | 5 | 13 | 33 | 52 | 60 |
2.6. Data Analysis and Optimization
Using the response surface methodology of MINTAB statistical software (Version 16, Minitab Inc., Harrisburg, PA, USA), Equation (1) was used to fit results [14].
| (1) |
Here, Y is a dependent variable (rupture strength, size, or sphericity), β0 is a constant, βi, βii, βij are regression coefficients, Xi and Xj are levels of the independent variables. The target value of Y1 maximum and response optimization were calculated by the response optimizer in the MINITAB software. Three-dimensional response surface plots were developed using Maple software (Version 7, Waterloo Maple Inc., Waterloo, Ontario, Canada) and represented a function of two independent variables.
2.7. Scanning Electron Microscopy (SEM)
To investigate the influence of heat treatment on CAG bead microstructure, the CAG beads were immersed in liquid nitrogen and cut with a knife to obtain the cross section. The CAG beads then underwent lyophilization in a freeze-dryer (CoolSafe, Lynge, Denmark) for 24 h. Moreover, the CAG beads were fixed to a sample with a gold layer using an ion sputter device (Hitachi, E-1010, Tokyo, Japan), and viewed by SEM (JSM-6490LV, JEOL Ltd., Tokyo, Japan) at an accelerating voltage of 15 kV.
2.8. Weight and Water Contents of the CAG Beads
Water content (%) was measured with a moisture analyzer (MX-50, A&D, Tokyo, Japan). The CAG beads were weighed and placed on the analyzer and heated at 100 °C until no weight change was observed. The difference between the original and final weight was considered as the water content. Weighing was performed on a digital balance (Model Radwag, AS 220-R1, Radom, Poland). Water content and weight are expressed as the mean of three replications.
2.9. Measurement of Density
The mean weights and diameters of the beads were measured and used to calculate densities of beads using the following Equation (2):
| (2) |
where D is the density of the beads; M is the weight of the beads; V is the volume of the beads; r is the radius of the beads.
3. Results and Discussion
3.1. Diagnostic Checking of the Fitted Models
Table 2 presents the experimental design and values of the dependent variables considering different heat treatment conditions. It is necessary to fit the quadratic polynomial equation to describe the behavior of the dependent variables on independent variables [15]. Response surface model equations are estimated by a statistical approach called the least-squares technique [16]. The fitted response surface model equations are shown in Table 3. The determination coefficient (R2) value indicates that the model equations described the experimental designs adequately [17]. In general, the more suitable the consideration of the lowest standard deviation, the highest R-squared values (R2, adjusted R2), the better the fit [18]. A p-value smaller than 0.05 implies that the corresponding model term is significant [19]. The R2 values of Y1 (rupture strength), Y2 (size), and Y3 (sphericity) were 0.904, 0.888 (p < 0.05), and 0.935 (p < 0.01), respectively. The statistical significance of the quadratic polynomial model equation was evaluated by an analysis of variance (ANOVA), shown in Table 4; the results for the models show the response of the three dependent variables. The results of the lack of fit test, which indicates the fitness of the model [20], show that the F-values of Y1, Y2, and Y3 were 9.57, 8.63, and 1.57, respectively; the related p-values were not significant (0.096, 0.106, and 0.412, respectively) (p > 0.05). These results indicate that the models were suitable for accurately predicting variation [21].
Table 2.
Central composite design matrix and values of dependent variables for monitoring the effects of thermal treatment on the physical properties of CAG beads.
| Run No. | Independent Variables | Dependent Variables * | ||||||
|---|---|---|---|---|---|---|---|---|
| Coded Values | Uncoded Values | |||||||
| X1 | X2 | X1 | X2 | Y1 | Y2 | Y3 | ||
| Factorial portions |
1 | –1 | –1 | 49 | 13.1 | 2658 | 2.73 | 96.6 |
| 2 | 1 | –1 | 91 | 13.1 | 3692 | 2.31 | 95.6 | |
| 3 | –1 | 1 | 49 | 52 | 2243 | 2.73 | 96.6 | |
| 4 | 1 | 1 | 91 | 52 | 3516 | 2.28 | 95.5 | |
| Axial portions |
5 | –1.414 | 0 | 40 | 32.5 | 2597 | 2.62 | 96.0 |
| 6 | 1.414 | 0 | 100 | 32.5 | 3408 | 2.28 | 95.4 | |
| 7 | 0 | –1.414 | 70 | 5 | 3244 | 2.46 | 97.6 | |
| 8 | 0 | 1.414 | 70 | 60 | 2773 | 2.44 | 96.7 | |
| Center points |
9 | 0 | 0 | 70 | 32.5 | 3060 | 2.48 | 98.0 |
| 10 | 0 | 0 | 70 | 32.5 | 3177 | 2.43 | 98.2 | |
| 11 | 0 | 0 | 70 | 32.5 | 3032 | 2.49 | 98.7 | |
X1: Heating temperature (°C), X2: Heating time (min). Y1: Rupture strength (kPa), Y2: size (mm), Y3: sphericity (%) * Each experiment was performed five times and the average value is used here.
Table 3.
Response surface model equations for monitoring the effects of thermal treatment on the physical properties of CAG beads.
| Quadratic Polynomial Model Equations | R 2 | Adj R2 | S | p-Value |
|---|---|---|---|---|
| Y1 = 3090 + 431.7 X1 – 157.1 X2 – 38.1 X12 – 35.1 X22 + 59.8 X1X2 | 0.904 | 0.808 | 190.633 | 0.014 |
| Y2 = 2.34667 – 0.1689 X1 – 0.0073 X2 – 0.0073 X12 – 0.0073 X22 – 0.0075 X1X2 | 0.888 | 0.777 | 0.0759091 | 0.020 |
| Y3 = 98.300 – 0.369 X1 – 0.172 X2 – 1.388 X12 – 0.663 X22 – 0.025 X1X2 | 0.935 | 0.870 | 0.417781 | 0.005 |
X1: Heating temperature (°C), X2: Heating time (min). Y1: Rupture strength (kPa), Y2: size (mm), Y3: sphericity (%).
Table 4.
Analysis of variance for dependent variables.
| Dependent Variables | Sources | DF | SS | MS | F-Value | p-Value |
|---|---|---|---|---|---|---|
| Y1 Rupture strength (kPa) |
Regression | |||||
| Linear | 2 | 1688737 | 84436 | 23.23 | 0.003 * | |
| Square | 2 | 11756 | 5878 | 0.16 | 0.855 | |
| Interaction | 1 | 14280 | 14280 | 0.39 | 0.558 | |
| Residual | ||||||
| Lack of fit | 3 | 169872 | 56624 | 9.57 | 0.096 | |
| Pure error | 2 | 11833 | 5916 | |||
| Total | 10 | 1896479 | ||||
| Y2 Size (mm) |
Regression | |||||
| Linear | 2 | 0.228518 | 0.114259 | 19.83 | 0.004 * | |
| Square | 2 | 0.000464 | 0.000232 | 0.04 | 0.961 | |
| Interaction | 1 | 0.000225 | 0.000225 | 0.04 | 0.851 | |
| Residual | ||||||
| Lack of fit | 3 | 0.026744 | 0.008915 | 8.63 | 0.106 | |
| Pure error | 2 | 0.002067 | 0.001033 | |||
| Total | 10 | 0.258018 | ||||
| Y3 Sphericity (%) |
Regression | |||||
| Linear | 2 | 1.3223 | 0.6611 | 3.79 | 0.100 | |
| Square | 2 | 11.2716 | 5.6358 | 32.29 | 0.001 * | |
| Interaction | 1 | 0.0025 | 0.0025 | 0.01 | 0.909 | |
| Residual | ||||||
| Lack of fit | 3 | 0.6127 | 0.2042 | 1.57 | 0.412 | |
| Pure error | 2 | 0.2600 | 0.1300 | |||
| Total | 10 | 13.4691 |
DF: Degrees of freedom, SS: Sum of square, MS: Mean square, * Significant at p < 0.05.
3.2. Response Surface Plots and the Effect of Factors
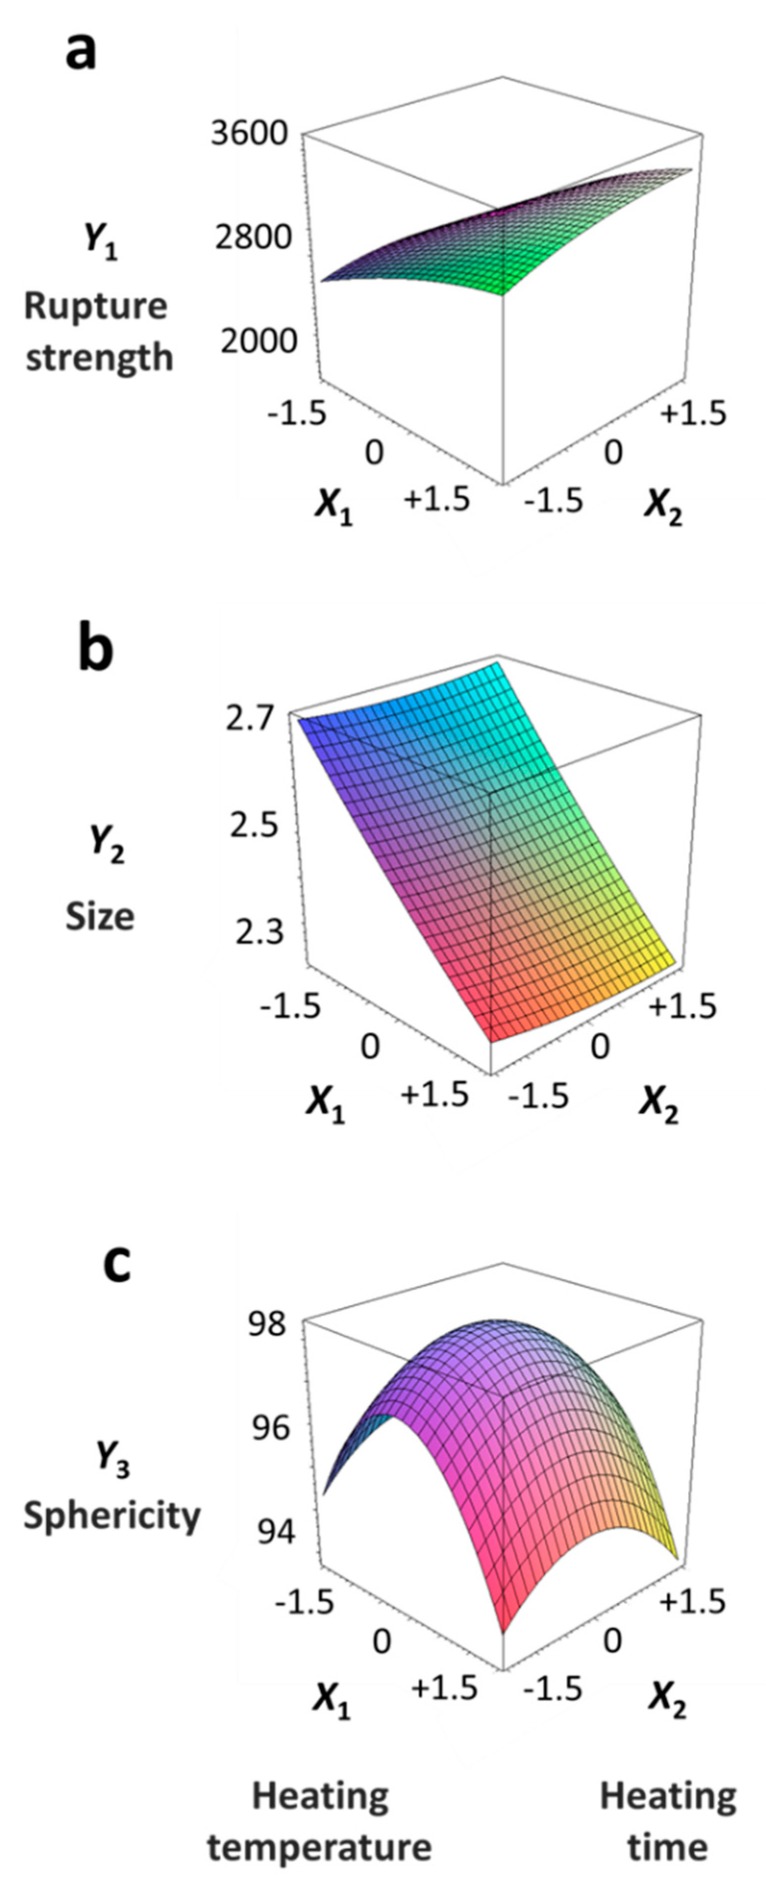
Table 5 provides the calculated data for significance with t-statistic and the estimated coefficients of the linear (X1, X2), quadratic (X1X1, X2X2), and interaction (X1X2) terms for the three dependent variables (Y1, Y2, and Y3). The effects of heating temperature (X1) and heating time (X2) on rupture strength (Y1), size (Y2), and sphericity (Y3) are expressed as a three-dimensional plot (Figure 2). The larger t-value and smaller p-value indicate the significance of parameters [22].
Table 5.
Estimated coefficients of the fitted quadratic polynomial equations for dependent variables based on the t-statistic.
| Parameters |
Y1
Rupture Strength (kPa) |
|||
| Coefficient | Square Error | t-Value | p-Value | |
| Constant | 3090 | 110 | 28.07 | 0.001 |
| X1 | 431.7 | 67.4 | 6.41 | 0.001 * |
| X2 | –157.1 | 67.4 | –2.33 | 0.067 |
| X1X1 | –38.1 | 80.2 | -0.48 | 0.654 |
| X2X2 | –35.1 | 80.2 | –0.44 | 0.680 |
| X1X2 | 59.8 | 95.3 | 0.63 | 0.558 |
| Parameters |
Y2
Size (mm) |
|||
| Coefficient | Square Error | t -Value | p-Value | |
| Constant | 2.4667 | 0.0438 | 56.28 | 0.001 |
| X1 | –0.1689 | 0.0268 | –6.29 | 0.001 * |
| X2 | –0.0073 | 0.0268 | –0.27 | 0.797 |
| X1X1 | 0.0073 | 0.0319 | 0.23 | 0.828 |
| X2X2 | 0.0073 | 0.0319 | 0.23 | 0.828 |
| X1X2 | –0.0075 | 0.0380 | –0.20 | 0.851 |
| Parameters |
Y3
Sphericity (%) |
|||
| Coefficient | Square Error | t-Value | p-Value | |
| Constant | 98.300 | 0.241 | 407.54 | 0.001 |
| X1 | –0.369 | 0.148 | –2.50 | 0.055 |
| X2 | –0.172 | 0.148 | –1.16 | 0.298 |
| X1X1 | –1.388 | 0.176 | –7.89 | 0.001 * |
| X2X2 | –0.663 | 0.176 | –3.77 | 0.013 * |
| X1X2 | –0.025 | 0.209 | –0.12 | 0.909 |
X1: Heating temperature (°C), X2: Heating time (min), * Significant at p < 0.05.
Figure 2.
Three-dimensional response surface plots for rupture strength (a), size (b), and sphericity (c). X1; Heating temperature (°C), X2; Heating time (min).
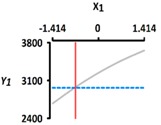
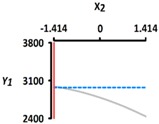
The rupture strength (Y1) increased when the heating temperature (X1) increased from 40 °C (−1.414) to 100 °C (+1.414); Y1 decreased when heating time (X2) increased from 5 min (−1.414) to 60 min (+1.414) (Figure 2a). The linear term for Y1 was significant (p < 0.01), while their square terms and interaction terms were not significant (p > 0.05) (Table 4). The X1 term for Y1 was significant (p < 0.01), while the X2 term for Y1 was not significant (p > 0.05) (Table 5). We found that the heating temperature (X1) is a significant factor affecting the rupture strength (Y1); however, there was no statistically significance between rupture strength (Y1) and heating time (X2). This result supports previous study [23], which studied the effect of temperature on the structure of calcium alginate beads. This study shows that the comparison of the mechanical resistance at different temperatures (80, 110, and 130 °C), for the same period (0, 5, 10, 15, and 20 min) of incubation, shows that a higher resistance is always obtained at the higher temperature. A previous study also reported that the hardness of the alginate-guar gels mixed with pimiento pulp significantly increased when applying thermal treatment (80 °C for 15 min) [24]. The authors reported that the increase in hardness of the alginate-guar gels originated from the occurrence of gel shrinkage, making them more compact during heat treatment [24].
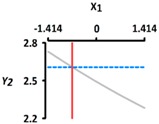
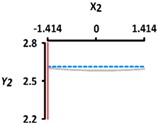
The size (Y2) sharply decreased with an increase in the heating temperature (X1) from 40 °C (−1.414) to 100 °C (+1.414); however, there was no significant relationship between size (Y2) and heating time (X2) from 5 min (−1.414) to 60 min (+1.414) (p > 0.05) (Figure 2b). The linear terms for Y2 were significant (p < 0.01), while their square terms and interaction terms were not significant (p > 0.05) (Table 4). The X1 term for Y2 was significant (p < 0.01), while X2 term for Y2 was not significant (p > 0.05) (Table 5). Here, it is apparent that heating temperature (X1) is a significant factor affecting the size (Y2); however, there was no significant relationship between the size (Y2) and heating time (X2). This finding is consistent with previous study results [25], where the average bead size, after 30 min of heat treatment (90 °C), was showing 0.3 mm (3.62 mm to 3.32 mm) of shrinkage. Likewise, other authors [23] found that the reduction in bead size clearly depends on both time (0, 5, 10, 15, and 20 min) and temperature (80, 110, and 130 °C). The size reduction may be related to water loss [26,27,28]. As the CAG beads were heated, there was a greater amount of water exuded and therefore, greater the size reduction.
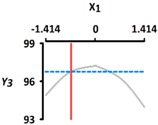
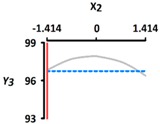
The sphericity (Y3) increased as the coded values of independent variables approached zero (Figure 2c). The linear and interaction terms for Y3 were not significant (p > 0.05), while their square terms were significant (p < 0.01) (Table 4). The linear and interaction terms for Y3 were not significant a (p > 0.05), while their square terms were significant (p < 0.01) (Table 5). Previous authors [7] found that caviar analogs using CAG had sphericities ranging from 90% to 100%, measured with a digital microscope, and could not be differentiated with the naked eye. In Figure 2, the CAG beads after heat treatment from 40 °C (−1.414) to 100 °C (+1.414) showed sphericities ranging from 94% to 97%. We believe, therefore, that the change of heating temperature and heating time did not significantly affect the sphericity of the CAG beads, as they retained their spheroid shape.
In conclusion, the rupture strength (Y1) and size (Y2) affected dependent variables, with heating temperature (X1) being the most important factor. In addition, as the CAG beads’ heating temperature (X1) increased, the rupture strength (Y1) increased and the size (Y2) decreased.
3.3. Microstructure
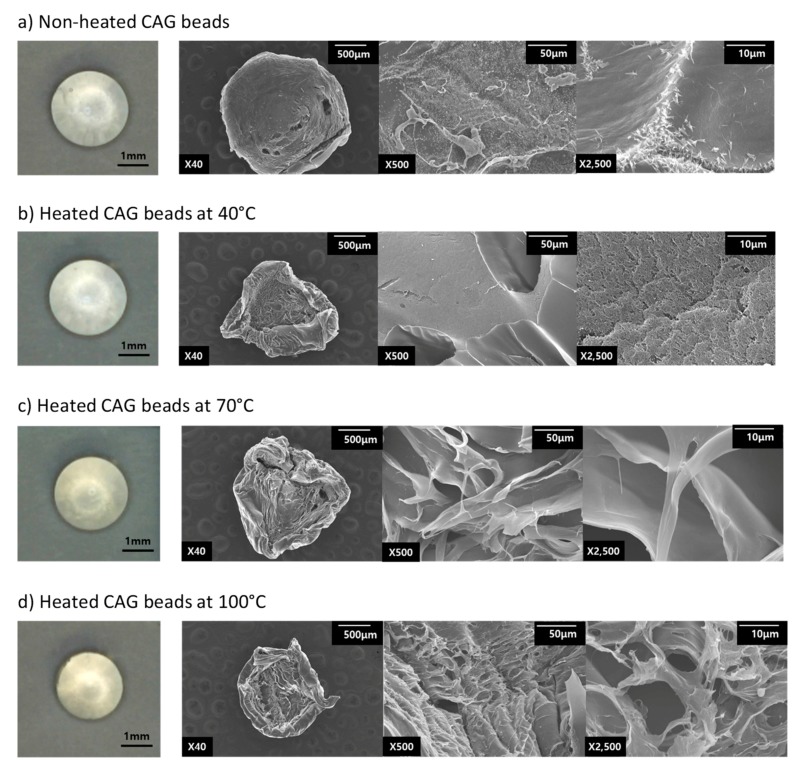
To better understand the effects of heat treatment on physical properties of CAG beads, we analyzed the microstructure of the CAG beads through SEM image. For this, freeze-dried CAG beads were used and were compared with CAG beads heated at 40, 70, and 100 °C (Figure 3). Digital microscope observations showed that in both the unheated and heated tests, the CAG beads retained their spheroid shape. However, the freeze-dried CAG beads did not retain their spheroid shape. We believe that the water loss during freeze-drying involves shrinkage and deformation of CAG beads dimension, which increases the particle density [29]. The CAG beads after heat treatment presented an altered structure when compared to unheated CAG beads’ structure. Unheated CAG beads are homogeneous and smooth (Figure 3a) because they did not lose water. Conversely, after heat treatment, the CAG beads have a greater porous structure (Figure 3b–d) because they lost water. When the heating temperature (X1) increased from 70 °C to 100 °C, the CAG beads gradually formed a more compact gel network with a homogeneous distribution of small pores, while the CAG beads, after heat treatment at 40 °C exhibited void pores. The change of microstructure in the CAG beads could explain the change in physical properties. Our findings reveal that at higher temperatures, the rupture strength increased (Table 2). This indicates that water loss leads to a more dense porous structure, thus increasing rupture strength. In Table 6, the density of unheated CAG beads and that of heated CAG beads at 40, 70, and 100 °C was calculated. These findings provide evidence that the increase in rupture strength was due to an increase in the density [30]. A similar microstructure was observed previously [31] and a higher strength of gel microstructure was more uniform and continuous with smaller voids.
Figure 3.
Digital microscope (left), and SEM (right) photographs of CAG beads frozen in liquid nitrogen and freeze-dried: (a) before heat treatment CAG bead; (b) CAG beads were heated at 40 °C; (c) CAG beads were heated at 70 °C; (d) CAG beads were heated at 100 °C. Magnification of the images are 40×, 500×, and 2500×.
Table 6.
Density (g/cm3) of CAG beads.
| Heating Temperature (°C) | Before Heat Treatment | 40 °C | 70 °C | 100 °C |
|---|---|---|---|---|
| Density (g/cm3) | 1.17 ± 0.07 | 1.02 ± 0.03 * | 1.04 ± 0.04 * | 1.26 ± 0.05 |
* p < 0.05 compared to the before heat treatment (Dunnett’s test).
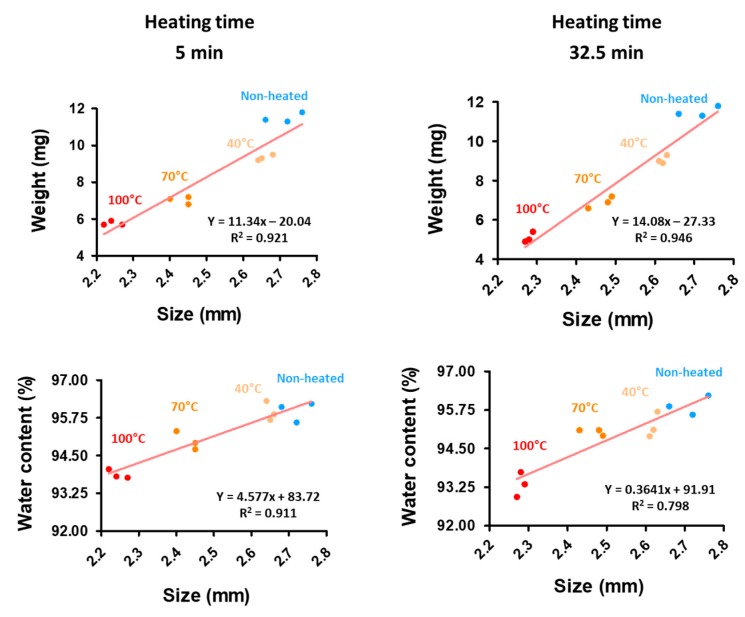
Heating at 70 and 100 °C significantly reduced the CAG bead size believed to result from water loss [26,27,28]. Thus, we believe that syneresis, a phenomenon whereby water molecules are exuded out of a gel matrix because of an external force that contracts the gel, occurs when treated with heat [11,32]. We investigated whether this size reduction was correlated to water leakage, water content, size, and weight of the CAG beads after heat treatment at 40, 70, and 100 °C for 5 min to 32.5 min (Figure 4). The size (Y2) and weight were correlated (R2 = 0.921, 0.946). Here, data show that the higher the heated temperature of the CAG beads, the more significant the size (Y2) and weight reduction. Moreover, size (Y2) and water content were correlated (R2 = 0.911, 0.798). However, the water content of the CAG beads decreased as the heat treatment increased. The weight of the non-heated CAG beads was 11.5 mg and the weight of the heated CAG beads at 100 °C was 5.8 mg. The water content of the non-heated CAG beads was 95.9%, while that of the CAG beads heated at 100 °C was 93.3%. Our findings reveal that the absolute water content 11.03 mg was reduced to 5.39 mg and there was a 51.2% water loss.
Figure 4.
Correlation between weight (mg) and size (mm), water content (%), and size (mm) at 5 min; and weight (mg) and size (mm), water content (%), and size (mm) at 32.5 min.
In conclusion, the SEM images, with the water content, weight, and size correlations show that the denser the structure of the CAG beads after exposure to higher heating temperatures, the less available space there is for water, resulting in an increased rupture strength and reduced size.
3.4. Optimal Conditions and Verification
In the food industry, it is recommended that minimum changes occur in foods prepared with CAG during thermal processes such as sterilization, cooking, and manufacturing. Therefore, in this study, three optimized heat-treated CAG beads were prepared to give similar results as non-heated CAG beads considering the rupture strength (Y1), size (Y2), and sphericity (Y3) and were verified (Table 7). The optimal conditions, including the coded and uncoded values of the independent variables, are shown in Table 8. The optimal conditions indicated that the rupture strength (Y1), size (Y2), and sphericity (Y3) of the unheated CAG beads were 3450 ± 112.47 kPa, 2.60 ± 0.05 mm, and 96.5 ± 2.14%, respectively. According to the results of CCD, the optimal conditions of X1 (heating temperature) and X2 (heating time) were −0.6649 (56.0371 °C) and −1.414 (5 min), respectively. To facilitate the operation, the optimal process conditions of heating time and temperature were 56 °C and 5 min, respectively. The predicted values of Y1, Y2, and Y3 for each optimal condition were 2993 kPa, 2.60 mm, and 96.8%, respectively. To verify the accuracy of the predicted Y1, Y2, and Y3 values, the CAG beads were prepared under each of the optimal conditions and tested. Percentage error evaluation is helpful in establishing the validity of generated model equations and also to describe the domain of applicability of the optimization model [33]. The experimental values of Y1, Y2, and Y3 were 2844 ± 66.64 kPa, 2.55 ± 0.02 mm, and 96.0 ± 2.25%, respectively, similarly to the predicated values, with error values of 4.98, 1.92, and 0.83, respectively (Table 9).
Table 7.
The rupture strength, size, and sphericity of before heat treatment CAG beads.
| Y1 Rupture Strength (kPa) |
Y2 Size (mm) |
Y3 Sphericity (%) |
|
|---|---|---|---|
| Before heat treatment | 3450 ± 112.50 | 2.60 ± 0.05 | 96.5 ± 2.15 |
Table 8.
Response optimization for processing a heated CAG beads similar result to non-heated CAG beads conditions.
| Optimal Conditions | X1 Heating Temperature (°C) |
X2 Heating Time (min) |
|||
|---|---|---|---|---|---|
| Coded Value | Actual Value | Coded Value | Actual Value | ||
| –0.665 | 56.0 | –1.414 | 5 | ||
| Y1 Rupture strength (kPa) |
Target value |
|
|
||
| 3450 | |||||
| Y2 Size (mm) |
Target value |
|
|
||
| 2.60 | |||||
| Y3 Sphericity (%) |
Target value |
|
|
||
| 96.5 | |||||
Table 9.
Experimental and predicted results of verification under optimized conditions.
| Y1 Rupture Strength (kPa) |
Y2 Size (mm) |
Y3 Sphericity (%) |
|
|---|---|---|---|
| Predicted values | 2993 | 2.60 | 96.8 |
| Experimental values | 2844 ± 66.64 | 2.55 ± 0.02 | 96.0 ± 2.25 |
| Error (%) | 4.98 | 1.92 | 0.83 |
Optimized conditions: heating temperature = 100 °C; heating time = 31 min. Error (%) = [Difference between predicted value and actual value/Predicted value] × 100.
4. Conclusions
Calcium alginate gel (CAG) is used to make artificial or imitative foods because of its unique gelling abilities and is a promising biomaterial in the food industry. In the food industry, it is important to verify stability and process suitability for artificial or imitative foods using CAG; the effects of heat treatment on the physical properties of CAG beads can be utilized in several ways. Our findings reveal that the heating temperature (X1) was the factor that had the greatest effect on the rupture strength (Y1) and size (Y2). The CAG beads increased in rupture strength and decreased in size as the heating temperature increased because of water loss. RSM was successfully employed to optimize the non-heated CAG beads. Under each optimal condition, Y1, Y2, and Y3 were 2844 ± 66.64 kPa, 2.55 ± 0.02 mm, and 96.0 ± 2.25%, respectively. Our results indicate that the heat treatment of CAG can be used not only for sterilization and cooking but also as a processing technique by controlling the physical properties.
Author Contributions
Contributed to experimental work and wrote the manuscript, S.K.; Contributed to the experimental design of the study, C.J.; Designing experiments and writing editing the manuscript, S.C.; Supervised this study and revised the manuscript, S.-B.K.
Funding
This work was supported by a research grant of Pukyong National University (2019).
Conflicts of Interest
The authors declare no conflicts of interest.
References
- 1.Leong J.Y., Lam W.H., Ho K.W., Voo W.P., Lee M.F.X., Lim H.P., Lim S.L., Tey B.T., Poncelet D., Chan E.S. Advances in Fabricating Spherical Alginate Hydrogels with Controlled Particle Designs by Ionotropic Gelation as Encapsulation Systems. Particuology. 2016;24:44–60. doi: 10.1016/j.partic.2015.09.004. [DOI] [Google Scholar]
- 2.Tavassoli-Kafrani E., Shekarchizadeh H., Masoudpour-Behabadi M. Development of Edible Films and Coatings from Alginates and Carrageenans. Carbohydr. Polym. 2016;137:360–374. doi: 10.1016/j.carbpol.2015.10.074. [DOI] [PubMed] [Google Scholar]
- 3.Yang J.S., Xie Y.J., He W. Research Progress on Chemical Modification of Alginate: A Review. Carbohydr. Polym. 2011;84:33–39. doi: 10.1016/j.carbpol.2010.11.048. [DOI] [Google Scholar]
- 4.Lopez-Sanchez P., Fredriksson N., Larsson A., Altskär A., Ström A. High Sugar Content Impacts Microstructure, Mechanics and Release of Calcium-Alginate Gels. Food Hydrocoll. 2018;84:26–33. doi: 10.1016/j.foodhyd.2018.05.029. [DOI] [Google Scholar]
- 5.Zactiti E.M., Kieckbusch T.G. Potassium Sorbate Permeability in Biodegradable Alginate Films: Effect of the Antimicrobial Agent Concentration and Crosslinking Degree. J. Food Eng. 2006;77:462–467. doi: 10.1016/j.jfoodeng.2005.07.015. [DOI] [Google Scholar]
- 6.Lee K.Y., Mooney D.J. Alginate: Properties and Biomedical Applications. Prog. Polym. Sci. 2012;37:106–126. doi: 10.1016/j.progpolymsci.2011.06.003. [DOI] [PMC free article] [PubMed] [Google Scholar]
- 7.Ji C., Cho S., Gu Y., Kim S. The Processing Optimization of Caviar Analogs Encapsulated by Calcium-Alginate Gel Membranes. Food Sci. Biotechnol. 2007;16:557–564. [Google Scholar]
- 8.Ha B.B., Jo E.H., Cho S., Kim S.B. Production Optimization of Flying Fish Roe Analogs Using Calcium Alginate Hydrogel Beads. Fish. Aquat. Sci. 2016;19:1–7. doi: 10.1186/s41240-016-0031-y. [DOI] [Google Scholar]
- 9.Roh H.-J., Jo E.-H., Kim H.-D., Kim S.-B. Effects of Physicochemical Parameters on Production of Cooked Rice Analogs by Calcium Alginate Gels. Korean J. Fish. Aquat. Sci. 2016;49:20–25. doi: 10.5657/KFAS.2016.0020. [DOI] [Google Scholar]
- 10.Madoumier M., Trystram G., Sébastian P., Collignan A. Towards a holistic approach for multi-objective optimization of food processes: A critical review. Trends Food Sci. Tech. 2019;86:1–15. doi: 10.1016/j.tifs.2019.02.002. [DOI] [Google Scholar]
- 11.Ching S.H., Bansal N., Bhandari B. Alginate gel particles–A review of production techniques and physical properties. Crit. Rev. Food Sci. Nutr. 2017;57:1133–1152. doi: 10.1080/10408398.2014.965773. [DOI] [PubMed] [Google Scholar]
- 12.Erbay Z., Icier F. Optimization of hot air drying of olive leaves using response surface methodology. J. Food Eng. 2009;91:533–541. doi: 10.1016/j.jfoodeng.2008.10.004. [DOI] [Google Scholar]
- 13.Jancy S., Shruthy R., Preetha R. Fabrication of packaging film reinforced with cellulose nanoparticles synthesised from jack fruit non-edible part using response surface methodology. Int. J. Biol. Macromol. 2019 doi: 10.1016/j.ijbiomac.2019.09.066. in press. [DOI] [PubMed] [Google Scholar]
- 14.Said K.A.M., Amin M.A.M. Overview on the response surface methodology (RSM) in extraction processes. J. Appl. Sci. Process Eng. 2015;2 [Google Scholar]
- 15.Bezerra M.A., Santelli R.E., Oliveira E.P., Villar L.S., Escaleira L.A. Response Surface Methodology (RSM) as a Tool for Optimization in Analytical Chemistry. Talanta. 2008;76:965–977. doi: 10.1016/j.talanta.2008.05.019. [DOI] [PubMed] [Google Scholar]
- 16.Ba D., Boyaci I.H. Modeling and Optimization i: Usability of Response Surface Methodology. J. Food Eng. 2007;78:836–845. [Google Scholar]
- 17.Cho S.M., Gu Y.S., Kim S.B. Extracting Optimization and Physical Properties of Yellowfin Tuna ( Thunnus Albacares ) Skin Gelatin Compared to Mammalian Gelatins. Food Hydrocoll. 2005;19:221–229. doi: 10.1016/j.foodhyd.2004.05.005. [DOI] [Google Scholar]
- 18.Shishir M.R.I., Taip F.S., Aziz N.A., Talib R.A., Sarker M.S.H. Optimization of spray drying parameters for pink guava powder using RSM. Food Sci. Biotechnol. 2016;25:461–468. doi: 10.1007/s10068-016-0064-0. [DOI] [PMC free article] [PubMed] [Google Scholar]
- 19.Noshadi I., Amin N.A.S., Parnas R.S. Continuous production of biodiesel from waste cooking oil in a reactive distillation column catalyzed by solid heteropolyacid: Optimization using response surface methodology (RSM) Fuel. 2012;94:156–164. doi: 10.1016/j.fuel.2011.10.018. [DOI] [Google Scholar]
- 20.Isa K.M., Daud S., Hamidin N., Ismail K., Saad S.A., Kasim F.H. Thermogravimetric Analysis and the Optimisation of Bio-Oil Yield from Fixed-Bed Pyrolysis of Rice Husk Using Response Surface Methodology (RSM) Ind. Crops. Prod. 2011;33:481–487. doi: 10.1016/j.indcrop.2010.10.024. [DOI] [Google Scholar]
- 21.Bimakr M., Rahman R.A., Ganjloo A., Taip F.S., Salleh L.M., Sarker M.Z.I. Optimization of Supercritical Carbon Dioxide Extraction of Bioactive Flavonoid Compounds from Spearmint (Mentha Spicata L.) Leaves by Using Response Surface Methodology. Food Bioprocess Tech. 2012;5:912–920. doi: 10.1007/s11947-010-0504-4. [DOI] [Google Scholar]
- 22.Bahrani S., Razmi Z., Ghaedi M., Asfaram A., Javadian H. Ultrasound-accelerated synthesis of gold nanoparticles modified choline chloride functionalized graphene oxide as a novel sensitive bioelectrochemical sensor: Optimized meloxicam detection using CCD-RSM design and application for human plasma sample. Ultrason. Sonochem. 2018;42:776–786. doi: 10.1016/j.ultsonch.2017.12.042. [DOI] [PubMed] [Google Scholar]
- 23.Serp D., Mueller M., Von Stockar U., Marison I.W. Low-Temperature Electron Microscopy for the Study of Polysaccharide Ultrastructures in Hydrogels. II. Effect of Temperature on the Structure of Ca2+-Alginate Beads. Biotechnol. Bioeng. 2002;79:253–259. doi: 10.1002/bit.10287. [DOI] [PubMed] [Google Scholar]
- 24.Mousavi S.M.R., Rafe A., Yeganehzad S. Textural, Mechanical, and Microstructural Properties of Restructured Pimiento Alginate-Guar Gels. J. Texture Stud. 2019;50:155–164. doi: 10.1111/jtxs.12385. [DOI] [PubMed] [Google Scholar]
- 25.Woo J.W., Roh H.J., Park H.D., Lee Y.B., Kim S.B., Ji C.I. Sphericity Optimization of Calcium Alginate Gel Beads and the Effects of Processing Conditions on Their Physical Properties. Food Sci. Biotechnol. 2007;16:715–721. [Google Scholar]
- 26.Singh D., Tripathi A., Zo S.M., Singh D., Han S.S. Synthesis of Composite Gelatin-Hyaluronic Acid-Alginate Porous Scaffold and Evaluation for in Vitro Stem Cell Growth and in Vivo Tissue Integration. Colloids Surf. B. 2014;116:502–509. doi: 10.1016/j.colsurfb.2014.01.049. [DOI] [PubMed] [Google Scholar]
- 27.Zohuriaan M.J., Shokrolahi F. Thermal Studies on Natural and Modified Gums. Polym. Test. 2004;23:575–579. doi: 10.1016/j.polymertesting.2003.11.001. [DOI] [Google Scholar]
- 28.Yang H., Li H., Zhai J., Sun L., Zhao Y., Yu H. Magnetic Prussian Blue/Graphene Oxide Nanocomposites Caged in Calcium Alginate Microbeads for Elimination of Cesium Ions from Water and Soil. Chem. Eng. J. 2014;246:10–19. doi: 10.1016/j.cej.2014.02.060. [DOI] [Google Scholar]
- 29.Vargas P.O., Pereira N.R., Guimarães A.O., Waldman W.R., Pereira V.R. Shrinkage and Deformation during Convective Drying of Calcium Alginate. LWT Food Sci. Technol. 2018;97:213–222. doi: 10.1016/j.lwt.2018.06.056. [DOI] [Google Scholar]
- 30.Sun-Waterhouse D., Wang W., Waterhouse G.I. Canola oil encapsulated by alginate and its combinations with starches of low and high amylose content: Effect of quercetin on oil stability. Food Bioprocess Tech. 2014;7:2159–2177. doi: 10.1007/s11947-013-1163-z. [DOI] [Google Scholar]
- 31.Mishyna M., Martinez J.J.I., Chen J., Davidovich-Pinhas M., Benjamin O. Heat-Induced Aggregation and Gelation of Proteins from Edible Honey Bee Brood (Apis Mellifera) as a Function of Temperature and PH. Food Hydrocoll. 2019;91:117–126. doi: 10.1016/j.foodhyd.2019.01.017. [DOI] [Google Scholar]
- 32.Roopa B.S., Bhattacharya S. Alginate Gels: Ii. Stability at Different Processing Conditions. J. Food Process Eng. 2010;33:466–480. doi: 10.1111/j.1745-4530.2008.00285.x. [DOI] [Google Scholar]
- 33.Malakar J., Nayak A.K., Pal D. Development of cloxacillin loaded multiple-unit alginate-based floating system by emulsion–gelation method. Int. J. Biol. Macromol. 2015;50:138–147. doi: 10.1016/j.ijbiomac.2011.10.001. [DOI] [PubMed] [Google Scholar]


