

Abstract
Objective
Standard approaches for large scale phenotypic screens using electronic health record (EHR) data apply thresholds, such as ≥2 diagnosis codes, to define subjects as having a phenotype. However, the variation in the accuracy of diagnosis codes can impair the power of such screens. Our objective was to develop and evaluate an approach which converts diagnosis codes into a probability of a phenotype (PheProb). We hypothesized that this alternate approach for defining phenotypes would improve power for genetic association studies.
Methods
The PheProb approach employs unsupervised clustering to separate patients into 2 groups based on diagnosis codes. Subjects are assigned a probability of having the phenotype based on the number of diagnosis codes. This approach was developed using simulated EHR data and tested in a real world EHR cohort. In the latter, we tested the association between low density lipoprotein cholesterol (LDL-C) genetic risk alleles known for association with hyperlipidemia and hyperlipidemia codes (ICD-9 272.x). PheProb and thresholding approaches were compared.
Results
Among n = 1462 subjects in the real world EHR cohort, the threshold-based p-values for association between the genetic risk score (GRS) and hyperlipidemia were 0.126 (≥1 code), 0.123 (≥2 codes), and 0.142 (≥3 codes). The PheProb approach produced the expected significant association between the GRS and hyperlipidemia: p = .001.
Conclusions
PheProb improves statistical power for association studies relative to standard thresholding approaches by leveraging information about the phenotype in the billing code counts. The PheProb approach has direct applications where efficient approaches are required, such as in Phenome-Wide Association Studies.
Keywords: electronic health records, genetic association test, low-density lipoprotein, rheumatoid arthritis, mixture model, phenome-wide association study
Introduction
Electronic health records (EHRs) contain a wealth of comprehensive patient information. When linked with genomic data, the combined information provides a powerful platform to study associations between genetic variants and a variety of diseases, disorders, and other conditions. Ideally, disease cases and controls in large, diverse populations would be identified automatically using data in the EHR, and linked to genetic markers assessed on collected blood samples.1 However, there is currently a mismatch wherein the ability to extract accurate information about patient phenotypes from EHRs lags behind genotyping.2 For example, although EHRs often contain diagnosis codes for specific diseases, the presence or absence of these codes is not perfectly correlated with the presence or the absence of the disease. Previous studies have successfully replicated established genetic associations by building phenotyping algorithms using both structured data such as diagnosis codes and unstructured data such as physicians' notes accessed by natural language processing.3–6 A major limitation of these approaches is the requirement for labor intensive chart review to establish gold standard labels on a subset of cases. Such approaches are difficult to scale when multiple phenotypes are of interest.
In particular, with the increasing availability of large cohorts with linked EHR and genetic data, there is growing interest in screening for associations between a genetic marker of interest and a wide range of clinical phenotypes—that is, in performing a Phenome-Wide Association Study (PheWAS).3,7–20 In a PheWAS, developing highly accurate algorithms incorporating structured and unstructured EHR data for each phenotype is not feasible. Instead, researchers typically rely on available structured data such as demographic information and International Classification of Diseases (ICD) billing and diagnosis codes (frequently ICD-9 or ICD-10, signifying the Ninth or Tenth Revisions of the Classification system, respectively). In the most common PheWAS approach, these codes are collapsed across time and stored as counts for each code for each individual. Tens of thousands of ICD codes can then be converted into a smaller number of phenotypes, as proposed in Denny et al.9,15—the phenotype billing code counts created by this conversion are typically called PheWAS codes. For each phenotype, “cases” are individuals with at least one relevant billing code and “controls” are individuals with zero codes (and sometimes without codes for other related phenotypes). With this approach, Denny et al.9 successfully replicated 4 of 7 known disease-SNP associations at the 0.05 level.
For the 3 associations that did not replicate in Denny et al., they noted that identifying cases as individuals with at least 1 relevant ICD-9 code was not a stringent enough definition; many of these “cases” did not have the disease when their medical records were manually reviewed. For these diseases, the “case” definition that was used had low positive predictive value (PPV). Indeed, the reliability of using the presence of any relevant billing code as a proxy for presence of the phenotype varies by phenotype and health care system.21,22 Subsequent studies proposed adaptations of this approach to improve the PPV, such as requiring at least 2 billing codes on 2 different days;13,20,23 or a number of billing codes that differs depending on disease frequency;10,19 or 2, 3, or 5 billing codes in total.12,16–18,24 While these more stringent definitions improve the PPV of the case identification, they can also reduce power by eliminating some true cases, which can be problematic for uncommon phenotypes. These studies identify a gap in knowledge regarding an efficient approach for determining the optimal threshold. Moreover, collapsing a billing code count into a binary case-control status, and not accounting for total healthcare usage that can vary dramatically among patients, may eliminate information that could better distinguish cases and controls.
In this study, we propose an automated approach for using diagnosis codes that avoids setting an arbitrary threshold on the number of codes required to define a “case” by instead converting the diagnosis codes into a probability of a phenotype through unsupervised clustering (PheProb). We will compare the performance of genetic association testing with PheProb-defined phenotypes and threshold-based phenotypes in simulated and real world EHR data. Using known associations, we hypothesize that the PheProb approach will demonstrate stronger genotype-phenotype associations than with the thresholding approach.
Methods
Development of Methods for PheProb
We used simulated data that mimicked the patterns of real EHR data, but with gold standard phenotype labels available, to compare the performance of PheProb with the performance of threshold-based methods. The dataset contained 2000 patients with EHR data linked with genotype data; each patient had a single nucleotide polymorphism (SNP) value—0, 1, or 2 minor alleles—and a single normally distributed clinical covariate. Disease status was generated so that the probability of having the disease depended on the value of the SNP and the covariate; we considered both weak (odds ratio [OR] =1.1), and moderate (OR = 1.35) disease-SNP associations. We also varied disease prevalence: 20%, 10%, and 5%. The total number of billing codes for each patient was randomly generated, and the number of disease PheWAS codes was generated from a binomial distribution with sample size equal to the total number of billing codes and success probability dependent on the underlying disease status.
In the standard PheWAS, disease cases are assigned by thresholding the relevant billing codes using a cut-off, as was proposed in Denny et al. (2010).9,15 Thus, as a comparison for our approach we applied the standard PheWAS thresholds of ≥ 1, ≥ 2, and ≥ 3 ICD codes to define a disease case; individuals with no ICD codes were controls. To perform the genetic association test, we tested for association between the SNP and case-control status, with cases defined by the 3 thresholds; the 3 models are denoted by S1, S2, and S3.
The proposed PheProb method applies a different approach to define disease status and perform the genetic association test. A diagram of the workflow of this two-step approach is provided in Figure 1.
Figure 1.

Workflow of the PheProb method. True disease status of patients is unknown; instead, the number of billing codes for each disease is observed. The PheProb method clusters individuals based on billing codes, and tests for an association between a genetic marker such as a SNP and the clustering-based probability of being a case.
In Step 1, we fit a mixture model to the disease-relevant billing code count variable, , assuming 2 latent classes—cases () and controls (). Specifically, we assume that there are 2 underlying classes, and that within each class, follows a binomial distribution, , with parameters , the total number of billing code counts, and if the patient is a disease case or if the patient is a control. Thus, the model accounts for the total healthcare utilization, as quantified by the total number of billing codes , by interpreting the count of relevant billing codes as a subset of in these class-specific binomial models. The probability of belonging to the case population is denoted by ; if were a single value, it would represent the underlying prevalence of the disease, but our proposed method benefits from allowing the prevalence to vary somewhat according to total health care utilization . Thus, we let , where the parameters are unknown and is the logistic function. All parameters ( are estimated using the expectation-maximization (EM) algorithm, so that this model can be fit in an unsupervised manner and, thus, does not require any “gold standard” labelling of cases and controls.25–28 After the model is fit and and are estimated, we can calculate the predicted probability that each patient is a disease case by Bayes rule:
Here, we write as shorthand for
In Step 2, we test whether the SNP is associated with the probability of having the phenotype, and calculate a p-value quantifying the strength of that association. Essentially, we calculate the model's predicted probability, , for each individual as defined above, and we use in place of a typical 0/1 outcome in a logistic regression model with the genetic marker and any clinical variables such as age and gender included as covariates in the model. We fit the model using logistic regression estimating equations and calculate a robust variance estimate to use for testing whether there is any association between the disease and the genetic marker, controlling for clinical variables.29
This approach allows the model connecting diagnosis codes and probabilities to differ disease-to-disease based on the features of the disease distributions. A more detailed description of the simulation settings and the statistical models and methods is available in the Supplementary Appendix. Implementation is available in the PheProb R package, available from the authors on request.
Comparison of Existing Methods and PheProb
Simulated data
For each simulated dataset, we applied the standard threshold-based genotype-phenotype association tests, S1, S2, and S3. We also applied our proposed PheProb method. For comparison, we fit a model using the true disease status; while not feasible in practice, this was informative for benchmarking. Simulations were run 500 times for each setting in R30; the flexmix and gee packages were used in our simulations.25–27,29
Example 1: Real-world clinical study and hyperlipidemia
A group of control subjects from a previous EHR genetic study of lipids was used to test PheProb on real world data.31 Briefly, the study consisted of 1462 subjects with clinical EHR data including demographics, diagnosis codes, and genetic data. In the prior study,31 we confirmed that patients carrying more LDL-C risk alleles, aggregated into a composite LDL genetic risk score (GRS), had higher LDL-C levels measured as part of routine care. LDL-C is the target of statins and is considered part of the causal pathway for cardiovascular disease. High LDL-C, or hyperlipidemia, corresponds to ICD-9 codes starting with 272. For this study, all such codes were collapsed into a count of the number of hyperlipidemia-related billing codes. We tested for association between the LDL GRS and the phenotype hyperlipidemia and compared the p-value for association when the phenotype was defined using standard threshold-based methods compared to the proposed PheProb method. All models were adjusted for age and sex.
Example 2: Partners biobank and rheumatoid arthritis
We additionally studied a population where gold standard labels were available for the phenotype rheumatoid arthritis (RA). The Partners Healthcare Biobank comprises 14 985 subjects enrolled from 2011 to 2016 with both clinical EHR data and genetic data.32 For a subset of 546 of these patients, chart review was performed to confirm the presence of the most common autoimmune inflammatory joint disease, rheumatoid arthritis (RA). We extracted data on 2 of the strongest genetic risk alleles for RA, rs9268839 in HLA DRB1 and rs2476601 in PTPN22. The PheWAS codes 714 and 714.1 correspond to RA and other inflammatory polyarthropathies. Based on patients' counts of these codes, we tested whether HLA DRB1 and PTPN22 were associated with RA, adjusting for age, gender and race, using both the standard thresholding method and the PheProb approach.
For the subset of 546 individuals with true RA status known (from manual chart review), we sought to better understand how well the standard thresholding methods and the PheProb clustering step were separating cases and controls. To do this we estimated the false positive rate (FPR), the recall, the precision/PPV, the negative predictive value (NPV), and the F1 score for the threshold-defined case-control status, focusing on S2, the most popular approach in the literature.12,16,18 For PheProb, we estimated the same quantities, after thresholding the method's estimated probability at its mean to define a binary outcome.
Results
Simulated Data Results
In Figure 2, the power to detect the weak (OR = 1.1) and moderate (OR = 1.35) genotype-phenotype associations was compared across all methods. In all settings, the PheProb approach outperformed the current standard threshold-based methods (S1, S2, S3). For example, when the disease prevalence is medium and the association is moderate (OR = 1.35, prevalence = 10%), the power to detect the association with PheProb is 51.0%, while the power levels of S1, S2, and S3 are 8.4%, 10.4%, and 10.8%, respectively. When the association is weaker (OR = 1.1), all tests are less powerful but the relative performance is the same, with PheProb outperforming S1, S2, and S3. As expected the PheProb approach is less powerful when compared to true disease status of all individuals, but the difference in power is modest. For example, in the setting mentioned above, the power when the true disease status is known (true-Y) is 61.6%, which is only 10.6 percentage points higher than PheProb's power of 51.0%. In most of these simulation settings, S3 is more powerful than S1 and S2, but this is not always the case. For example, when the SNP OR = 1.1 and the disease is uncommon (prevalence = 5%), the power of S2 is 6.4% while the power of S3 is 5.4%.
Figure 2.
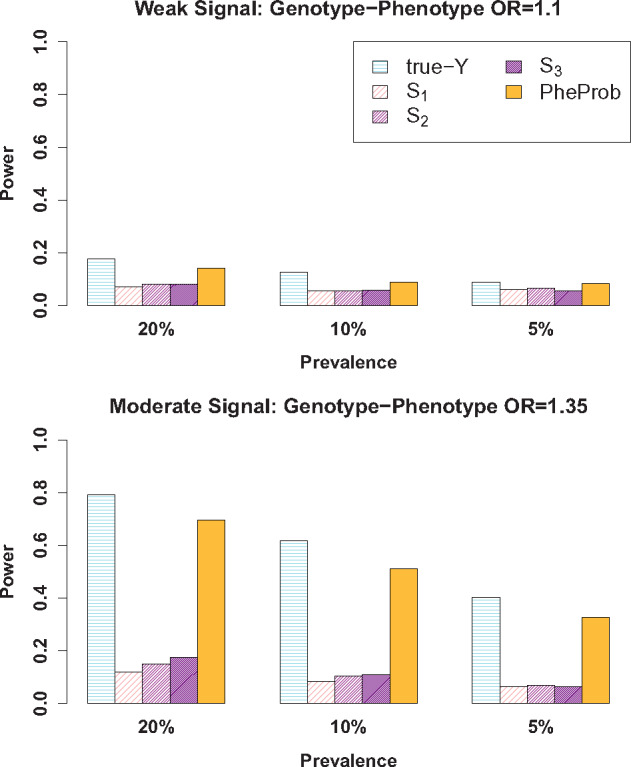
Comparison of power to detect an association between a SNP and a phenotype (a disease) when only S, the count of billing codes, is observed. The standard approaches of thresholding S and identifying disease cases as individuals with more than t billing codes are indicated by St, for t = 1, 2, 3. Our proposed method is indicated by PheProb. A benchmark method is also shown: true-Y, which uses the true disease status as the outcome. Simulation settings vary the prevalence and the strength of the association of interest between disease status and the SNP: OR = 1.1 for a weak relationship and OR = 1.35 for a moderate relationship.
Example 1: Real-world clinical study and hyperlipidemia
Among the 1462 patients in the lipid study, the mean age was 63.6 years and the proportion of female subjects was 80%. Also, 64.7% of this group had at least 1 billing code starting with 272 (Disorders of Lipoid Metabolism); and among those with at least 1 billing code, the median number of billing codes was 8 and the maximum was 171. The results of the genotype-phenotype association tests are presented in Table 1. Using the thresholding method, the p-values for association between the LDL GRS and hyperlipidemia were 0.126, 0.123, and 0.142 for defining cases as having at least 1, 2, or 3 billing codes. Using the PheProb approach we observed the expected significant association between the LDL GRS and hyperlipidemia with a p-value of .001.
Table 1.
Comparison of p-values for genotype-phenotype association tests using thresholding * vs PheProb using real-world EHR data
| Phenotype | n | Genetic Marker | Phenotype-Genotype Association Test Method |
|||
|---|---|---|---|---|---|---|
| S1 | S2 | S3 | PheProb | |||
| Hyperlipidemia (ICD-9 272.x) | 1442 | LDL GRS | 0.126 | 0.123 | 0.142 | 0.001 |
| Rheumatoid Arthritis (ICD-9 714.x except 714.3) | 14 985 | HLA DRB1 | <0.0001 | <0.0001 | <0.0001 | <0.0001 |
| PTPN22 | <0.0001 | <0.0001 | <0.0001 | 0.0002 | ||
, is the thresholding approach where subjects are defined as cases if they have ≥t PheWAS codes.
Example 2: Partners biobank and rheumatoid arthritis
Association between HLA DRB1 or PTPN22 and billing codes for RA
Among the 14 985 patients, 12% had at least 1 diagnosis code for RA. Among those with at least 1 billing code, the median number of billing codes was 14 and the maximum was 838. The results of the genotype-phenotype association tests are presented in Table 1. The p-values for the association between RA and the HLA DRB1 SNP using all three thresholding methods and using the PheProb approach were less than 0.0001; the p-value for the association between the PTPN22 and RA was less than .0001 using the thresholding methods and 0.0002 using the PheProb approach.
Validation
Because the p-values for all methods in this large patient population were small, we sought to better understand how well the standard thresholding methods and the PheProb clustering step were separating cases and controls by comparing accuracy metrics in a group of 546 patients for whom true RA disease status was known through chart review. To identify cases and controls from the PheProb predicted probability of having RA, we simply dichotomized it at its mean. The results are presented in Table 2. The prevalence of RA in the validation set was 8.8%. We found that PheProb better classified individuals without the disease as “controls” (FPR of 0.01 vs 0.06 for S2), and that the individuals classified by PheProb as cases were more likely to truly have RA (precision/PPV of 0.74 vs 0.40 for S2). This improvement in PPV came at a cost of incorrectly classifying 8% of true disease cases as controls (recall of 0.92 vs 1.00), with no reduction in the NPV (the chance that an individual classified as control is truly disease-free; 1.00 vs 1.00). In addition, we found that PheProb outperformed S2 in regards to precision and recall (F1 score of 0.83 vs. 0.57, P < .0001).
Table 2.
Comparison of accuracy measures of case-control identification for RA comparing the standard thresholding method * with PheProb against the true phenotype as defined by chart review
| S2 | PheProb | |
|---|---|---|
| precision/PPV | 0.40 | 0.74 |
| NPV | 1.00 | 1.00 |
| recall | 1.00 | 0.92 |
| FPR | 0.06 | 0.01 |
| F1 score | 0.57 | 0.83 |
, subjects with ≥2 PheWAS codes are defined as cases.
PPV: positive predictive value; NPV: negative predictive value; FPR: false positive rate.
Discussion
The PheProb approach provides a high-throughput, unsupervised method for phenotyping using existing codified data without requiring labor intensive chart review for gold standard labels. In this study, we observed that PheProb, which converts the number of diagnosis codes into a probability for a phenotype, provided more power for genetic association studies using EHR data compared to standard PheWAS thresholding approaches, while maintaining the feasibility of standard approaches by using only structured data. The thresholding approach is limited because of the varying accuracy of diagnosis codes, and PheProb addresses this challenge by using the diagnosis code counts to separate the patients into 2 latent underlying classes—case and controls —in a data-adaptive way while accounting for total health care utilization. This approach in effect normalizes the accuracy of the codes.
PheWASs using the thresholding method have been conducted with different threshold choices, and there does not appear to be a consensus on a best threshold.9,10,12,13,16–20,23,24 Increasing the number of diagnosis codes used to define cases tends to increase the PPV, or the chance that those included as cases do in fact have the disease. However, particularly for uncommon diseases, this may result in a loss of statistical power when testing for the SNP-disease association, since it reduces the number of individuals included in the test. We observed loss of power with higher thresholding in the simulations with an uncommon phenotype (prevalence = 5%): with SNP OR = 1.1, the power of S2 was 6.4% while the power of S3 was 5.4%. In this scenario, the benefit of improving the PPV of the case definition by requiring more billing codes is likely outweighed by the power lost by losing some true disease cases. Converting a quantitative variable such as the billing code count to a binary variable can also result in loss of information even if a best threshold were determined, since more codes likely reflect a more certain disease status or greater disease severity. The PheProb method avoids many of these issues by using the billing code counts directly as a quantitative variable, letting the data drive the clustering into cases and controls.
The thresholding method also does not take into account differing levels of health care utilization. We believe incorporating total health care utilization into PheProb, as quantified by the total number of billing codes, enhances performance because the amount of utilization can vary dramatically across patients. Total health care utilization can affect the informativeness of certain billing codes, particularly for diseases that may have many diagnostic tests. For example, an individual with 10 total billing codes, 5 of them for hyperlipidemia, may be more likely to be a case than an individual with 1000 total codes, 5 of which are for hyperlipidemia.
In the PheProb approach, the actual test for association is performed between the SNP and the estimated probability of having the phenotype. This eliminates the need to select a threshold to define case-control status, and carries forward into the association test some information about classification uncertainty as encoded in the estimated probability of disease. Individuals with many billing codes are assigned high probability of having the disease; those with no codes are assigned low probability; and those with a moderate number can have a probability in the middle, where “moderate” is determined in the data-driven clustering and will be slightly different for different phenotypes. Retaining this algorithmic classification uncertainty rather than thresholding has been shown to improve power in other EHR settings.33
In the example of RA, where a gold standard was available for comparison, we found that the probability of being a case from the PheProb approach better distinguished cases and controls than the standard thresholding method. That is, identifying cases as patients with above average PheProb probability was a more accurate case definition than identifying cases as patients with more than 2 ICD-9 code counts (F1 score of 0.83 vs. 0.57, p < .0001). This is likely because the clustering step seeks to separate cases and controls in a data-adaptive way, and uses both information in the disease-relevant billing codes and the total billing codes in the clustering, rather than using a fixed threshold on just the relevant billing codes.
As detailed here, many aspects of the PheProb approach were designed to improve genetic association test power: leveraging the diagnosis code counts as a quantitative variable instead of dichotomizing it; integrating healthcare utilization in the structure of the mixture model; and using the continuous model-predicted probability of being a disease case as an outcome instead of thresholding it to identify case-control status. Unfortunately, it is difficult to disentangle the impacts on power of each of these aspects. For example, a patient's healthcare utilization enters the method as a parameter in the binomial mixture model; avoiding reliance on would necessitate using a different parametric mixture model, but performance differences due to the change in model and the reliance on cannot be rigorously disentangled. Similarly, we propose using the model-predicted probability rather than a dichotomous outcome in the genetic association test; this is because we feel that the probability better carries forward phenotyping uncertainty into the test, but it is also not obvious how best to dichotomize that predicted probability into a case-control outcome in the absence of any gold-standard outcome data, and whether patients with mid-level predicted probability should be excluded in such a dichotomization.
With no additional covariates (such as age and gender), our genotype-phenotype test is essentially model-free—it is fundamentally testing whether the genotype and phenotype are statistically independent. Thus, it is a valid test across a wide range of true disease-genotype models. With additional covariates, our model is still valid across a wide range of true disease-genotype models so long as the genotype is independent of those covariates. Relaxing this assumption to produce an even more robust test is a direction of future research.
The PheProb method is designed to increase power for studies which rely on (or are limited to using) ICD codes for phenotyping, with direct applications to PheWAS. It was designed for studies screening across hundreds to thousands of phenotypes, where creating individual highly accurate algorithms for each phenotype is not feasible. While it may serve as a starting point for investigators interested in detailed studies on a specific phenotype, it was not designed for this purpose.
Institutions have different EHR systems and different approaches to using those systems. As a result, phenotyping methods typically have varying performance across institutions. This variability is especially notable when phenotyping is based only on thresholded diagnosis codes. For example, using at least 1 code for RA to identify cases was shown to have a PPV of 22%, 26%, and 49% across 3 institutions, while using at least 3 codes was shown to have a PPV of 55%, 42%, and 73% across the same 3 institutions.21 This highlights another difficulty of existing PheWAS methods based on thresholding—even for a single disease, the best threshold for defining a case may vary across institutions. A method like PheProb that has the potential to adapt to the underlying distribution of diagnosis codes at an institution may be effective in the face of this heterogeneity, and further evaluating PheProb's performance and robustness across healthcare systems is a direction of future research.
Conclusions
Compared to the standard PheWAS approach, which defines phenotypes using a certain number of diagnosis codes, the PheProb approach provides more power to study genotype-phenotype associations by retaining information on the count of billing codes defining the phenotype normalized by health care utilization information, and providing a probability of a phenotype rather than a binary case-control status for association testing. In sum, PheProb is a scalable method for rapid unsupervised phenotyping with direct applications for PheWAS and large scale EHR-biorepository genetic association studies.
Funding
This work was supported by United States National Institutes of Health grants U54-HG007963, U54-LM008748, R01-HL089778, R01-HL127118, F31GM119263-01A1, K23-DK097142, P30-AR072577, the Harold and Duval Bowen Fund, and internal funds from Tsinghua University and Partners HealthCare.
Contributors
All authors made substantial contributions to: conception and design; acquisition, analysis and interpretation of data; drafting the article or revising it critically for important intellectual content; and final approval of the version to be published.
Competing interests
None
Supplementary Material
References
- 1. Kohane IS. Using electronic health records to drive discovery in disease genomics. Nat Rev Genet 2011; 126: 417–28. [DOI] [PubMed] [Google Scholar]
- 2. Pathak J, Kho AN, Denny JC.. Electronic health records-driven phenotyping: challenges, recent advances, and perspectives. J Am Med Inform Assoc 2013; 20 (e2): e206–11. [DOI] [PMC free article] [PubMed] [Google Scholar]
- 3. Ritchie MD, Denny JC, Crawford DC, et al. Robust replication of genotype-phenotype associations across multiple diseases in an electronic medical record. Am J Hum Genet 2010; 864: 560–72. [DOI] [PMC free article] [PubMed] [Google Scholar]
- 4. Kurreeman F, Liao K, Chibnik L, et al. Genetic basis of autoantibody positive and negative rheumatoid arthritis risk in a multi-ethnic cohort derived from electronic health records. Am J Hum Genet 2011; 881: 57–69. [DOI] [PMC free article] [PubMed] [Google Scholar]
- 5. Kho AN, Hayes MG, Rasmussen-Torvik L, et al. Use of diverse electronic medical record systems to identify genetic risk for type 2 diabetes within a genome-wide association study. J Am Med Inform Assoc 2012; 192: 212–8. [DOI] [PMC free article] [PubMed] [Google Scholar]
- 6. Xu H, Jiang M, Oetjens M, et al. Facilitating pharmacogenetic studies using electronic health records and natural-language processing: a case study of warfarin. J Am Med Inform Assoc 2011; 184: 387–91. [DOI] [PMC free article] [PubMed] [Google Scholar]
- 7. Jones R, Pembrey M, Golding J, et al. The search for genenotype/phenotype associations and the phenome scan. Paediatr Perinat Epidemiol 2005; 194: 264–75. [DOI] [PubMed] [Google Scholar]
- 8. Bilder RM, Sabb FW, Cannon TD, et al. Phenomics: the systematic study of phenotypes on a genome-wide scale. Neuroscience 2009; 1641: 30–42. [DOI] [PMC free article] [PubMed] [Google Scholar]
- 9. Denny JC, Ritchie MD, Basford MA, et al. PheWAS: demonstrating the feasibility of a phenome-wide scan to discover gene–disease associations. Bioinformatics 2010; 269: 1205–10. [DOI] [PMC free article] [PubMed] [Google Scholar]
- 10. Hebbring SJ, Schrodi SJ, Ye Z, et al. A PheWAS approach in studying HLA-DRB1*1501. Genes Immun 2013; 143: 187–91. [DOI] [PMC free article] [PubMed] [Google Scholar]
- 11. Namjou B, Marsolo K, Caroll RJ, et al. Phenome-wide association study (PheWAS) in EMR-linked pediatric cohorts, genetically links PLCL1 to speech language development and IL5-IL13 to Eosinophilic Esophagitis. Front Genet 2014; 5:401. [DOI] [PMC free article] [PubMed] [Google Scholar]
- 12. Shameer K, Denny JC, Ding K, et al. A genome-and phenome-wide association study to identify genetic variants influencing platelet count and volume and their pleiotropic effects. Hum Genet 2014; 1331: 95–109. [DOI] [PMC free article] [PubMed] [Google Scholar]
- 13. Cronin RM, Field JR, Bradford Y, et al. Phenome-wide association studies demonstrating pleiotropy of genetic variants within FTO with and without adjustment for body mass index. Front Genet 2014; 5:250. [DOI] [PMC free article] [PubMed] [Google Scholar]
- 14. Mitchell SL, Hall JB, Goodloe RJ, et al. Investigating the relationship between mitochondrial genetic variation and cardiovascular-related traits to develop a framework for mitochondrial phenome-wide association studies. BioData Min 2014; 71: 6.. [DOI] [PMC free article] [PubMed] [Google Scholar]
- 15. Carroll RJ, Bastarache L, Denny JC.. R PheWAS: data analysis and plotting tools for phenome-wide association studies in the R environment. Bioinforma Oxf Engl 2014; 3016: 2375–6. [DOI] [PMC free article] [PubMed] [Google Scholar]
- 16. Diogo D, Bastarache L, Liao KP, et al. TYK2 protein-coding variants protect against rheumatoid arthritis and autoimmunity, with no evidence of major pleiotropic effects on non-autoimmune complex traits. PLoS One 2015; 104: e0122271.. [DOI] [PMC free article] [PubMed] [Google Scholar]
- 17. Verma A, Basile AO, Bradford Y, et al. Phenome-wide association study to explore relationships between immune system related genetic loci and complex traits and diseases. Plos One 2016; 118: e0160573.. [DOI] [PMC free article] [PubMed] [Google Scholar]
- 18. Oetjens MT, Bush WS, Denny JC.. Evidence for extensive pleiotropy among pharmacogenes. Pharmacogenomics 2016; 17: 853–66. [DOI] [PMC free article] [PubMed] [Google Scholar]
- 19. Liu J, Ye Z, Mayer JG, et al. Phenome-wide association study maps new diseases to the human major histocompatibility complex region. J Med Genet 2016; 5310: 681–9. [DOI] [PMC free article] [PubMed] [Google Scholar]
- 20. Karnes JH, Bastarache L, Shaffer CM, et al. Phenome-wide scanning identifies multiple diseases and disease severity phenotypes associated with HLA variants. Sci Transl Med 2017; 9389: eaai8708.. [DOI] [PMC free article] [PubMed] [Google Scholar]
- 21. Carroll RJ, Thompson WK, Eyler AE, et al. Portability of an algorithm to identify rheumatoid arthritis in electronic health records. J Am Med Inform Assoc 2012; 19 (e1): e162–9. [DOI] [PMC free article] [PubMed] [Google Scholar]
- 22. Leader JB, Pendergrass SA, Verma A, et al. Contrasting association results between existing PheWAS phenotype definition methods and five validated electronic phenotypes. In: AMIA Annual Symposium Proceedings. American Medical Informatics Association 2015. 824 https://www.ncbi.nlm.nih.gov/pmc/articles/PMC4765620/ (Accessed August 7, 2017). [PMC free article] [PubMed] [Google Scholar]
- 23. Denny JC, Bastarache L, Ritchie MD, et al. Systematic comparison of phenome-wide association study of electronic medical record data and genome-wide association study data. Nat Biotechnol 2013; 3112: 1102.. [DOI] [PMC free article] [PubMed] [Google Scholar]
- 24. Ritchie MD, Denny JC, Zuvich RL, et al. Genome-and phenome-wide analyses of cardiac conduction identifies markers of arrhythmia risk. Circulation 2013; 12713: 1377–85. [DOI] [PMC free article] [PubMed] [Google Scholar]
- 25.Leisch F. FlexMix: A general framework for finite mixture models and latent class regression in R. J Stat Softw 2004; 11 (8): 1–18.
- 26. Grün B, Leisch F.. Fitting finite mixtures of generalized linear regressions in R. Comput Stat Data Anal 2007; 5111: 5247–52. [Google Scholar]
- 27.Grün B and Leisch F. FlexMix Version 2: Finite mixtures with concomitant variables and varying and constant parameters. J Stat Softw 2008; 28 (4): 1–35.
- 28. Dempster AP, Laird NM, Rubin DB.. Maximum likelihood from incomplete data via the EM algorithm. J R Stat Soc Ser B Methodol 1977; 39: 1–38. [Google Scholar]
- 29.Carey VJ, Lumley T, Ripley BD. gee: Generalized estimation equation solver. R package version 4.13–19 https://CRAN.R-project.org/package=gee. Accessed December 1, 2017. [Google Scholar]
- 30. Team RC. A language and environment for statistical computing. R Foundation for Statistical Computing, 2015; Vienna, Austria 2016.
- 31. Liao KP, Diogo D, Cui J, et al. Association between low density lipoprotein and rheumatoid arthritis genetic factors with low density lipoprotein levels in rheumatoid arthritis and non-rheumatoid arthritis controls. Ann Rheum Dis 2014; 736: 1170–5. [DOI] [PMC free article] [PubMed] [Google Scholar]
- 32. Gainer VS, Cagan A, Castro VM, et al. The biobank portal for partners personalized medicine: a query tool for working with consented biobank samples, genotypes, and phenotypes using i2b2. JPM 2016; 61: 11. [DOI] [PMC free article] [PubMed] [Google Scholar]
- 33. Sinnott JA, Dai W, Liao KP, et al. Improving the power of genetic association tests with imperfect phenotype derived from electronic medical records. Hum Genet 2014; 13311: 1369. [DOI] [PMC free article] [PubMed] [Google Scholar]
Associated Data
This section collects any data citations, data availability statements, or supplementary materials included in this article.