

Abstract
Bone marrow‐derived mesenchymal stem cells (BMMSCs) are multipotent stem cells capable of differentiation into a variety of cell types, proliferation, and production of clinically useful secretory factors. These advantages make BMMSCs highly useful for cell transplantation therapy. However, the molecular network underlying BMMSC proliferation remains poorly understood. Here, we showed that TGFβ‐activated kinase 1 (Tak1) is a critical molecule that regulates the activation of cell cycling and that Tak1 inhibition leads to quiescence in BMMSCs both in vivo and in vitro. Mechanistically, Tak1 was phosphorylated by growth factor stimulations, allowing it to bind and stabilize Yap1/Taz, which could then be localized to the nucleus. We also demonstrated that the quiescence induction by inhibiting Tak1 increased oxidized stress tolerance and improved BMMSC engraftment in intramuscular and intrabone marrow cell transplantation models. This study reveals a novel pathway controlling BMMSC proliferation and suggests a useful method to improve the therapeutic effect of BMMSC transplantation. stem cells 2019;37:1595–1605
Keywords: Bone marrow stromal cells, Adult stem cells, Cell cycle, Stem cell culture
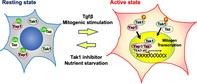
Activated transforming growth factor β‐activated kinase 1 by growth factors bind with Yap1/Taz stabilized and supported nuclear translocation by blocking ubiquitination. Conversely, inhibition of transforming growth factor β‐activated kinase 1 activity induces quiescent status in bone marrow‐derived mesenchymal stem cells.
Significance Statement.
This study demonstrates that TGFβ‐activated kinase 1 (Tak1) is a critical regulator of bone marrow‐derived mesenchymal stem cell (BMMSC) proliferation. Tak1 was activated by various mitogenic cytokines and could then induce stabilization and nuclear localization of Yap1/Taz by interacting with these proteins. Tak1 inhibition brought about the quiescent state in BMMSCs both in vivo and in vitro. Reversible quiescence induced by Tak1 inhibition provided stress tolerance and improved engraftment for BMMSCs in cell transplantation models.
Introduction
Bone marrow‐derived mesenchymal stem cells (BMMSCs) hold great potential for regenerative medicine because of their capacity for self‐renewal and differentiation into multiple types of cells such as adipocytes, osteocytes, and chondrocytes. To date, substantial evidence for the clinical advantages of BMMSCs have been reported. For example, it is known that these cells produce various secretory factors that support tissue repair and normalization of local inflammation 1, 2. However, fundamental biological information regarding BMMSCs, including how they maintain their undifferentiated status and switch fate between self‐renewal and differentiation, remains poorly understood. In particular, the molecular mechanisms underlying the regulation of BMMSC proliferation are unknown. The elucidation of these mechanisms is essential for controlling the condition and quality of stem cells for therapeutic uses.
According to previous studies, the regulation of proliferation of mesenchymal stem cells (MSCs) is associated with the following signaling cascades: fibroblast growth factor (FGF)‐ and subsequent MAP kinases (MAPK)/ERK activity‐dependent signaling, platelet‐derived growth factor (PDGF)/PDGF receptor‐activated signaling through ERK and AKT activation 3, hepatocyte growth factor‐ and epidermal growth factor (EGF)‐activated signaling through ERK and PI3K‐AKT 4, inflammatory cytokine‐activated signaling through stress‐associated kinases JNK and p38, and transforming growth factor β (TGFβ) signaling via TGFβ receptor/ALK‐Smads and MAPK and PI3K 5. However, the critical molecules that regulate cell proliferation of BMMSCs have not been identified to date.
TGFβ‐activated kinase 1 (Tak1), a member of the mitogen‐activated protein kinase–kinase–kinase (MAP3K) family, regulates various important cellular events such as differentiation, cell death, and proliferation of cancer cells and immune cells 6, 7, 8, 9, 10. In recent decades, important roles of Tak1 in tissue development have been suggested, such as in cartilage 11, 12 and palate 13, and in self‐renewal of muscle satellite cells 14, 15, 16. It has also been demonstrated that Tak1 activity is involved in inhibition of differentiation in mesenchymal progenitors 15. These findings evoke the idea that Tak1 function is closely associated with maintenance and/or self‐renewal of stem cells in mesenchymal lineages.
In the current study, we investigated if Tak1 is important in the regulation of BMMSC self‐renewal process. The results from this study are expected to provide insights for improving the therapeutic application of BMMSCs in transplantation.
Materials and Methods
Ethics Statement
All procedures involving animals were approved by the Institutional Animal Care and Use Committee of Kindai University and were performed in accordance with institutional guidelines and regulations. Human BMMSCs were provided by the RIKEN BioResource Research Center following approval from the ethics committee of Kindai University (approved no. 24‐089).
Isolation and Culture of BMMSCs
Six‐week‐old C57BL/6N male mice were used for the experiment. Bone marrow (BM) tissues were prepared as previously reported 17. To isolate the resident BMMSCs from BM tissues, cleaned long bones were cut into small pieces around 2–3 mm3 and treated with collagenase type I (Wako, Tokyo, Japan) for 15 minutes. Then, dissociated tissues were washed twice with phosphate‐buffered saline (PBS[−]) and reacted with anti‐PDGFRα (17‐1401‐81, eBioscience, San Diego, CA), anti‐Sca1 (61‐5981‐82, Thermo Fisher Scientific, Waltham, MA), anti‐CD45 (35‐0451‐U500, TONBO bioscience, San Diego, CA), and anti‐Ter119 (35‐5921‐U500, TONBO bioscience) for 1 hour at 4°C followed by sorted with FACS Aria II (BD Biosciences, Franklin Lakes, NJ). For culture, single cell suspensions containing BMMSCs were plated onto cell culture dishes (Sumilon, Sumitomo Bakelite Co. Ltd., Tokyo, Japan) and cultured in α‐MEM (Wako) supplemented with 200 mM l‐glutamine, 10% fetal bovine serum (Hyclone, Logan, UT) under 5% CO2 and 5% O2 at 37°C. On day 2 of culture, the medium was replaced to remove dead cells and debris. After 10 days of culture, BMMSCs that formed colonies of fibroblastic cells were disaggregated by treatment with TrypLE Express (Thermo Fisher Scientific) and evaluated by FACS using PDGFRα, CD105 (562759, BD Pharmingen, San Diego, CA), and Sca1 antibodies. Only the cells showing triple positive for the makers over 95% cells and passaged once or twice were use in subsequent experiments.
Serum‐Free Culture of BMMSCs and Cytokine/Inhibitor Stimulation
BMMSCs were cultured in Dulbecco's modified Eagle's medium supplemented with 0.1% bovine serum albumin (BSA, Sigma–Aldrich, St. Louis, MO), 200 mM l‐glutamine, and ITS‐A (Thermo Fisher Scientific). After 48 hours of the culture, BMMSCs were stimulated with 10 ng/ml of basic FGF (bFGF, ReproCELL, Kanagawa, Japan), TGFβ1 (R&D Systems, Inc., Minneapolis, MN), EGF (R&D Systems, Inc.), PDGF‐AB (R&D Systems, Inc.), or PDGF‐BB (R&D Systems, Inc.) for 12 hours. Effect of inhibitors on cell proliferation were observed by treatment with each chemical for 1 week at following concentrations that were designed to obtain specific inhibition evading nonspecific effects: 5z‐oxiozeanol (5zox): 20 nM, SB202190: 50 nM, PD0325901: 1 nM, SP600125: 40 nM, SB431542: 100 nM, A83‐01: 15 nM, Sc‐514: 10 μM, LY294002: 2 μM.
Tak1 Inhibition In Vivo and Cell Number Determination of Endogenous BMMSCs
One‐week‐old C57BL/6N male infants were used for this study. Five micrograms per body weight (g) 5zox were intraperitoneally injected every 48 hours for seven times. Before every injection, body weights were scaled. After 24 hours of final injection, mice were euthanized and BM tissues were prepared, the PαS fractions were sorted and analyzed as described above.
Fluorescent Observation of Cell Cycle Status
To observe cell cycle status of BMMSCs, we used a fluorescent ubiquitination‐based cell cycle indicator (Fucci)‐TG mice 19 20. In this system, cell cycle status could be visualized by Cdt1 protein fused with Kusabira Orange that peaks in G1 phase just before the onset of DNA replication, and by N‐terminal region of Geminin fused with EGFP, which levels are high during S and G2 phase. BMMSCs were prepared from 8‐week‐old Fucci mice as described above, treated with 5zox, and analyzed with FACS Aria II.
Scoring the Immunofluorescent Images
Fluorescent intensity of the nuclear localized proteins were measured with Image J software and scored for the nuclear localization index (NLI) as follows: fluorescent intensity of each protein in the DAPI+ area was measured. Then the average of fluorescent intensity of all cells in the control (avg. of control) was obtained. Each score for the test groups was divided by the average of control to obtain NLI for each protein.
Immunoprecipitation
Plasmid coding HA‐tagged Tak1 (Addgene #44160), Yes‐associated protein 1 (Yap1), or transcriptional coactivator with PDZ domain (Taz) were transfected into the mouse BMMSCs (mBMMSCs) using a CUY21 electroporator (NEPA Gene, Tokyo, Japan). Whole‐cell lysates or fractionated samples were incubated with 2 μg of specific antibodies for 8 hours at 4°C in immunoprecipitation buffer (50 mM Tris [pH 7.3], 150 mM NaCl, 5 mM EDTA, 10 mM NaF, 1% Triton X‐100) with 1 mM PMSF and protease inhibitors (Sigma–Aldrich). Immunocomplexes were isolated with protein G‐Sepharose beads saturated with 1% BSA, by gentle rocking for 4 hours at 4°C. Beads were washed five times with ice‐cold Immunoprecipitation (IP) buffer. Bound proteins were retrieved from Sepharose beads by boiling in Laemmli buffer containing β‐mercaptoethanol. To detect the ubiquitinated Yap1 and Taz, the cells were treated with proteasome inhibitor MG132 at 1 nM for 6 hours before sampling.
Transplantation of the BMMSCs into Muscular Tissues
The recipient B6 animals were anesthetized using 2% isoflurane. Following anesthesia, posterior biceps femoral muscles were opened aseptically, create the slit with scalpel blade. The primary BMMSCs established from C57BL/6‐Tg (CAG‐EGFP, Japan SLC, Inc., Hamamatsu, Japan) were treated with 20 nM 5zox for 6 days, adjusted to 1.5 × 10⁹ cells per milliliter in PBS and injected 100 μl into the slit with 1 ml syringes with 27G needles. After 48 hours of the transplantation, the muscles were collected, digested, and analyzed with FACS.
Intrabone Marrow Transplantation of BMMSCs
Following anesthesia, knee joints were opened aseptically, and 27G needles were inserted into the bone cavity of tibia to create the space for cell transplantation. Primary BMMSCs collected from the EGFP male mice were pretreated with 5zox as above and adjusted to 1.5 × 10⁹ cells per milliliter in PBS. The 5 × 10⁴ BMMSCs were then injected into the bone cavity of tibia using a 50 μl microsyringe (Hamilton Co. Whittier, CA) as described previously 21, 22.
Statistical Analysis
Significant differences were detected by Tukey–Kramer HSD test or Student's t test, as appropriate. p values less than .05 were considered significant.
Results
Inhibition of Tak1 Leads to Suppression of Proliferation of BMMSCs
To investigate the importance of Tak1 for the proliferation of BMMSCs, we treated three independent mBMMSC lines and two independent human BMMSCs (hBMMSCs) with 5zox, which is a specific inhibitor of Tak1 23. Upon 5zox treatment, cell proliferation and colony formation were significantly inhibited in a dose‐dependent manner in both mBMMSCs (Fig. 1A) and hBMMSCs (Supporting Information Fig. S1). Treatment with 200 nM of 5zox resulted in complete inhibition of colony formation (Fig. 1A). A 70% reduction in cell proliferation was observed at 72 hours post‐treatment in both mBMMSCs and hBMMSCs (Fig. 1B). Unless otherwise specified, the abbreviation BMMSCs refers to mBMMSCs hereafter. To determine the suppressive effect of Tak1 blockade against BMMSC proliferation, we performed siRNA‐mediated suppression of Tak1 expression in BMMSCs. The siRNA against Tak1 (siTak1) decreased the expression level of Tak1 mRNA to ∼40% of that in the untreated control (Supporting Information Fig. S2A, S2B). Approximately 60% reduction in total cell number was observed at 48 hours after siRNA transfection when compared with that of the control (Supporting Information Fig. S2C). Next, we investigated whether Tak1 inhibition alters the differentiation potential of BMMSCs. Upon 5zox treatment, both chondrogenesis and osteogenesis was inhibited, whereas no significant difference was observed in adipogenesis. When 5zox addition was discontinued before induction of differentiation, the differentiation efficiencies into chondrocytes, osteoblasts, and adipocytes were comparable with those of the untreated controls (Fig. 1C).
Figure 1.

Effect of TGFβ‐activated kinase 1 inhibition by 5zox treatment on proliferation and differentiation of BMMSCs. (A): Crystal violet‐stained image of cultured BMMSCs in 35‐mm dishes: Vehicle, DMSO treated BMMSCs. Lower three panels show dose‐dependent effect of 5zox. (B): Suppression of proliferation by 5zox was reproducible in human and mice BMMSCs (hBMMSCs and mBMMSCs, respectively). Asterisks represent significant differences (p < .05, n = 6) compared with control. (C): Effect of 5zox on in vitro differentiation. Left three panels are results of differentiation induction without 5zox during both BMMSC expansion and differentiation (expansion: 5zox−, differentiation: 5zox−); these data were quantified with ImageJ and are shown as black bars in the bar graph. Middle three panels are results of differentiation induction, in which 5zox was added during BMMSC expansion, and removed during differentiation (expansion: 5zox+, differentiation: 5zox−); these data are shown as gray bars in the bar graph. Right three panels are results of differentiation induction, in which 5zox was added during BMMSC expansion and differentiation (expansion: 5zox+, differentiation: 5zox+); these data are shown as white bars in the bar graph. Asterisks represent significant differences (p < .05, n = 6) compared with the “expansion: 5zox−, differentiation: 5zox− condition.” Abbreviations: BMMSC, bone marrow‐derived mesenchymal stem cells; hBMMSC, human bone marrow‐derived mesenchymal stem cells; mBMMSC, mouse bone marrow‐derived mesenchymal stem cells; NTC, non‐treatment control.
Tak1 Inhibition Blocks Proliferation of BMMSCs In Vivo
To confirm whether Tak1 inhibition suppressed cell proliferation of BMMSCs in vivo, we injected 5zox into juvenile mice. Young mice at day 10 after birth were injected with 5zox for five times every other day. When weight was measured the day after the final injection, the 5zox‐treated juvenile mice (5zox mice) showed growth retardation in weight compared with the vehicle‐treated control (Fig. 2A). In the 5zox mice, the undifferentiated BMMSCs, identified as PDGFRα+/Sca1+/CD45−/Ter119− (PαS), were significantly decreased (Fig. 2B), indicating that inhibition of Tak1 blocked cell growth of the BMMSCs in vivo. Retarded growth observed in the 5zox mice recovered within 3 weeks of stopping Tak1 inhibition (Fig. 2C). The 5zox mice appeared normal during 5zox treatment; after weight recovery and subsequent maturation, they showed normal fertility. To validate that suppression of Tak1 lead to slowing or blocking of BMMSC proliferation, we performed siRNA‐mediated inhibition of Tak1 in vivo. When the cell cycle status of the PαS fraction was evaluated at 24 hours after second injection of siRNA (methods have been described in Supporting Information Materials and Methods), the population of cells in S/G2/M phases was significantly decreased, whereas the percentage of cells in G0/G1 phases was significantly increased (Supporting Information Fig. S3). Based on these, we hypothesized that Tak1 is important for the cell cycle process.
Figure 2.
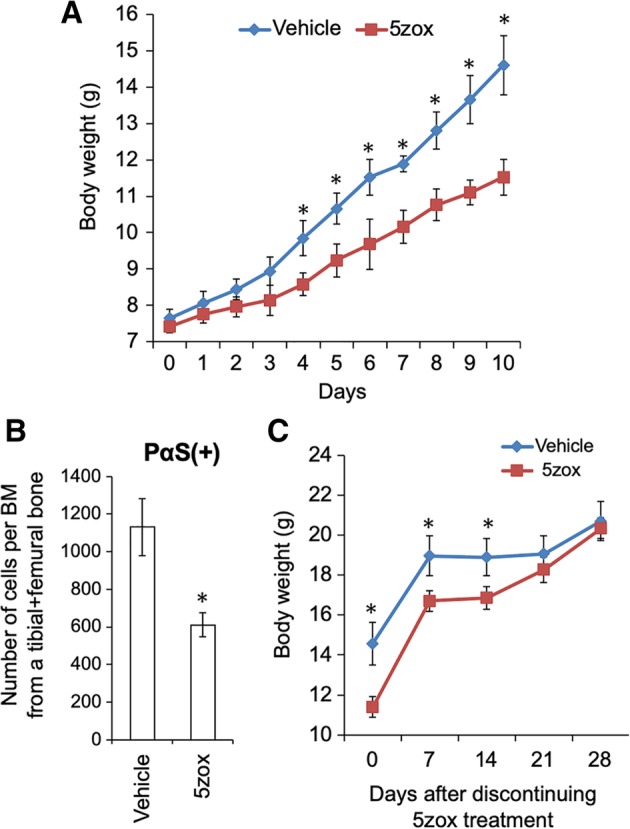
5zox injection induced reversible growth retardation and inhibition of bone marrow‐derived mesenchymal stem cell (BMMSC) expansion in vivo. (A): Body weight increase in the juvenile mice with (red line) or without (vehicle, blue line) 5zox treatment. Asterisks represent significant differences (p < .05, n = 6) between the two conditions. (B): Number of PDGFRα+/Sca1+/CD45−/Ter119− (PαS) cells in bone marrow tissues collected from B6 mice treated with and without 5zox. Asterisks represent significant differences (p < .05, n = 6) compared with control. (C): Recovery of body weight in the 5zox (red line) or vehicle (blue line) treated mice. Asterisks represent significant differences (p < .05, n = 6) between the two conditions.
Tak1 Inhibition Induces Quiescence‐Like Characteristics in BMMSCs
To further elucidate the changes induced by Tak1 inhibition in BMMSCs, we examined the cell cycle status using the BMMSCs collected from Fucci G1‐orange/S/G2/M‐green transgenic mice (Fucci‐TG). Following 5zox treatment, the percentage of G0/G1 cells significantly increased, and conversely, S/G2/M populations decreased (Fig. 3A and Supporting Information Fig. S4A), indicating that 5zox blocked the progression of cell cycle from G0/G1 to subsequent steps. Also in vivo, treatment with 5zox brought about accumulation of G0/G1 cells (Supporting Information Fig. S5). Western blot (WB) analysis for Caspase 3 showed that 5zox treatment did not induce the cleavage of Caspase 3, indicating that Tak1 may not be essential for cell viability (Supporting Information Fig. S4B). FACS‐based analysis for necrosis or apoptosis using PI/Annexin V dye also demonstrated that cell death was not induced upon treatment with standard conditions of 20 nM 5zox; even after over exposure to 200 nM of 5zox, ∼90% of BMMSCs survived (Supporting Information Fig. S4C).
Figure 3.
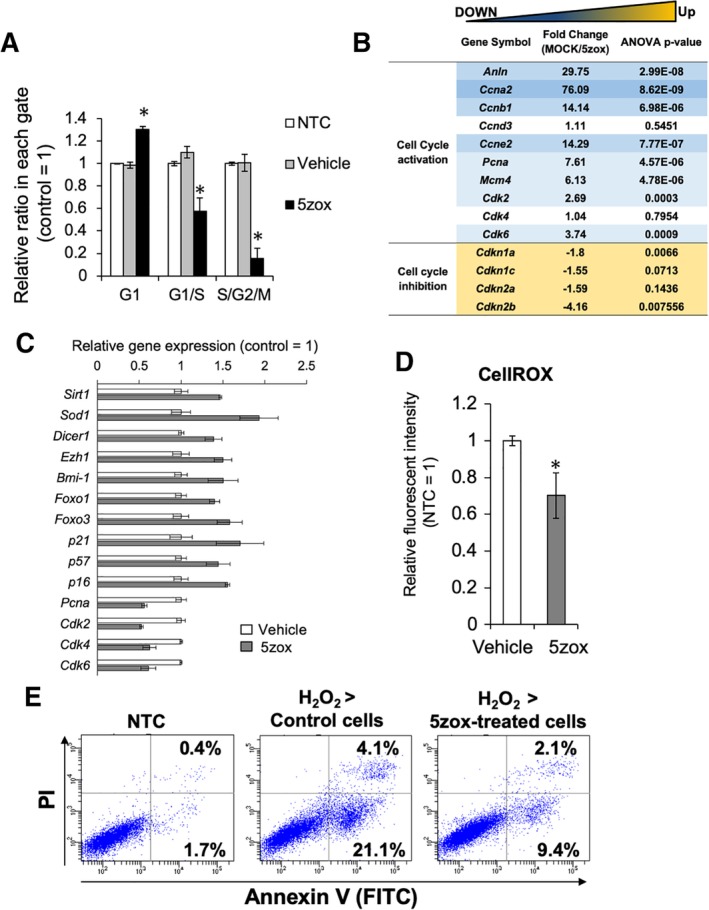
Analysis of cell cycle status in the bone marrow‐derived mesenchymal stem cells (BMMSCs) treated with 5zox. (A): FACS‐based quantification of cell numbers in the BMMSCs treated with vehicle (same amount of DMSO) and 5zox by the fucci G1‐orange/S/G2M‐green system. Asterisks represent significant differences (p < .05, n = 3) compared with control. (B): Expression change in the genes associated with cell cycle regulation found by microarray analysis. (C): qRT‐PCR analysis for the expression change of the quiescence‐related genes. Significant differences between nontreatment control and 5zox were detected in all genes represented here (p < .05, n = 3). (D): Reactive oxygen species detection with CellROX dye and FACS. Asterisks represent significant differences (p < .05, n = 3) compared with vehicle control. (E): Detection of apoptosis/necrosis by PI/Annexin V (AnV) staining. PI/AnV double‐positive population indicates cell population undergoing necrosis or late apoptosis. PInegative/AnV positive fraction indicates cell population undergoing necrosis or early apoptosis.
Microarray of the Tak1‐treated BMMSCs and showed that active cell cycle‐associated genes encoding cyclin dependent kinases (CDKs), as well as proliferating cell nuclear antigen and mini chromosome maintenance complex component 4 (MCM4), were suppressed. In contrast, genes involved in the maintenance of quiescent status, such as those encoding Cdkn1a (p21), Cdkn1c (p57), and Cdkn2a (p16) were upregulated (Fig. 3B). Furthermore, it was found that other quiescence‐associated genes, for example, antistress genes such as those encoding Sirt1, Sod1, and forkhead box O1, 3 (Foxo1, 3), as well as polycomb genes Bmi1, and enhancer of zeste homolog 1 (EZH1) were also upregulated by 5zox treatment by the microarray and qRT‐PCR (Fig. 3C). To determine if the upregulated antioxidant genes were functional, we analyzed intracellular reactive oxygen species (ROS) with CellROX dye and found that 5zox treatment reduced the ROS levels in cultured BMMSCs after H2O2 treatment (Fig. 3D). Furthermore, subsequent cell viability assay using PI and Annexin V (AnV) dyes showed that pretreatment with 5zox reduced cell populations during early apoptosis detected as PInegative/AnVpositive from 21.1% to 9.4% and late apoptosis detected as PIpositive/AnVpositive from 4.1% to 2.1% (Fig. 3E). Together, these results suggested that pretreatment with 5zox increased the tolerance for oxidative stress in BMMSCs.
Phosphorylated Tak1 Activates Cell Proliferation Through Noncanonical TGFβ Pathway Under TGFβ1 Supplementation
To elucidate the mechanisms underlying Tak1‐mediated cell cycle activation in BMMSCs, we first explored molecules that could activate Tak1 in serum‐dependent cultures. As candidate molecules, we choose TGFβ1, FGF, EGF, PDGF‐AB, or PDGF‐BB, all of which are important components found in serum for cell culture. Upon supplementation of these molecules, Tak1 was phosphorylated not only by TGFβ1, but also by FGF (bFGF), EGF, PDGF‐AB, and PDGF‐BB treatments (Fig. 4A). Next, we explored the downstream mediators of Tak1 using a simplified culture, in which the proliferation of BMMSCs depended on only TGFβ1, and inhibitors or siRNA against candidate molecules. Under such culture condition, BMMSCs proliferated depending on the concentration of TGFβ1 (Fig. 4B). When the BMMSCs were treated with inhibitors against Tak1 (5zox), p38 (SB202190), MEK (PD0325901), and PI3K/Akt (LY‐294002) in the TGFβ‐dependent culture, a decrease in cell expansion was observed. Particularly, the administration of 5zox brought about strong suppression of both colony formation (Supporting Information Fig. S6) and cell proliferation (Fig. 4C, 4D). Suppression of Smad2 and 3 did not affect BMMSC proliferation (Supporting Information Fig. S7). Suppression of Erk1 and Erk2 elicited a 40% reduction in TGFβ‐induced proliferation. In contrast, suppression of Tak1 led to 70% reduction in cell proliferation (Supporting Information Fig. S2).
Figure 4.
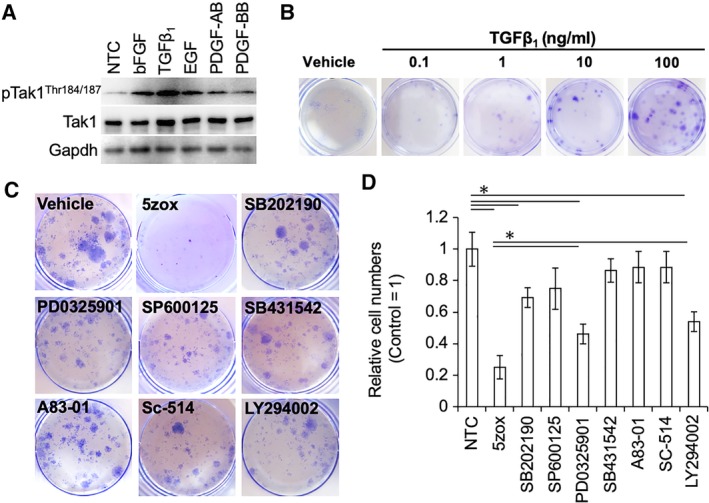
Effect of growth factors or inhibitors against map kinases (MAPKs) under serum‐free culture conditions. (A): Phosphorylation status of TGFβ‐activated kinase 1 (Tak1) under various growth factor stimulations. (B): Dose‐dependent mitogenic effect of TGFβ1 on the serum‐free culture of bone marrow‐derived mesenchymal stem cells (BMMSCs). Cells were stained with crystal violet dye. (C): Colony formation assay after limited dilution. Cells were stained with crystal violet dye. (D): Relative cell numbers after 7 days culture under each inhibitor treatment conditions. Asterisks represent significant differences (p < .05, n = 3) compared with nontreatment control. Abbreviation: pTak1, phosphorylated Tak1.
Activated Form of Tak1 Localizes into the Nucleus in Proliferating BMMSCs and Binds to Yap1/Taz
To investigate the mechanism underlying Tak1‐mediated BMMSC proliferation, we performed immunofluorescence (IF) analysis of Tak1. In cultured BMMSCs, TAK1 was localized in both the cytoplasm and nucleus. In contrast, when BMMSCs were treated with 5zox for 6 hours, Tak1 was excluded from the nucleus of almost all cells. NLI of each image showed that nuclear localization of Tak1, Yap1, and Taz were blocked by the 5zox treatment (Fig. 5). To confirm the change in Tak1 localization, we performed nuclear/cytoplasm fractionation of BMMSCs followed by WB‐based Tak1 detection. Tak1 was detected in both nuclear and cytoplasmic fractions from untreated samples, whereas the expression was remarkably low in the nuclear fraction from 5zox‐treated BMMSCs (Fig. 6A). Since Tak1 lacks a DNA‐binding domain and nuclear localization signal, we hypothesized that some interacting molecule(s) may mediate signal transduction between Tak1 activity and mitogenic reactions in BMMSCs. To identify such molecules, we focused on Yap1 and its paralog Taz, which are transcriptional activators of the Hippo tumor suppressor pathway involved in organ size regulation and tumorigenesis. To examine the possibility of interaction between Tak1 and Yap1/Taz, we performed IF and WB with anti‐Tak1 and anti‐Yap1 or anti‐Taz antibodies. In proliferating BMMSCs, Yap1 and Taz were also expressed in both the cytoplasm and nucleus. In contrast, amounts of nuclear Yap/Taz were reduced in the 5zox‐treated BMMSCs (Figs. 5 and 6A). We then examined the possibility of a direct interaction between Tak1 and Yap1/Taz using the coimmunoprecipitation (Co‐IP) approach. To perform this experiment, we transfected a HA‐tagged TAK1 plasmid (HA‐Tak1) into BMMSCs and immunoprecipitated whole‐cell lysate with anti‐HA antibody. Subsequent WB assay showed that Yap1/Taz were present in the immunoprecipitated fraction of the BMMSCs (Fig. 6B). This means that both Yap1 and Taz could bind with Tak1. On the other hand, the binding between Tak1‐Yap1 and Tak1‐Taz were reduced by the 5zox‐treatment (Fig. 6C). We hypothesized that Tak1 contributes to stabilization of Yap1/Taz by regulating its phosphorylation status. To test this, we performed WB for Yap1Ser397, which is a degradation mark of Yap1 24 conserved in mouse cells 25. Under normal culture conditions, Yap1Ser397 was very weekly detected. When the BMMSCs were treated with 5zox, Yap1Ser397 was strongly expressed (Fig. 6D). To confirm whether interaction with Tak1 elicited a change in the ubiquitination status of Yap1/Taz, we transfected HA‐Yap1 or HA‐Taz in BMMSCs and performed IP with anti‐HA antibodies 48 hours after transfection with or without 5zox treatment. Under normal conditions without 5zox treatment, ubiquitinated Yap1/Taz were very weakly detected, and by 5zox treatment ubiquitinations of YAP1 and Taz were increased (Fig. 6E).
Figure 5.
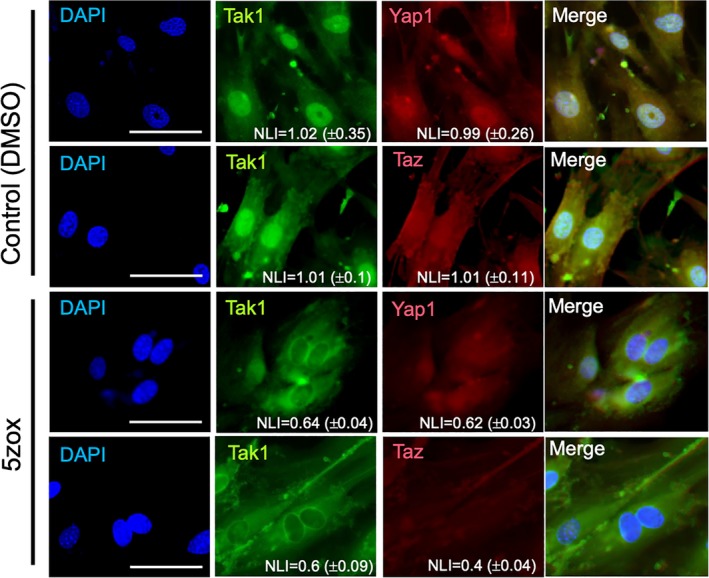
Immunofluorescence for Tak1, Yap1, and Taz in the bone marrow‐derived mesenchymal stem cells (BMMSCs). BMMSCs treated with DMSO or 5zox were observed using a fluorescent microscope after IF with anti‐Tak1/FITC‐2ndAb and anti‐Yap1 or Taz/TexasRed‐2ndAb. NLI indicates the nuclear localization index and the scores are shown as mean value ± SD of all cells in each image. Scale bar = 50 μm.
Figure 6.
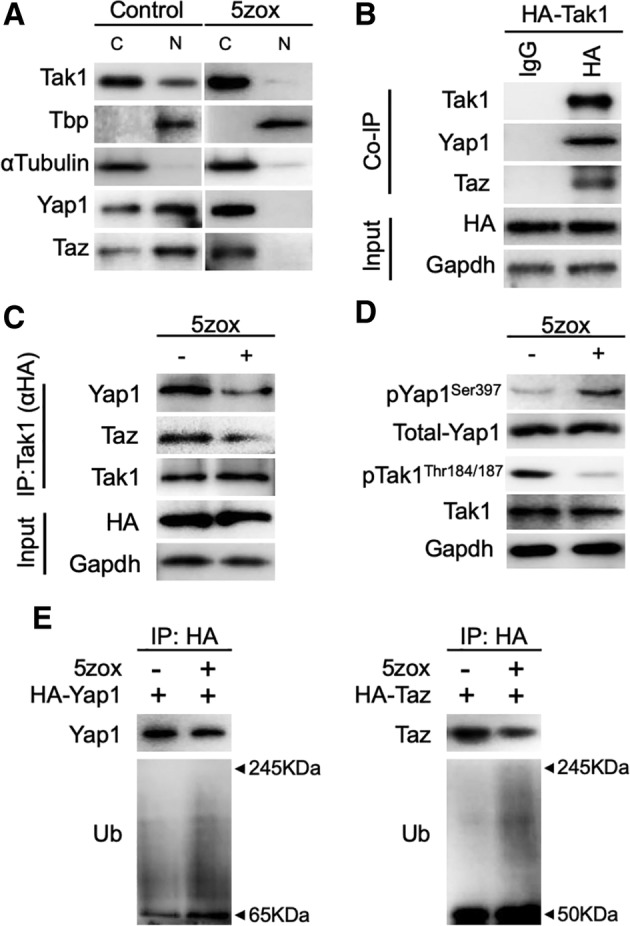
Localization of TGFβ‐activated kinase 1 (Tak1) and interaction between Tak1‐Yap1/Taz. (A): Localization change of Tak1, Yap1, and Taz by 5zox treatment. Tbp is a TATA‐binding protein as a representative of nuclear localizing protein. αTubulin is a representative of cytoplasmic protein. (B): Immunoprecipitation (IP)‐Western blot (WB) showing interaction between Tak1 and Yap1/Taz. HA indicates IP fraction prepared with anti‐HA antibody. (C): IP‐WB showing affinity change between Tak1 and Yap1/Taz by 5zox treatment. IP fractions were prepared with anti‐HA antibody, which bound to HA‐Tak1. (D): Phosphorylation status of Yap1 and Tak1 under control and 5zox treatment condition. (E): IP‐based detection of ubiquitination status of Yap1 and Taz. Total Yap1 or Taz was collected from cell lysate of BMMSCs with anti‐HA antibody. Subsequently, the ubiquitinated Yap1 or Taz were detected with anti‐Ub antibody. Abbreviations: C, Cytoplasmic fraction; N, nuclear fraction of bone marrow‐derived mesenchymal stem cells (BMMSCs).
Pretreatment with 5zox Confers High Viability on Transplants by Inducing Quiescence During Transplantation of BMMSCs
We examined whether Tak1 inhibition enables efficient synchronization into the quiescent state and higher survival rate after transplantation. Prior to transplantation of the 5zox‐treated BMMSCs, we determined the duration of the effect of 5zox in the BMMSCs after deprivation of 5zox from the medium. At 12 hours after 5zox removal, more than 90% of the cells were still maintained at the G0/G1 stage. At 12 hours after the second medium change, ∼80% cells were retained in the G0/G1 stage. Even at 72 hours after 5zox removal, 60% of the BMMSCs were at the G0/G1 stage (Fig. 7A). Thus, we considered that 5zox treatment was effective just by treating BMMSCs before cell transplantation. To confirm that the pretreatment with 5zox improved cell survival during implantation, we injected 5zox‐treated BMMSCs prepared from EGFP mice into the injured femur muscles of syngeneic wild‐type B6 mice and performed PI/AnV assays and CellROX assays for the EGFP+ cells at 48 hours after injection. FACS analysis for the EGFP+ fraction revealed that the cell population undergoing early apoptosis decreased from 82.4% to 50.1%, and the population in late apoptosis decreased from 16.8% to 8.9% (Fig. 7B). CellROX analysis showed that intracellular ROS levels were suppressed in the 5zox pretreated cells even after 48 hours of injection (Fig. 7C). Next, we examined whether the pretreatment with 5zox improved the long‐term engraftment by performing intrabone marrow transplantation (IBMT) using the BMMSCs from EGFP mice. Approximately, 3,500 EGFP+ cells per 1 × 10⁶ BM cells, which corresponds to 7% of the injected cells (5 × 10⁴ cells), remained at 24 hours after transplantation (Fig. 7D and Supporting Information Fig. S8). At this time point, 5zox treatment resulted in a threefold increase in the engrafted cells compared with the control. Although the numbers of engrafted cells decreased depending on days after cell transplantation, the predominancy of the engrafted rate was maintained after 5zox treatment and ∼2,500 cells per 1 × 10⁶ BM cells, corresponding to 5% of the injected cells survived and engrafted at 28 days after cell transplantation (Fig. 7D). When the survived EGFP+ cells in the recipient were resorted using PDGFRα and Sca1 antibodies, we found that only 5% of the engrafted cells in the control group expressed both markers. In contrast, ∼40% of engrafted cells maintained the expression of both markers in the 5zox groups (Fig. 7E).
Figure 7.
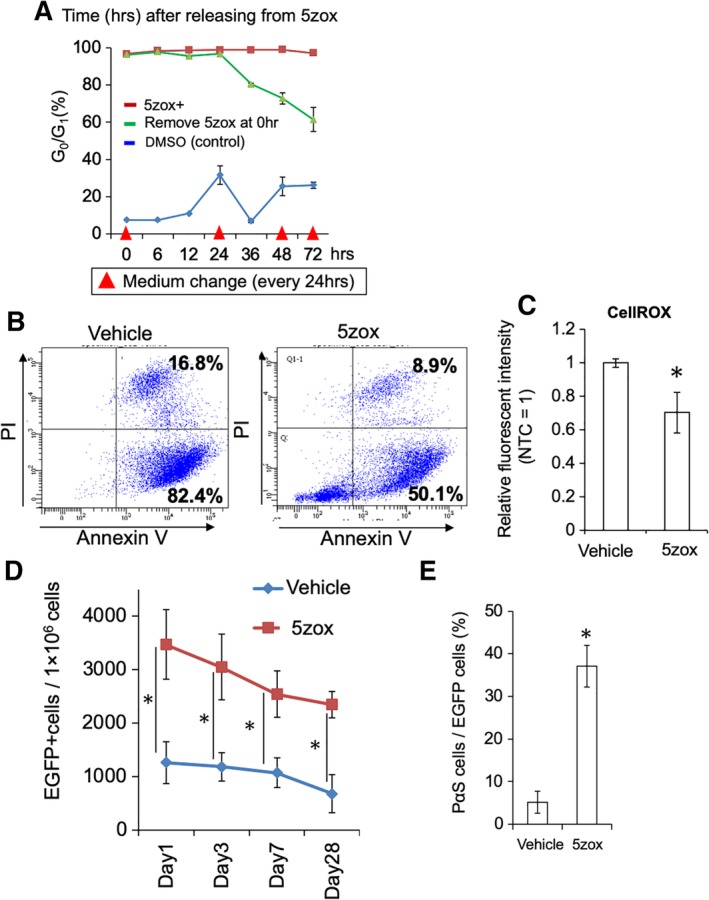
Effect of 5zox pretreatment for bone marrow‐derived mesenchymal stem cells (BMMSCs) on cell transplantation. (A): Duration of 5zox‐induced quiescence after stopping 5zox supplementation in the cultured BMMSCs. Red arrow heads show timing of medium change with 5zox‐fresh medium. (B): Detection of apoptosis/necrosis by PI/AnV staining. BMMSCs from EGFP mice were treated with 20 nM 5zox for 6 days, transplanted into femur muscles and collected at 48 hours after transplantation and analyzed for EGFP+ populations by FACS. (C): Analysis of intracellular ROS levels using the CellROX dye. Isolation of the transplanted cells was performed as above. (D): Remaining EGFP+ cell numbers in the recipient BMs. Asterisks represent significant differences (p < .05, n = 6) compared with the two groups. (E): Rate of undifferentiated BMMSC detected as PDGFRα/Sca1 double‐positive population (p < .05, n = 6).
Discussion
The current study provides evidence for the prominent role of Tak1 in the proliferation of BMMSCs. Both in vivo and in vitro, it was confirmed that Tak1 deprivation leads to strong inhibition of the proliferative activity of BMMSCs without affecting their differentiation potential. Notably, 5zox treatment during differentiation suppressed chondrogenesis and osteogenesis, which was consistent with previous results observed in Tak1‐suppressed cells 11, 12, 26, 27. In the in vivo experiment, we observed that 5zox treatment blocked expansion of BMMSCs and induced growth retardation; however, both the number of BMMSCs and total body weights recovered to normal levels upon discontinuing the 5zox treatment. Although the toxicity of the 5zox is not well understood, it was shown that reversible forced blocking of cell cycling in BMMSCs was possible by inhibition of Tak1 activity. Subsequent analysis of the characteristics of the 5zox‐treated cells showed that Tak1 inhibition resulted in the accumulation of G0/G1 cells. Importantly, the 5zox‐treated cells showed quiescent cell‐specific characteristics in terms of gene expression and ROS resistance potential. Based on these findings, we concluded that Tak1 inhibition induced a quiescent‐like state in the BMMSCs.
Originally, Tak1 was considered as a kinase activated by TGFβ 6, 7, 8, 9, 10, 28. However, we observed that Tak1 is also activated by FGF2, EGF, and PDGFs. Previous studies have demonstrated that Tak1/TAK1 could be activated by various cytokines such as interleukins 7, FGFR1 29, FGFR3 30, G‐CSF, and some chemotactic factors 31, in addition to TGFβ. Therefore, it was not surprising that Tak1 activation was induced by various cytokines tested in the present work. This Tak1 activation induced by various cytokines is thought to be an important factor engaging Tak1 as a hub molecule for the mitogenic reactions of BMMSCs.
To identify downstream molecules connecting Tak1 activity with the mitogenic reaction of BMMSCs, we performed inhibition of major molecules related to the self‐renewal of stem cells. The involvement of Tak1 in the proliferation of neural stem cells 32, hematopoietic stem cells, nephron progenitor cells 33, and muscular satellite cells 16 has already been reported. In these cells, Tak1 is required for the activation of NF‐κB and JNK during inflammation‐induced tissue regeneration. However, we found that inhibition of NF‐κB and JNK did not affect cell proliferation activity in BMMSCs, at least in the present TGFβ‐dependent culture conditions. Consistent with our notion, it has previously been shown that inhibition of NF‐κB signaling enhances the generation of MSCs from pluripotent stem cells, rather than blocking their proliferation 34. These findings suggested that NF‐κB might be dispensable for MSC self‐renewal. Several studies have shown the involvement of JNK in MSC proliferation; for example, JNK signaling is involved in FGF2‐ 35 and PDGF‐induced proliferation 36, and treatment with SP600125 has been shown to inhibit the cytokine‐induced proliferation. However, importantly, these studies also showed that JNK inhibition could not induce complete inhibition of cell proliferation, but only canceled the effect of cytokines.
It has been reported that Tak1 can also activate ERK and p38MAPK 37. ERK is especially known as a strong mitogen in various cells, including stem cells. We observed that cell proliferation activity of BMMSCs was suppressed to 50% compared with that of the control. This result was consistent with that of siRNA experiment. Inhibition of p38MAPK or Akt also affected BMMSC proliferation, although the suppressive effects of p38MAPK and Akt inhibition on cell proliferation were not critical. Consistently, previous studies have shown that MSCs can repopulate under suppression of ERK 35, p38MAPK 38, and Akt 39.
In contrast to the above molecules, Tak1 inhibition with 5zox inhibited BMMSC proliferation almost completely, without affecting cell viability. This suggests that Tak1 plays a prominent role in the proliferation of BMMSCs, and its activity is likely mediated by a different mechanism from the well‐studied models such as MAPKs.
In this context, we focused on Yap1/Taz, which fulfill the following requirements as a regulator of the BMMSC proliferation: abundantly expressed in various stem cells including BMMSCs 40, directly involved in cell proliferation, and can function independently of proliferation‐related kinases such as ERK 41 and JNK 42.
In the nucleus, Yap1 and Taz form a complex with transcription factors, most prominently the TEA domain family members (TEADs), and strongly activate gene expression 43, 44 to induce cell proliferation. As expected, interaction between Tak1 and Yap1/Taz was observed in proliferating BMMSCs. Binding of Tak1 to Yap1/Taz was dependent on phosphorylation modification and dephosphorylation of Tak1 by 5zox treatment disrupted the protein–protein interaction between Tak1 and Yap1/Taz.
We then hypothesized that the interaction between Tak1 and Yap1/Taz regulates the degradation of Tap1/Taz. In previous studies, it has been demonstrated that Yap1 is negatively regulated by large tumor suppressor 1 (LATS1) and 2, which in turn phosphorylate Yap1 and induce recruitment of the ubiquitin ligase complex and subsequent degradation via the ubiquitin proteasome pathway 45, 46, 47. Taz is also regulated by phosphorylation and subsequent ubiquitin‐proteasomal degradation 24, 47.
Under 5zox treatment condition, we found that Yap1 phosphorylation on the Ser397 residue increased. Phosphorylation of YAP1Ser397 is modified by LATS and this induces recruitment of the SCFβ‐TrCP E3 ubiquitin ligase, and leads to ubiquitylation and degradation of Yap1 24, 48. In mouse cells, phosphorylation on Ser397 residue and subsequent cytoplasmic retention and degradation were induced not only by Latz, but also by latz‐independent Fak/Cdc42/Pp1a cascade 25. Consistent with these findings, immunoblot with anti‐Ubiquitin (Ub) antibodies showed that Yap1 was highly ubiquitinated under 5zox treatment condition. Although we could not observe the phosphorylation status of Taz because of antibody availability, an increase in ubiquitination‐modification under 5zox treatment was also detected in Taz protein. From these, we concluded that Tak1 provided stability for Yap1 and TAZ by blocking the degradation marks and subsequent ubiquitination‐proteasomal degradation of Yap1/Taz. In previous studies, Tak1 was reported to be additionally activated by mechanical stresses 49, 50. Interestingly, the proliferation of BMMSCs is enhanced by fluid flow, fluid shear, and cyclic tensile strains. Furthermore, it has also been revealed that cyclic strain increases the activity of YAP1 51. Therefore, it is possible that the Tak1‐Yap1 molecular axis demonstrated here serves as a common signaling cascade in mitogenic reactions in BMMSCs.
Until now, several studies suggest that induction of quiescence confers enhanced stress tolerance in somatic stem cells. As a result of the elevated expression of antistress molecules such as glutathione peroxidase 3 (GPX3), sulfiredoxin, and thioredoxin reductase 1 (TXNRD1), quiescent somatic stem cells are protected from various stress molecules including ROS 52. It has been demonstrated that the induction of a quiescent state in human MSCs via serum deprivation enhances their viability when implanted in vivo 53.
To date, a variety of approaches to induce quiescence in vitro have been reported: anchorage deprivation, growth to confluence and contact inhibition, mitogen deprivation 53, and nutrient/amino acid limitation 54. Although these approaches result in reversible quiescence in somatic cells and stem cells, the efficiency of these treatments is highly dependent on the condition and quality of the cells, and they sometimes lead to irreversible changes. For example, the blockade of cell adhesion induces anoikis in BMMSCs 55, and serum or mitogen deprivation leads to premature aging 56 or cell death 57. Recently, it was reported that quiescence may be triggered by culture on soft substrates 58, 59. However, this method needs complicated processes to induce reentry into active cell cycling status. Thus, alternative approaches to establish reversible quiescence in MSCs are preferable for actual therapeutic use. As expected, pretreatment with 5zox clearly improved survival of the transplanted BMMSCs in the muscle injury models. The 5zox pretreated BMMSCs showed lower ROS levels compared with untreated cells from the transplanted site, indicating that 5zox treatment provides stress tolerance, at least for oxidative stress, also in vivo and contributes to the higher survival rate of the transplanted cells. It is known that transplanted MSCs are hardly engrafted when the cells are heterotopically transplanted 60. To observe the effect of 5zox treatment on engraftment of BMMSCs, we performed IBMT of the BMMSCs, expecting that the original environment of the BMMSCs provide longer engraftment. Approximately, 1% cells (untreated) remained in the BM tissues on day 28 after transplantation. Notably, the 5zox treatment improved the engraftment rate of the BMMSCs; 5% of the transplanted cells remained on day 28 after transplantation. Furthermore, 40% of the EGFP+ fraction maintained PDGFRα and Sca1 expression even on day 28 after transplantation when the BMMSCs were pretreated with 5zox. These findings indicate that 5zox treatment not only improved survival and engraftment rate of BMMSCs, but also contributed to the maintenance of stem cell characteristics of the transplanted BMMSCs in the recipients. Interestingly, the microarray analysis and subsequent qRT‐PCR‐based validation suggested that 5zox treatment enhances gene expression of various cytokines involved in wound healing and immunomodulation, which are important therapeutic role of BMMSCs (Supporting Information Fig. S9). Although detailed analysis such as confirmation of protein expression is essential, it is possible that the improved cell survival and engraftment observed in the 5zox pretreated cells were supported through the expression of these cytokines. We believe that further characterization of the 5zox‐treated cells and longer‐term follow‐up of the engraftment/survival rate after transplantation in future will expand the therapeutic potential of BMMSCs.
Conclusion
In the present study, we show that Tak1 is a crucial molecule for the activation of cell cycling in BMMSCs. Inhibition of Tak1 leads to synchronization in quiescence both in vitro and in vivo. Tak1 can be activated by various growth factors, and, in turn, it activates cell cycling of BMMSCs through stabilization of Yap1/Taz. The quiescent induction by Tak1 inhibition provides stress tolerance and improved engraftment properties to the BMMSCs. Thus, Tak1 is an important molecule not only for clarifying stem cell self‐renewal, but also for improving the therapeutic effect of BMMSCs.
Author Contributions
Y.O.: experiment design, collection and assembly of data, data analysis, manuscript writing; T. Teramura: conception and design, data analysis and interpretation, manuscript writing, final approval of manuscript; T. Takehara: collection and assembly of data, data analysis; K.F.: administrative support, data analysis and interpretation.
Disclosure of Potential Conflicts of Interest
The authors indicated no potential conflicts of interest.
Supporting information
Appendix S1. Supporting Information.
Supplementary figure S1 Effect of Tak1 inhibition on cell proliferation of human BMMSCs.
Dose dependent effect of 5zox on hBMMSC proliferation.
Supplementary figure S2 Effect of siRNA against Tak1 on the cell proliferation of BMMSC in vitro.
A, Expression change of Tak1 mRNA by siTak1 treatment. Asterisk means significant differences between control and the siTak1 treated group at P < .05 (N = 3).
B, WB for Tak1 of the BMMSCs treated with siTak1.
C, Effect of siTak1 on cell proliferation of BMMSCs. Asterisk means significant differences between control and the siTak1 treated group at P < .05 (N = 3).
Supplementary figure S3 Effect of siRNA against Tak1 on the cell cycle status of BMMSC in vivo.
FACS analysis of cell cycle status of the BMMSCs collected from juvenile male mice (day14 after birth) treated with the scrambled control RNA or siRNA against Tak1 (siTak1). Asterisks mean significant differences between control and the 5zox treated group at P < .05 (N = 6).
Supplementary figure S4 Effect of Tak1 inhibition on cell cycle status and cell viability.
A, FACS analysis of cell cycle status in the BMMSCs treated with vehicle (same amount of DMSO) or 5zox by the fucci G1‐orange/S/G2M‐green system. NTC means nontreatment control. 5zox treatment was performed at 20 nM for 6 days.
B, western blot (WB) based caspase 3 assay for the BMMSCs treated with 5zox. Full means uncleaved caspase 3 with full molecular weight maintained. Cleaved means caspase 3 treated with digestion as a result of apoptosis.
C, observation of apoptosis/necrosis by PI/Annexin V (AnV) staining. PI/AnV double positive population means cell population undergoing necrosis or late apoptosis. PInegative/AnV positive fraction means cell population undergoing necrosis or early apoptosis. 5zox treatments were performed for 6 days.
Supplementary figure S5 Effect of 5zox treatment on the cell cycle status of BMMSC in vivo.
FACS analysis of cell cycle status of the BMMSCs collected from juvenile male mice (day14 after birth) treated with the vehicle or 5zox three times each other day. The BMMSC populations were collected as PαS at 48 hours after final injection and the cell cycle status was analyzed with the Vybrant Dye Cycle Violet (Thermo). Asterisks mean significant differences between control and the 5zox treated group at P < .05 (N = 6).
Supplementary figure S6 Colony formation efficiency under TGFβ 1 and the inhibitor treatments. Asterisks mean significant differences between control and the TGFb or inhibitor treated groups at P < .05 (N = 3).
Supplementary figure S7 Effect of siRNA against Smad2,3, Erk1, and Erk2 on cell proliferation of BMMSCs.
A, Expression change of Smad2 mRNA by siRNA (siSmad2) treatment. Asterisk means significant differences (P < .05, N = 3). B, Cell proliferation of BMMSCs treated with scrabbled RNA (SCR) or siSmad2. NTC means non‐treatment control. C, Expression change of Smad3 mRNA by siSmad3 treatment. D, Cell proliferation of BMMSCs treated with SCR or siSmad3. E, Expression change of Erk1 mRNA by siErk1 treatment. F, Cell proliferation of BMMSCs treated with SCR or siErk1. G, Expression change of Erk2 mRNA by siErk2 treatment. H, Cell proliferation of BMMSCs treated with SCR or siErk2.
Supplementary figure S8 ROS accumulation detected by CellROX DeepRed dye and FACS in the transplanted BMMSCs
A, detection of the transplanted BMMSCs in the grafted site using the EGFP signaling. B, CellRox‐based observation of ROS accumulation in transplanted cells. 5zox represents the transplanted EGFP+ cells that were pre‐treated with 5zox before transplantation. The CellROX analysis was performed as follows; total BM cells were collected from the recipients, then reacted with CellROX‐DeepRed dye following manufacturer's instructions. Then the cells were analyzed with FACS Aria II. Transplanted cells were identified with EGFP fluorescence and then observed ROS accumulation with Ex644nm/Em665nm fluorescence of the CellROX dye.
Supplementary figure S9 Increased expression of the genes contribute wound healing and immunomodulation.
A, increased expression status of the wound healing‐ and immunomodulation‐related cytokines were detected by microarray analysis. Scores show fold change in expression (vehicle control/5zox treatment), and scores under 0 mean upregulation in the 5zox treated BMMSCs. 5zox treatment was performed at 20 nM for 6 days. B, qRT‐PCR based validation of the gene expression changes in the 5zox‐treated BMMSCs. 5zox treatment was performed at 40 nM for 48 hours. Asterisks mean significant differences between vehicle control and the 5zox treated cells at P < .05 (N = 3).
Supporting Information Table S1 Primer sequences used in this study.
Supporting Information Table S2 Antibodies used in WB of this study.
Acknowledgments
This work was supported by JSPS KAKENHI Grant no. 17K11036 and 19K09562. This work was also funded by the Sasakawa Scientific Research Grant and Takeda Scientific Foundation. The BM tissues of fucci‐TG mice were kindly gifted by Dr. Shiki Takamura, Kindai University Faculty of Medicine.
Data Availability Statement
The data that support the findings of this study are available from the corresponding author upon reasonable request.
References
- 1. Andrzejewska A, Lukomska B, Janowski M. Mesenchymal stem cells: From roots to boost. Stem Cells 2019;37:855–864. [DOI] [PMC free article] [PubMed] [Google Scholar]
- 2. Naji A, Favier B, Deschaseaux F et al. Mesenchymal stem/stromal cell function in modulating cell death. Stem Cell Res Ther 2019;10:56. [DOI] [PMC free article] [PubMed] [Google Scholar]
- 3. Ding W, Knox TR, Tschumper RC et al. Platelet‐derived growth factor (PDGF)‐PDGF receptor interaction activates bone marrow‐derived mesenchymal stromal cells derived from chronic lymphocytic leukemia: Implications for an angiogenic switch. Blood 2010;116:2984–2993. [DOI] [PMC free article] [PubMed] [Google Scholar]
- 4. Ng F, Boucher S, Koh S et al. PDGF, TGF‐beta, and FGF signaling is important for differentiation and growth of mesenchymal stem cells (MSCs): Transcriptional profiling can identify markers and signaling pathways important in differentiation of MSCs into adipogenic, chondrogenic, and osteogenic lineages. Blood 2008;112:295–307. [DOI] [PubMed] [Google Scholar]
- 5. Zhang YE. Non‐Smad pathways in TGF‐beta signaling. Cell Res 2009;19:128–139. [DOI] [PMC free article] [PubMed] [Google Scholar]
- 6. Ninomiya‐Tsuji J, Kishimoto K, Hiyama A et al. The kinase TAK1 can activate the NIK‐I kappaB as well as the MAP kinase cascade in the IL‐1 signalling pathway. Nature 1999;398:252–256. [DOI] [PubMed] [Google Scholar]
- 7. Wan YY, Chi H, Xie M et al. The kinase TAK1 integrates antigen and cytokine receptor signaling for T cell development, survival and function. Nat Immunol 2006;7:851–858. [DOI] [PubMed] [Google Scholar]
- 8. Stockert J, Wolf A, Kaddatz K et al. Regulation of TAK1/TAB1‐mediated IL‐1beta signaling by cytoplasmic PPARbeta/delta. PLoS One 2013;8:e63011. [DOI] [PMC free article] [PubMed] [Google Scholar]
- 9. Shim JH, Greenblatt MB, Xie M et al. TAK1 is an essential regulator of BMP signalling in cartilage. EMBO J 2009;28:2028–2041. [DOI] [PMC free article] [PubMed] [Google Scholar]
- 10. Shinohara H, Nagashima T, Cascalho MI et al. TAK1 maintains the survival of immunoglobulin lambda‐chain‐positive B cells. Genes Cells 2016;21:1233–1243. [DOI] [PubMed] [Google Scholar]
- 11. Gunnell LM, Jonason JH, Loiselle AE et al. TAK1 regulates cartilage and joint development via the MAPK and BMP signaling pathways. J Bone Miner Res 2010;25:1784–1797. [DOI] [PMC free article] [PubMed] [Google Scholar]
- 12. Gao L, Sheu TJ, Dong Y et al. TAK1 regulates SOX9 expression in chondrocytes and is essential for postnatal development of the growth plate and articular cartilages. J Cell Sci 2013;126:5704–5713. [DOI] [PMC free article] [PubMed] [Google Scholar]
- 13. Song Z, Liu C, Iwata J et al. Mice with Tak1 deficiency in neural crest lineage exhibit cleft palate associated with abnormal tongue development. J Biol Chem 2013;288:10440–10450. [DOI] [PMC free article] [PubMed] [Google Scholar]
- 14. van Beuningen HM, de Vries‐van Melle ML, Vitters EL et al. Inhibition of TAK1 and/or JAK can rescue impaired chondrogenic differentiation of human mesenchymal stem cells in osteoarthritis‐like conditions. Tissue Eng Part A 2014;20:2243–2252. [DOI] [PMC free article] [PubMed] [Google Scholar]
- 15. Hoffmann A, Preobrazhenska O, Wodarczyk C et al. Transforming growth factor‐beta‐activated kinase‐1 (TAK1), a MAP3K, interacts with Smad proteins and interferes with osteogenesis in murine mesenchymal progenitors. J Biol Chem 2005;280:27271–27283. [DOI] [PubMed] [Google Scholar]
- 16. Ogura Y, Hindi SM, Sato S et al. TAK1 modulates satellite stem cell homeostasis and skeletal muscle repair. Nat Commun 2015;6:10123. [DOI] [PMC free article] [PubMed] [Google Scholar]
- 17. Zhu H, Guo ZK, Jiang XX et al. A protocol for isolation and culture of mesenchymal stem cells from mouse compact bone. Nat Protoc 2010;5:550–560. [DOI] [PubMed] [Google Scholar]
- 18. Sakaguchi Y, Sekiya I, Yagishita K et al. Comparison of human stem cells derived from various mesenchymal tissues: Superiority of synovium as a cell source. Arthritis Rheum 2005;52:2521–2529. [DOI] [PubMed] [Google Scholar]
- 19. Sakaue‐Sawano A, Kurokawa H, Morimura T et al. Visualizing spatiotemporal dynamics of multicellular cell‐cycle progression. Cell 2008;132:487–498. [DOI] [PubMed] [Google Scholar]
- 20. Zielke N, Edgar BA. FUCCI sensors: Powerful new tools for analysis of cell proliferation. Wiley Interdiscip Rev Dev Biol 2015;4:469–487. [DOI] [PMC free article] [PubMed] [Google Scholar]
- 21. Kushida T, Inaba M, Hisha H et al. Intra‐bone marrow injection of allogeneic bone marrow cells: A powerful new strategy for treatment of intractable autoimmune diseases in MRL/lpr mice. Blood 2001;97:3292–3299. [DOI] [PubMed] [Google Scholar]
- 22. Nakamura K, Inaba M, Sugiura K et al. Enhancement of allogeneic hematopoietic stem cell engraftment and prevention of GVHD by intra‐bone marrow bone marrow transplantation plus donor lymphocyte infusion. Stem Cells 2004;22:125–134. [DOI] [PubMed] [Google Scholar]
- 23. Ninomiya‐Tsuji J, Kajino T, Ono K et al. A resorcylic acid lactone, 5Z‐7‐oxozeaenol, prevents inflammation by inhibiting the catalytic activity of TAK1 MAPK kinase kinase. J Biol Chem 2003;278:18485–18490. [DOI] [PubMed] [Google Scholar]
- 24. Liu CY, Zha ZY, Zhou X et al. The hippo tumor pathway promotes TAZ degradation by phosphorylating a phosphodegron and recruiting the SCF{beta}‐TrCP E3 ligase. J Biol Chem 2010;285:37159–37169. [DOI] [PMC free article] [PubMed] [Google Scholar]
- 25. Hu JK, Du W, Shelton SJ et al. An FAK‐YAP‐mTOR signaling axis regulates stem cell‐based tissue renewal in mice. Cell Stem Cell 2017;21:91.e106–106.e106. [DOI] [PMC free article] [PubMed] [Google Scholar]
- 26. Yang H, Guo Y, Wang D et al. Effect of TAK1 on osteogenic differentiation of mesenchymal stem cells by regulating BMP‐2 via Wnt/beta‐catenin and MAPK pathway. Organogenesis 2018;14:36–45. [DOI] [PMC free article] [PubMed] [Google Scholar]
- 27. Zhang Y, O'Keefe RJ, Jonason JH. BMP‐TAK1 (MAP3K7) induces adipocyte differentiation through PPARgamma signaling. J Cell Biochem 2017;118:204–210. [DOI] [PMC free article] [PubMed] [Google Scholar]
- 28. Yamaguchi K, Shirakabe K, Shibuya H et al. Identification of a member of the MAPKKK family as a potential mediator of TGF‐beta signal transduction. Science 1995;270:2008–2011. [DOI] [PubMed] [Google Scholar]
- 29. Wang C, Ke Y, Liu S et al. Ectopic fibroblast growth factor receptor 1 promotes inflammation by promoting nuclear factor‐kappaB signaling in prostate cancer cells. J Biol Chem 2018;293:14839–14849. [DOI] [PMC free article] [PubMed] [Google Scholar]
- 30. Salazar L, Kashiwada T, Krejci P et al. Fibroblast growth factor receptor 3 interacts with and activates TGFbeta‐activated kinase 1 tyrosine phosphorylation and NFkappaB signaling in multiple myeloma and bladder cancer. PLoS One 2014;9:e86470. [DOI] [PMC free article] [PubMed] [Google Scholar]
- 31. Sylvain‐Prevost S, Ear T, Simard FA et al. Activation of TAK1 by chemotactic and growth factors, and its impact on human neutrophil signaling and functional responses. J Immunol 2015;195:5393–5403. [DOI] [PubMed] [Google Scholar]
- 32. Widera D, Mikenberg I, Elvers M et al. Tumor necrosis factor alpha triggers proliferation of adult neural stem cells via IKK/NF‐kappaB signaling. BMC Neurosci 2006;7:64. [DOI] [PMC free article] [PubMed] [Google Scholar]
- 33. Muthukrishnan SD, Yang X, Friesel R et al. Concurrent BMP7 and FGF9 signalling governs AP‐1 function to promote self‐renewal of nephron progenitor cells. Nat Commun 2015;6:10027. [DOI] [PMC free article] [PubMed] [Google Scholar]
- 34. Deng P, Zhou C, Alvarez R et al. Inhibition of IKK/NF‐kappaB signaling enhances differentiation of mesenchymal stromal cells from human embryonic stem cells. Stem Cell Rep 2016;6:456–465. [DOI] [PMC free article] [PubMed] [Google Scholar]
- 35. Ahn HJ, Lee WJ, Kwack K et al. FGF2 stimulates the proliferation of human mesenchymal stem cells through the transient activation of JNK signaling. FEBS Lett 2009;583:2922–2926. [DOI] [PubMed] [Google Scholar]
- 36. Kang YJ, Jeon ES, Song HY et al. Role of c‐Jun N‐terminal kinase in the PDGF‐induced proliferation and migration of human adipose tissue‐derived mesenchymal stem cells. J Cell Biochem 2005;95:1135–1145. [DOI] [PubMed] [Google Scholar]
- 37. Nishimura M, Shin MS, Singhirunnusorn P et al. TAK1‐mediated serine/threonine phosphorylation of epidermal growth factor receptor via p38/extracellular signal‐regulated kinase: NF‐{kappa}B‐independent survival pathways in tumor necrosis factor alpha signaling. Mol Cell Biol 2009;29:5529–5539. [DOI] [PMC free article] [PubMed] [Google Scholar]
- 38. El Alami M, Vina‐Almunia J, Gambini J et al. Activation of p38, p21, and NRF‐2 mediates decreased proliferation of human dental pulp stem cells cultured under 21% O2 . Stem Cell Rep 2014;3:566–573. [DOI] [PMC free article] [PubMed] [Google Scholar]
- 39. Sheng L, Mao X, Yu Q et al. Effect of the PI3K/AKT signaling pathway on hypoxia‐induced proliferation and differentiation of bone marrow‐derived mesenchymal stem cells. Exp Ther Med 2017;13:55–62. [DOI] [PMC free article] [PubMed] [Google Scholar]
- 40. Tang Y, Weiss SJ. Snail/Slug‐YAP/TAZ complexes cooperatively regulate mesenchymal stem cell function and bone formation. Cell Cycle 2017;16:399–405. [DOI] [PMC free article] [PubMed] [Google Scholar]
- 41. Qin H, Hejna M, Liu Y et al. YAP induces human naive pluripotency. Cell Rep 2016;14:2301–2312. [DOI] [PMC free article] [PubMed] [Google Scholar]
- 42. Zhao Y, Khanal P, Savage P et al. YAP‐induced resistance of cancer cells to antitubulin drugs is modulated by a Hippo‐independent pathway. Cancer Res 2014;74:4493–4503. [DOI] [PubMed] [Google Scholar]
- 43. Zhao B, Ye X, Yu J et al. TEAD mediates YAP‐dependent gene induction and growth control. Genes Dev 2008;22:1962–1971. [DOI] [PMC free article] [PubMed] [Google Scholar]
- 44. Ota M, Sasaki H. Mammalian Tead proteins regulate cell proliferation and contact inhibition as transcriptional mediators of Hippo signaling. Development 2008;135:4059–4069. [DOI] [PubMed] [Google Scholar]
- 45. Moroishi T, Park HW, Qin B et al. A YAP/TAZ‐induced feedback mechanism regulates Hippo pathway homeostasis. Genes Dev 2015;29:1271–1284. [DOI] [PMC free article] [PubMed] [Google Scholar]
- 46. Chen Q, Zhang N, Xie R et al. Homeostatic control of Hippo signaling activity revealed by an endogenous activating mutation in YAP. Genes Dev 2015;29:1285–1297. [DOI] [PMC free article] [PubMed] [Google Scholar]
- 47. Zhao B, Li L, Tumaneng K et al. A coordinated phosphorylation by Lats and CK1 regulates YAP stability through SCF(beta‐TRCP). Genes Dev 2010;24:72–85. [DOI] [PMC free article] [PubMed] [Google Scholar]
- 48. Varelas X. The Hippo pathway effectors TAZ and YAP in development, homeostasis and disease. Development 2014;141:1614–1626. [DOI] [PubMed] [Google Scholar]
- 49. Zhang D, Gaussin V, Taffet GE et al. TAK1 is activated in the myocardium after pressure overload and is sufficient to provoke heart failure in transgenic mice. Nat Med 2000;6:556–563. [DOI] [PubMed] [Google Scholar]
- 50. Fukuno N, Matsui H, Kanda Y et al. TGF‐beta‐activated kinase 1 mediates mechanical stress‐induced IL‐6 expression in osteoblasts. Biochem Biophys Res Commun 2011;408:202–207. [DOI] [PubMed] [Google Scholar]
- 51. Codelia VA, Sun G, Irvine KD. Regulation of YAP by mechanical strain through Jnk and Hippo signaling. Curr Biol 2014;24:2012–2017. [DOI] [PMC free article] [PubMed] [Google Scholar]
- 52. Pallafacchina G, Francois S, Regnault B et al. An adult tissue‐specific stem cell in its niche: A gene profiling analysis of in vivo quiescent and activated muscle satellite cells. Stem Cell Res 2010;4:77–91. [DOI] [PubMed] [Google Scholar]
- 53. Moya A, Larochette N, Paquet J et al. Quiescence preconditioned human multipotent stromal cells adopt a metabolic profile favorable for enhanced survival under ischemia. Stem Cells 2017;35:181–196. [DOI] [PubMed] [Google Scholar]
- 54. Rumman M, Dhawan J, Kassem M. Concise review: Quiescence in adult stem cells: Biological significance and relevance to tissue regeneration. Stem Cells 2015;33:2903–2912. [DOI] [PubMed] [Google Scholar]
- 55. Benoit DS, Tripodi MC, Blanchette JO et al. Integrin‐linked kinase production prevents anoikis in human mesenchymal stem cells. J Biomed Mater Res A 2007;81:259–268. [DOI] [PubMed] [Google Scholar]
- 56. Hass R, Kasper C, Bohm S et al. Different populations and sources of human mesenchymal stem cells (MSC): A comparison of adult and neonatal tissue‐derived MSC. Cell Commun Signal 2011;9:12. [DOI] [PMC free article] [PubMed] [Google Scholar]
- 57. Potier E, Ferreira E, Meunier A et al. Prolonged hypoxia concomitant with serum deprivation induces massive human mesenchymal stem cell death. Tissue Eng 2007;13:1325–1331. [DOI] [PubMed] [Google Scholar]
- 58. Rumman M, Majumder A, Harkness L et al. Induction of quiescence (G0) in bone marrow stromal stem cells enhances their stem cell characteristics. Stem Cell Res 2018;30:69–80. [DOI] [PubMed] [Google Scholar]
- 59. Lewis EE, Wheadon H, Lewis N et al. A quiescent, regeneration‐responsive tissue engineered mesenchymal stem cell bone marrow niche model via magnetic levitation. ACS Nano 2016;10:8346–8354. [DOI] [PubMed] [Google Scholar]
- 60. Ezquer FE, Ezquer ME, Vicencio JM et al. Two complementary strategies to improve cell engraftment in mesenchymal stem cell‐based therapy: Increasing transplanted cell resistance and increasing tissue receptivity. Cell Adh Migr 2017;11:110–119. [DOI] [PMC free article] [PubMed] [Google Scholar]
Associated Data
This section collects any data citations, data availability statements, or supplementary materials included in this article.
Supplementary Materials
Appendix S1. Supporting Information.
Supplementary figure S1 Effect of Tak1 inhibition on cell proliferation of human BMMSCs.
Dose dependent effect of 5zox on hBMMSC proliferation.
Supplementary figure S2 Effect of siRNA against Tak1 on the cell proliferation of BMMSC in vitro.
A, Expression change of Tak1 mRNA by siTak1 treatment. Asterisk means significant differences between control and the siTak1 treated group at P < .05 (N = 3).
B, WB for Tak1 of the BMMSCs treated with siTak1.
C, Effect of siTak1 on cell proliferation of BMMSCs. Asterisk means significant differences between control and the siTak1 treated group at P < .05 (N = 3).
Supplementary figure S3 Effect of siRNA against Tak1 on the cell cycle status of BMMSC in vivo.
FACS analysis of cell cycle status of the BMMSCs collected from juvenile male mice (day14 after birth) treated with the scrambled control RNA or siRNA against Tak1 (siTak1). Asterisks mean significant differences between control and the 5zox treated group at P < .05 (N = 6).
Supplementary figure S4 Effect of Tak1 inhibition on cell cycle status and cell viability.
A, FACS analysis of cell cycle status in the BMMSCs treated with vehicle (same amount of DMSO) or 5zox by the fucci G1‐orange/S/G2M‐green system. NTC means nontreatment control. 5zox treatment was performed at 20 nM for 6 days.
B, western blot (WB) based caspase 3 assay for the BMMSCs treated with 5zox. Full means uncleaved caspase 3 with full molecular weight maintained. Cleaved means caspase 3 treated with digestion as a result of apoptosis.
C, observation of apoptosis/necrosis by PI/Annexin V (AnV) staining. PI/AnV double positive population means cell population undergoing necrosis or late apoptosis. PInegative/AnV positive fraction means cell population undergoing necrosis or early apoptosis. 5zox treatments were performed for 6 days.
Supplementary figure S5 Effect of 5zox treatment on the cell cycle status of BMMSC in vivo.
FACS analysis of cell cycle status of the BMMSCs collected from juvenile male mice (day14 after birth) treated with the vehicle or 5zox three times each other day. The BMMSC populations were collected as PαS at 48 hours after final injection and the cell cycle status was analyzed with the Vybrant Dye Cycle Violet (Thermo). Asterisks mean significant differences between control and the 5zox treated group at P < .05 (N = 6).
Supplementary figure S6 Colony formation efficiency under TGFβ 1 and the inhibitor treatments. Asterisks mean significant differences between control and the TGFb or inhibitor treated groups at P < .05 (N = 3).
Supplementary figure S7 Effect of siRNA against Smad2,3, Erk1, and Erk2 on cell proliferation of BMMSCs.
A, Expression change of Smad2 mRNA by siRNA (siSmad2) treatment. Asterisk means significant differences (P < .05, N = 3). B, Cell proliferation of BMMSCs treated with scrabbled RNA (SCR) or siSmad2. NTC means non‐treatment control. C, Expression change of Smad3 mRNA by siSmad3 treatment. D, Cell proliferation of BMMSCs treated with SCR or siSmad3. E, Expression change of Erk1 mRNA by siErk1 treatment. F, Cell proliferation of BMMSCs treated with SCR or siErk1. G, Expression change of Erk2 mRNA by siErk2 treatment. H, Cell proliferation of BMMSCs treated with SCR or siErk2.
Supplementary figure S8 ROS accumulation detected by CellROX DeepRed dye and FACS in the transplanted BMMSCs
A, detection of the transplanted BMMSCs in the grafted site using the EGFP signaling. B, CellRox‐based observation of ROS accumulation in transplanted cells. 5zox represents the transplanted EGFP+ cells that were pre‐treated with 5zox before transplantation. The CellROX analysis was performed as follows; total BM cells were collected from the recipients, then reacted with CellROX‐DeepRed dye following manufacturer's instructions. Then the cells were analyzed with FACS Aria II. Transplanted cells were identified with EGFP fluorescence and then observed ROS accumulation with Ex644nm/Em665nm fluorescence of the CellROX dye.
Supplementary figure S9 Increased expression of the genes contribute wound healing and immunomodulation.
A, increased expression status of the wound healing‐ and immunomodulation‐related cytokines were detected by microarray analysis. Scores show fold change in expression (vehicle control/5zox treatment), and scores under 0 mean upregulation in the 5zox treated BMMSCs. 5zox treatment was performed at 20 nM for 6 days. B, qRT‐PCR based validation of the gene expression changes in the 5zox‐treated BMMSCs. 5zox treatment was performed at 40 nM for 48 hours. Asterisks mean significant differences between vehicle control and the 5zox treated cells at P < .05 (N = 3).
Supporting Information Table S1 Primer sequences used in this study.
Supporting Information Table S2 Antibodies used in WB of this study.
Data Availability Statement
The data that support the findings of this study are available from the corresponding author upon reasonable request.