

Summary
The key basic helix–loop–helix (bHLH) transcription factor in iron (Fe) uptake, FER‐LIKE IRON DEFICIENCY‐INDUCED TRANSCRIPTION FACTOR (FIT), is controlled by multiple signaling pathways, important to adjust Fe acquisition to growth and environmental constraints. FIT protein exists in active and inactive protein pools, and phosphorylation of serine Ser272 in the C‐terminus, a regulatory domain of FIT, provides a trigger for FIT activation.
Here, we use phospho‐mutant activity assays and study phospho‐mimicking and phospho‐dead mutations of three additional predicted phosphorylation sites, namely at Ser221 and at tyrosines Tyr238 and Tyr278, besides Ser 272.
Phospho‐mutations at these sites affect FIT activities in yeast, plant, and mammalian cells. The diverse array of cellular phenotypes is seen at the level of cellular localization, nuclear mobility, homodimerization, and dimerization with the FIT‐activating partner bHLH039, promoter transactivation, and protein stability. Phospho‐mimicking Tyr mutations of FIT disturb fit mutant plant complementation.
Taken together, we provide evidence that FIT is activated through Ser and deactivated through Tyr site phosphorylation. We therefore propose that FIT activity is regulated by alternative phosphorylation pathways.
Keywords: Arabidopsis, bHLH039, FIT, iron uptake, IRT1, serine phosphorylation, transcription factor, tyrosine phosphorylation
Introduction
Acquisition of trace elements such as iron (Fe) is indispensable for metabolic pathways, crop yield, and high‐quality nutritious food. Biofortification offers the chance to reduce Fe‐deficiency anemia in humans but relies on elaborate knowledge of nutrient sensing, uptake, and signaling (Connorton et al., 2017). Most Fe is not soluble, and therefore not bioavailable in the soil. Plants must therefore mobilize Fe in the soil before they can take it up through their roots. For that, plants balance the need for Fe in their metabolism and the toxic effects that heavy metal ions can have in cells (Connorton et al., 2017). Arabidopsis thaliana serves as model for uncovering regulatory events for Fe acquisition. As a representative of nongraminaceous angiosperm species, it uses the so‐called Strategy I. Hallmarks of this strategy in Arabidopsis are reduction of ferric (Fe3+) to ferrous Fe (Fe2+) by FERRIC REDUCTION OXIDASE2 (FRO2) (Robinson et al., 1999) and uptake of Fe2+ ions by IRON‐REGULATED TRANSPORTER1 (IRT1) (Eide et al., 1996; Vert et al., 2002). In contrast, Strategy II Fe acquisition is mediated by phytosiderophore‐based Fe3+ chelation (Marschner et al., 1986).
The expression of FRO2, IRT1, and more than 30 other Fe‐deficiency‐induced genes is controlled from early to late vegetative growth stages by the essential subgroup IIIa basic helix–loop–helix (bHLH) FER‐LIKE IRON DEFICIENCY‐INDUCED TRANSCRIPTION FACTOR (FIT; Heim et al., 2003; Colangelo & Guerinot, 2004; Jakoby et al., 2004; Yuan et al., 2005; Mai et al., 2016). fit mutant plants with complete FIT failure, homozygous for the fit‐3 loss‐of‐function allele, develop a strong Fe‐deficiency leaf chlorosis, a phenotype caused by the inability to take up sufficient amounts of environmental Fe by roots (Jakoby et al., 2004). This displays the pivotal role of FIT in the Fe‐deficiency response, and particularly in upregulating Fe acquisition genes in roots.
FIT activity is mainly controlled at protein level through protein–protein interactions. Upon low Fe (−Fe), subgroup Ib bHLH proteins bHLH038/039/100/101 are induced and heterodimerize with FIT, which enhances FIT expression and FIT protein activity for inducing downstream FIT target gene expression (Wang et al., 2007, 2013; Yuan et al., 2008; Naranjo‐Arcos et al., 2017). Among subgroup Ib BHLH genes, BHLH039 serves as a robust marker for Fe‐deficiency responses (Ivanov et al., 2012) and promotes Fe acquisition via FIT when overexpressed (Naranjo‐Arcos et al., 2017). Although the amount of FIT protein in a FIT overexpression situation can by far exceed that of FIT protein in wild‐type (WT), FIT target gene induction remains comparable and restricted to −Fe (Jakoby et al., 2004; Meiser et al., 2011). FIT protein is thus present in a rather small active and in a large inactive pool. FIT is also controlled at the level of protein abundance and stability. FIT undergoes proteasomal degradation, and both FIT pools are targets of the proteasome (Lingam et al., 2011; Meiser et al., 2011). Despite that, FIT abundance is often lower at −Fe than at +Fe when overexpressed (Lingam et al., 2011; Meiser et al., 2011; Sivitz et al., 2011). Presumably, in order to maintain Fe‐deficiency responses, FIT must become activated and active FIT is being degraded to ‘refresh’ target sites, which could be beneficial for the cell to remain responsive to quick changes in nutrient abundance (Meiser et al., 2011; Sivitz et al., 2011). Posttranslational modification differentiates between active and inactive FIT. A small pool of FIT protein is phosphorylated, and calcium‐sensing CBL‐INTERACTING PROTEIN KINASE11 (CIPK11) targets position Ser272 of FIT and activates it. Ser272 is crucial for FIT to localize in the nucleus, interact with bHLH039, and activate FIT targets so that plants ultimately take up Fe and transport it to seeds (Gratz et al., 2019). Interestingly, Ser272 is present in the C‐terminal part of FIT, which can be regarded as a regulatory domain of FIT, FIT‐C. A dynamic protein interaction network, particularly involving the FIT‐C domain, enables the cell to quickly react to changes in Fe availability and adapt Fe uptake to environmental constraints by fine‐tuning FIT protein activity beyond phosphorylation (Lingam et al., 2011; Le et al., 2016; Wild et al., 2016; Cui et al., 2018).
Phosphorylation events contribute to protein activation, and antagonistic mechanisms often ensure responsiveness to quickly changing conditions by a balanced protein activity. For example, cold‐responsive bHLH protein INDUCER OF CBF EXPRESSION1 (ICE1; Chinnusamy et al., 2003) is cold activated by phosphorylation of Ser278 through SnRK2.6/OPEN STOMATA 1 (OST1; Ding et al., 2015). MITOGEN‐ACTIVATED PROTEIN KINASEs 3 and 6 (MAPK3 and ‐6) facilitate additional ICE1 phosphorylation with diametrically opposite effects on stability, causing proteasomal degradation of ICE1 (Li H. et al., 2017; Zhao et al., 2017).
Plant tyrosine (Tyr) phosphorylation is mainly associated with proteins having kinase or transferase activity (Sugiyama et al., 2008). Only a few transcription factors were identified to be Tyr‐phosphorylated until today. One of them, Coptis japonica WRKY‐type transcription factor CjWRKY1 for alkaloid biosynthesis, displays enhanced cytosolic localization, reduced transactivation activity, and a protein turnover phenotype of its Tyr phospho‐mimicking mutant (Yamada & Sato, 2016).
In vivo studies of the mechanisms leading to FIT phosphorylation are very difficult. Owing to the low amounts of FIT protein in planta and the small fractions of phosphorylated forms thereof, individual phosphorylation sites of FIT cannot be identified directly (Gratz et al., 2019). Proving phosphorylation by kinases requires prior knowledge of the concrete interacting protein kinase, but another kinase type besides a calcium‐dependent CIPK is not known (Gratz et al., 2019).
We therefore used an alternative approach and show here that a phospho‐mutant activity screening approach can be successfully applied to overcome the obstacles described and to determine the functional importance of novel predicted phosphorylation sites in cellular biochemical activity assays. Synthetic biology plays a fundamental role in elucidating functional modules in mammalian and insect cell signaling. The circumstance that complex plant signaling modules with multiple endogenous connections between physiological, developmental, hormonal, and environmental pathways can be studied in experimental systems with reduced complexity is becoming increasingly recognized as an advantage to quantify properties of plant signaling modules (Samodelov & Zurbriggen, 2017). We demonstrate that phospho‐mimicking and phospho‐dead Ser and Tyr mutations affect diverse cellular FIT transcription factor activities in an opposite manner. We conclude that phosphorylation of Ser sites in FIT‐C activates FIT, whereas that of Tyr sites deactivates FIT. These findings render future examination of Ser and Tyr modification of FIT possible to manipulate Fe acquisition regulation and to investigate novel Tyr phosphorylation control mechanisms in plants.
Materials and Methods
Multiple sequence alignment of FIT orthologues
Arabidopsis full‐length FIT protein sequence was blasted against protein sequences of every order of the angiosperms and several families among Brassicales (Cole et al., 2019). Hits with highest maximum score were re‐blasted against the Arabidopsis TAIR10 protein sequence collection, using The Arabidopsis Information Resource blast v.2.2.8. (Phoenix Bioinformatics Corp., Fremont, CA, USA) FIT was aligned to the two other members of A. thaliana bHLH subgroup IIIa, AT2G16910 and AT4G21330, using the muscle algorithm (Heim et al., 2003; Edgar, 2004).
Site‐directed mutagenesis and generation of plasmids for cellular assays
Plasmids with genomic DNA or complementary DNA (cDNA) sequences for intermediate cloning steps and experiments were generated by PCR, subsequent Gateway (Life Technologies), Gibson assembly cloning (New England Biolabs, Ipswich, MA, USA), or AQUA cloning (Beyer et al., 2015) and verified by sequencing (see list of recombinant plasmids used/constructed in Supporting Information Table S1; primers for plasmid generation are in Table S2). Site‐directed mutagenesis was conducted by PCR with genomic FIT to create phospho‐mutant gFITm forms, namely FITm(S221A), FITm(S221E), FITm(S221E/SS271/272AA), FITm(Y238F), FITm(Y238E), FITm(Y278F), and FITm(Y278E), as described previously (Gratz et al., 2019) for FITm(SS271/272AA). Briefly, methylated template plasmid DNA was eliminated by DpnI treatment before DH5α Escherichia coli transformation. FIT and FITm coding sequences without introns were obtained from cDNA prepared from transiently transformed Nicotiana benthamiana leaves with expression plasmids containing gFIT‐GFP and gFITm‐GFP forms (GFP, green fluorescent protein).
Transient expression in tobacco leaf epidermis cells
Tobacco (N. benthamiana) leaf epidermal cells were transiently transformed by infiltration with Agrobacterium (Rhizobium radiobacter) GV3101 (pMP90) strain containing the respective plant expression vectors, as described (Gratz et al., 2019).
Subcellular localization of GFP fusion proteins
The cytoplasm‐to‐nucleus ratio for FIT‐GFP and FITm‐GFP was determined 48 h after tobacco leaf infiltration with agrobacteria containing pMDC83:gFITns‐GFP or pMDC83:gFITmns‐GFP forms (Table S1), as described previously (Gratz et al., 2019). Briefly, Z‐stack images taken with an LSM780 laser‐scanning confocal microscope (Zeiss) were exported to .tiff and converted to grayscale format. The cytoplasm‐to‐nucleus ratio was calculated by accessing the fluorescence signal intensity once for the nucleus, and once for the cell while excluding the nucleus, with imageJ software (US National Institutes of Health, Bethesda, MD, USA). For each independent experiment, several cells from one or two leaves of a transiently transformed tobacco plant were imaged and the fluorescence ratios quantified (n = 6–11 cells). Three experiments using independently transformed plants were performed.
Nuclear mobility of GFP fusion proteins
Fluorescence recovery after photobleaching (FRAP) experiments were conducted 48 h after tobacco leaf infiltration with agrobacteria containing pMDC83:gFITns‐GFP or pMDC83:gFITmns‐GFP forms, as described (Gratz et al., 2019). In brief, using an LSM780 laser‐scanning confocal microscope (Zeiss), a rectangular region of interest in the nucleus of a tobacco cell was chosen to determine initial GFP signal intensity and intensity after bleaching to monitor fluorescence recovery. Background fluorescence was subtracted from FRAP values, which were normalized to the mean of pre‐bleach values. Nonlinear curve fitting was performed (prism; GraphPad Software, San Diego, CA, USA) in order to assess the fluorescence intensities (Fig. S1). Using the initial fluorescence intensity F pre and the fluorescence intensity after photobleaching F post, the percentages of mobile fractions M f of FIT‐GFP and FITm‐GFP forms were calculated: M f = [(F end − F post)/(F pre − F post)] × 100 (Bancaud et al., 2010). For each construct, several nuclei were analyzed from two leaves of transiently transformed plants (n = 10–17 nuclei).
Homo‐ and heterodimerization using targeted yeast two‐hybrid assays
Yeast strain AH109 was co‐transformed with respective plasmids, pGBKT7‐GW:FIT‐C, pGBKT7‐GW:FIT‐Cm forms or pGBKT7‐GW:bHLH039 with N‐terminal fusion of GAL4 DNA binding domain (BD‐FIT or BD‐FITm forms), and pACT2‐GW:FIT‐C, pACT2‐GW:FIT‐Cm forms or pACT2‐GW:bHLH039 with N‐terminal fusion of GAL4 activation domain (AD‐FIT, AD‐FITm forms, AD‐bHLH039) (Table S1). Positive transformants were selected on synthetic defined (SD) medium lacking Leu and Trp (SD‐LW) and verified by colony‐PCR. To obtain appropriate negative controls, cells were co‐transformed with respective empty AD or BD plasmid controls. The combination of pGBT9.BS:CIPK23 and pGAD.GH:cAKT1 served as a positive control (Xu et al., 2006; Le et al., 2016). The screening for positive protein–protein interactions was performed on SD medium lacking Leu, Trp and His (SD‐LWH) in the presence of 0.5 mM 3‐amino‐1,2,4‐triazole (3‐AT), selective for interaction, in comparison with co‐transformation controls on SD‐LW medium, after spotting serial dilutions, as previously described and indicated in the text (Le et al., 2016). Plates were photographed after incubation at 30°C for 1 wk (heterodimerization) or 2 wk (homodimerization).
Homo‐ and heterodimerization assay by Förster resonance energy transfer–acceptor photobleaching in planta
Förster resonance energy transfer–acceptor photobleaching (FRET–APB) experiments were conducted 48 h after tobacco leaf infiltration with agrobacteria containing pABindGFP, pABindmCherry, and pABindFRET vectors recombinant for FIT, FITm forms, and BHLH039 to measure the homo‐ (FIT‐GFP + FIT‐mCherry or FITm‐GFP + FITm‐mCherry) or the heterodimerization (bHLH039‐GFP + FIT‐mCherry or bHLH039‐GFP and FITm‐mCherry) efficiency (Table S1). Donor proteins were additionally transformed single‐tagged with GFP and double‐tagged with GFP‐mCherry to serve as a negative and positive control. Gene expression was induced by spraying the leaves with a 20 μM β‐estradiol solution 16 h before FRET–APB measurements.
Measurements were operated with zen2 black edition software (Zeiss) at the confocal laser‐scanning‐microscope LSM780 (Zeiss). Fluorescence intensity for both fluorophores was detected within 20 frames in a 128 × 128 pixel format and a pixel time of 2.55 μs. After the fifth frame, 100% laser power (561 nm) was used to bleach mCherry using 80 iterations. FRET efficiency was calculated in percent as relative increase of GFP intensity after acceptor photobleaching. At least two independent experiments with 10 measured nuclei each were performed (n = 10 nuclei).
FIT transcriptional self‐activation assay in yeast
Yeast strain AH109 was co‐transformed with either pGBKT7‐GW:FIT (BD‐FIT) or pGBKT7‐GW:FITm (BD‐FITm) forms, as well as pACT2‐GW (empty AD) (Table S1), selected on SD‐LW media and verified by colony‐PCR. The screening for autoactivation was performed by assaying the growth on SD‐LWH media, containing either 0.5 or 90 mM 3‐AT in 10‐fold dilution series compared with SD‐LW co‐transformation controls. pGBT9.BS:CIPK23 and pGAD.GH:cAKT1 were used as a positive control (Xu et al., 2006; Le et al., 2016). Growth of colonies was recorded after incubation at 30°C for 1 wk.
Quantitative transactivation reporter gene assay for FIT in mammalian cells
The mammalian cell transactivation assay was conducted according to Muller et al. (2014). Briefly, Chinese hamster ovary (CHO) cells were seeded to a density of 40 000 cells per well in 500 μl of medium in 24‐well plates and transfected with a solution of 100 μl per well, containing pMZ333:FIT or pMZ333:FITm, pKM195:IRT1pro, and pMZ333:bHLH039, as indicated. 1 μg of plasmids in total was mixed, if necessary by adding stuffer plasmid pHB007:BFP (Table S1). The mix was exchanged 4 h after transfection and the supernatant collected 48 h after transfection for analysis of recombinant secreted alkaline phosphatase (SEAP) activity using a colorimetric assay and Gaussia luciferase activity as described (Schlatter et al., 2002; Remy & Michnick, 2006; Muller et al., 2014).
For immunoblot analysis, CHO cells were transfected with the same plasmid combinations, but replacing the aforementioned pMZ333 plasmids with the respective tagged pMZ333:FIT‐GFP, pMZ333:FITm‐GFP forms and pMZ333:HA3‐bHLH039 (Table S1). Protein extraction was performed according to Silva et al. (2018). Sample separation on sodium dodecyl sulfate (SDS) polyacrylamide gel electrophoresis (PAGE), immunodetection, and chemiluminescence signal recording were performed as previously described (Gratz et al., 2019), using mouse anti‐GFP (catalog no. 11814460001, 1 : 1000; Roche) followed by goat anti‐mouse immunoglobulin G horseradish peroxidase conjugate (catalog no. W4021, 1 : 5000; Promega) or anti‐HA‐peroxidase high‐affinity monoclonal rat antibody (3F10, catalog no. 12013819001, 1 : 1000; Roche) for immunodetection.
Quantitative cell‐free degradation assay
pMDC83:gFIT‐GFP and mutant pMDC83:gFITm‐GFP forms (Table S1) were transiently expressed in tobacco leaf epidermal cells. At 48 h post‐infiltration, leaves were ground in liquid nitrogen, weighed, and combined with ×2 Protein Loading Buffer in a 1.5 ml reaction tube (124 mM Tris‐Cl pH 6.8, 5% SDS, 4% dithiothreitol, 20% glycerol, 0.002% bromophenol blue), incubated on a rotating wheel for 10 min at room temperature, and subsequently pelleted by centrifugation at full speed (21 000 g) and 4°C. Then, 25 μl supernatant was aliquoted in four individual reaction tubes and incubated for 0, 60, 120 or 240 min at 25°C. Samples were then processed for SDS‐PAGE and immunoblot analysis as already described. Three individual tobacco transformations and degradation assays were performed. For proteasomal arrest, 100 μM MG132 (AbMole BioScience, Houston, TX, USA), prepared from a 100 mM stock dissolved in dimethyl sulfoxide (DMSO), was added to the protein extract before incubation at 25°C; DMSO alone was used as a control.
Quantification of the chemiluminescence signal was performed with the ‘Band Analysis’ module of the alphaview software (Cell Biosciences, Santa Clara, CA, USA), according to manufacturer's instructions for background‐corrected signal average. The signal value obtained from the first sample (0 min incubation at 25°C) was set to 100% and used to calculate the signal intensities of the remaining samples (60, 120 and 240 min). Means (± SD) of the values obtained were displayed as fitted curves using nonlinear regression (GraphPad prism). Individual curve fitting of single replicates was used to calculate half‐life times.
Arabidopsis fit complementation assay
Arabidopsis thaliana fit‐3 (fit) mutant and complemented pMDC83:gFIT‐GFP‐transformed pro35S::gFIT‐GFP/fit‐3 (FIT‐GFP/fit) plants are described (Jakoby et al., 2004; Gratz et al., 2019). Arabidopsis fit mutant plants were transformed with Tyr phospho‐mimicking pMDC83:gFITm(Y238E)‐GFP and pMDC83:gFITm(Y278E)‐GFP, resulting in the lines pro35S::gFITm(Y238E)‐GFP/fit‐3 (FITm(Y238E)‐GFP/fit) and pro35S::gFITm(Y278E)‐GFP/fit‐3 (FITm(Y278E)‐GFP/fit) by floral dip (Clough & Bent, 1998). Lines were multiplied by selfing until homozygous lines were obtained for analysis. Positive transformants and lines were selected based on hygromycin resistance, GFP fluorescence, immunoblot analysis and PCR genotyping.
For plant experiments, Arabidopsis seeds were sterilized and seedlings grown on upright sterile plates containing modified half‐strength Hoagland medium for 14 d. Then, plants were transferred for 3 d to new Hoagland plates with sufficient (50 μM FeNaEDTA, +Fe) or deficient (0 μM FeNaEDTA, −Fe) Fe supply, as described previously (Gratz et al., 2019). Roots were harvested.
Immunoblot analysis of FIT‐GFP/FITm‐GFP was conducted as described earlier. Gene expression analysis was performed by reverse transcription quantitative PCR using the procedures and primers as described (Ben Abdallah & Bauer, 2016; Gratz et al., 2019). Briefly, analysis was performed with SYBR Green detection. Absolute gene expression was determined by mass standard curve analysis and normalized to reference gene EF1B expression. The assay was performed in three biological replicates (n = 3), each with two technical replicates.
Statistical analysis
Statistical analysis was performed using a two‐tailed, unpaired Student's t‐test (P < 0.05) when comparing an individual phospho‐mutant with WT. When comparing WT and phospho‐mutants among themselves, P‐values were obtained using one‐way ANOVA, followed by a Tukey's post‐hoc test performed with OriginLab (Northampton, MA, USA). Different letters indicate statistically significant values (P < 0.05).
For box plot representation, outlier identification was based on the calculation of the interquartile range and determination of the inner and outer fences within a data set. A value that was located above the outer fence or below the inner fence was excluded from the analysis (Jacobs & Dinman, 2004). Outlier calculations were applied to the subcellular localization, nuclear mobility, FRET‐based protein–protein interaction, and to the FIT transactivation reporter gene assay dataset.
Results
Three‐step analysis of FIT protein sequence predicts novel phosphorylation target sites
Several bHLH transcription factors, including SPEECHLESS, are phosphorylated at multiple sites (Lampard et al., 2008; Gudesblat et al., 2012; Yang et al., 2015). Phosphorylatable amino acid residues usually occur as part of phosphorylation motifs and are often conserved in the protein amino acid sequence. This concept was applied to predict FIT phosphorylation sites.
In a first step, netphos 2.0 (Blom et al., 1999) in silico phospho‐site prediction in the FIT sequence resulted in a total of 21 amino acid hits, of which six residues were located in the C‐terminal part of FIT following the bHLH domain (FIT‐C; Fig. 1a). These six residues were of high interest, as several FIT protein–protein interactions are facilitated via FIT‐C, which we therefore consider to be a regulatory domain of FIT (Lingam et al., 2011; Le et al., 2016; Gratz et al., 2019).
Figure 1.

Analysis of FER‐LIKE IRON DEFICIENCY‐INDUCED TRANSCRIPTION FACTOR (FIT) protein sequence reveals novel putative phosphorylation target sites in FIT‐C. (a) Phosphorylation site prediction of FIT. Full‐length amino acid sequence of FIT (top), composed of an amino‐terminal (N‐term), basic helix–loop–helix (bHLH; gray), and carboxyl‐terminal (C‐term) region, also known as FIT‐C, divided by red bars. In silico prediction by netphos2.0 identified potential phosphorylation sites (bottom, bold), of which six are located in FIT‐C (bold, colored). Colors reflect the confidence score of the prediction. (b) Multiple sequence alignment, showing the FIT‐C region with putative phosphorylation sites, compared with orthologues in angiosperms. AtFIT is presented in bold, conserved putative phosphorylation sites are bold and underlined, and these sites are highlighted for comparison in gray. B.A., basal angiosperms, M., monocots, E., eudicots. (c) Sequence alignment of subgroup IIIa bHLH proteins, showing the FIT‐C region with putative phosphorylation sites. AtFIT full‐length protein sequence was aligned with bHLH proteins AT2G16910 and AT4G21330 (subgroup IIIa). FIT target sites are not conserved between the bHLH proteins. (d) Identification of phosphorylation motifs and phospho‐mutants of FIT‐C. Predicted phosphorylated amino acids are presented in bold, underlined; known phosphorylation motifs are highlighted in yellow. FIT target site phospho‐mutants are shown in gray boxes, with phospho‐dead (serine to alanine/S to A, tyrosine to phenylalanine/Y to F) and phospho‐mimicking (S, Y to glutamate/S, Y to E) FIT forms.
The number of potential phosphorylation sites was narrowed down by evolutionary conservation using a multiple sequence alignment between full‐length Arabidopsis FIT and respective FIT orthologues from angiosperms (Fig. 1b). Out of the six putative phosphorylation sites in FIT‐C, Ser256 is conserved exclusively in the order of the Brassicales, representing the least conserved position among the candidates. Ser221 is conserved within the family of Brassicaceae, as well as in species belonging to the commelinids and fabids. The two serines Ser271 and Ser272, previously characterized by us as FIT phosphorylation targets (Gratz et al., 2019), are conserved among the Brassicaceae. Interestingly, however, only one of the two Sers is conserved among members of the monocots, superasterids, and the remaining superrosids. Furthermore, two Tyrs are highly conserved throughout the angiosperms. FIT orthologues, ranging from the most distant order of Amborellales to the order of Apiales, possess a Tyr that aligns to Tyr238. Tyr278 was found to be conserved among the order of Brassicales as well as among the commelinids and the lamiids.
We included a full‐length sequence alignment between FIT and two A. thaliana bHLH proteins, ABORTED MICROSPORES (AT2G16910) and DYSFUNCTIONAL TAPETUM (AT4G21330), which together with FIT belong to the subgroup IIIa bHLH proteins (Heim et al., 2003; Fig. 1c). Both proteins do not show substantial sequence similarity with FIT in their C‐termini. Also, neither of these two bHLH proteins contains conserved residues that align with predicted FIT phosphorylation target sites. This suggests a specific function for the predicted sites in the FIT protein.
Finally, we identified phosphorylation motifs for four out of the six predicted phosphorylation target sites (Fig. 1d). The motif [pS/pT]X[R/K] (Pearson & Kemp, 1991) encompasses Ser221, which strengthens the assumption of Ser phosphorylation at this position. The additional phosphorylation motifs XXpSPX (Kemp & Pearson, 1990; Beausoleil et al., 2004; Luo et al., 2005; Schwartz & Gygi, 2005) and SXXXpS (Fiol et al., 1990) were found to enclose Ser271 and Ser272. This suggests that only one of the two neighboring Sers undergoes phosphorylation, to which we refer here as Ser272, which is concordant with our previous results (Gratz et al., 2019). The highly conserved Tyr238 is part of the motif pYXX[L/I/V] (Argetsinger et al., 2004). Another phosphorylation motif, SX[D/E]XpY, was assigned to Tyr278 (Amanchy et al., 2011), which reinforces the hypothesis of Tyr phosphorylation for both residues.
In summary, the three‐step in silico prediction, multiple‐sequence alignment, and phosphorylation motif identification permitted us to identify four most promising phosphorylation target sites in FIT‐C, namely Ser221, Tyr238, Tyr278, and the previously characterized Ser272 (Gratz et al., 2019).
To conduct a functional FIT phospho‐mutant activity screening, we generated phospho‐dead FITm mutations with Ser to Ala and Tyr to Phe substitutions and phospho‐mimicking FITm mutations with Ser or Tyr to Glu substitutions (Fig. 1d). With such a mutational approach, we recently showed relevance of Ser272 for FIT activity (Gratz et al., 2019). In the course of our work presented here, FITm(S221E) turned out to be more active than WT FIT, whereas FITm(S221A) behaved rather neutrally. Ser221 and Ser272 might be both used for phosphorylation. To investigate the effect of FITm(S221E) alone, we therefore included additionally the triple phospho‐mutant FITm(S221E/SS271/2AA) and compared it with single‐mutant FITm(S221E) and as a control to the previously characterized FITm(SS271/2AA) – also known as FITm(AA) in Gratz et al. (2019). These eight phospho‐mutants were tested for their effects on several FIT regulatory properties and cellular activities.
Cellular localization and nuclear mobility depend on FIT phospho‐mutant forms
Posttranslational phosphorylation affects protein properties, including subcellular localization (Ju et al., 2012; Ren et al., 2017; Takeo & Ito, 2017), and this is also the case for FIT (Gratz et al., 2019). The cytoplasm‐to‐nucleus ratio of FIT localization is in the range of 3–5 (Fig. 2). Out of the eight mutants tested, six FIT phospho‐mutants showed a significant increase of the cytoplasm‐to‐nucleus ratio. FITm(SS271/2AA) resulted in a significant increase, as expected (Gratz et al., 2019), whereas FITm(S221E) and FITm(S221E/SS271/2AA) cytoplasm‐to‐nucleus ratios increased greatly, by 180% and 300%, respectively (Fig. 2a,c). FITm(Y238F), FITm(Y278F), and FITm(Y278E) showed significantly increased ratios, by 150% to 350% compared with WT (Fig. 2b,c). There was no significant increase observed for FITm(S221A) and FITm(Y238E). Thus, depending on the phospho‐mutation, FIT protein is retained in the cytoplasm.
Figure 2.

FER‐LIKE IRON DEFICIENCY‐INDUCED TRANSCRIPTION FACTOR (FIT) subcellular compartmentalization is altered in FITm phospho‐mutants. (a, b) Quantification of cytoplasmic to nuclear fluorescence ratio of FIT‐green fluorescent protein (GFP) in comparison with (a) serine (Ser) and (b) tyrosine (Tyr) FITm forms. The subcellular localization was analyzed following transient expression in tobacco leaf epidermis cells by laser‐scanning confocal microscopy. Data are presented in box plots; interquartile range (IQR) 25–75%; whiskers: 25th percentile, −1.5 × IQR; 75th percentile, +1.5 × IQR; median, horizontal line within IQR box; mean, small square in IQR box; x, values outside ± 1.5 × IQR range. Asterisks indicate statistical significance between WT and individual mutants, determined by Student's t‐test (n = 6–11; *, P < 0.05; ***, P < 0.001). (c) Representative confocal images of leaf epidermis cells, expressing FIT‐GFP and FITm‐GFP. Empty arrowheads indicate significantly enhanced cytoplasmic GFP signal accumulation of FITm‐GFP compared with FIT‐GFP. Filled arrowheads highlight nuclear signals. Bar, 20 μm.
Nuclear architecture is complex, and the motion of molecules in the nucleus could be coupled to their activity status (Reits & Neefjes, 2001). In FRAP experiments, the mobile fraction of nonmutagenized FIT within the nucleus represented roughly 70% (Fig. 3; see also Gratz et al., 2019, Fig. 4B). This mobile fraction was significantly increased by 10–20% in FITm(SS271/2AA), as reported (Gratz et al., 2019, Fig. 4B) and FITm(S221E/SS271/2AA) (Fig. 3a), whereas it was significantly decreased in FITm(Y238E) by 10%, compared with the control (Fig. 3b; see also the kinetic plots in Fig. S1).
Figure 3.

FER‐LIKE IRON DEFICIENCY‐INDUCED TRANSCRIPTION FACTOR (FIT) phospho‐mutants display altered nuclear mobility. Quantification of the mobile nuclear fraction M f of FIT‐green fluorescent protein (GFP) in comparison with (a), serine (Ser) FITm and (b), tyrosine (Tyr) FITm phospho‐mutants. Nuclear mobility was quantified following leaf infiltration in tobacco by fluorescence recovery after photobleaching. Data are represented in box plots; interquartile range (IQR) 25–75%; whiskers: 25th percentile, −1.5 × IQR; 75th percentile, +1.5 × IQR; median, horizontal line within IQR box; mean, small square in IQR box; x, values outside ± 1.5 × IQR range. Statistical significance between FIT‐GFP and FITm‐GFP forms was calculated with Student's t‐test and is denoted by asterisks (n = 10–17; *, P < 0.05; **, P < 0.01). The data for FIT‐GFP (wild‐type, WT) and FITm(SS271/2AA) were reported in Gratz et al. (2019). Kinetic plots are shown in Supporting Information Fig. S1.
Figure 4.
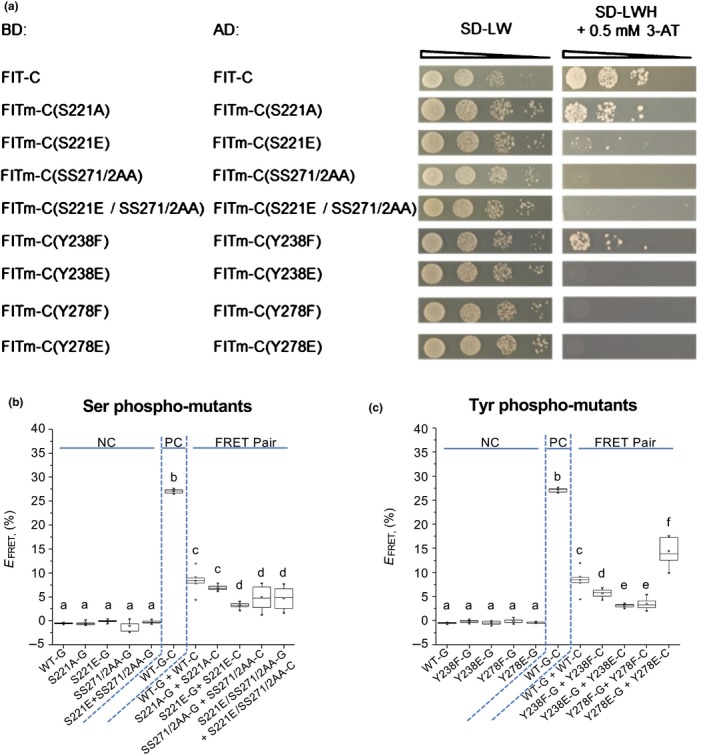
FER‐LIKE IRON DEFICIENCY‐INDUCED TRANSCRIPTION FACTOR (FIT) homodimerization capacity is affected in phospho‐mutants. (a) FIT‐C and FITm‐C homodimerization by targeted yeast two‐hybrid assays. Yeast cells were co‐transformed with GAL4‐binding domain BD‐FIT‐C or BD‐FITm‐C and GAL4‐activation domain AD‐FIT‐C or AD‐FITm‐C plasmids. A 10‐fold dilution series was spotted onto synthetic defined −leucine, −tryptophan (SD‐LW) plates as growth control (OD 600 = 1–10−3). To analyze the interaction capacity, yeast was spotted onto SD‐LW, −histidine (SD‐LWH) plates, containing 0.5 mM 3‐amino‐1,2,4‐triazole (3‐AT), representing selective growth conditions indicative of interaction. Controls of the assays are shown in Supporting Information Fig. S2. (b, c) Quantification of homo‐dimerization of FIT compared to (b) Serine (Ser) FITm phospho‐mutants and (c) tyrosine (Tyr) FITm phospho‐mutants following Förster resonance energy transfer (FRET)–acceptor photobleaching assays in plant cells. Green fluorescent protein (GFP) (G)‐ and mCherry (C)‐tagged FIT and FITm pairs were measured in plant cell nuclei (FRET pairs) following tobacco leaf infiltration and induction of gene expression. GFP‐fusion proteins serve as donor‐only negative controls (NC). Fusion proteins with dual GFP‐mCherry (G–C) serve as positive controls (PC). FRET efficiency EFRET is the relative increase of GFP intensity following photobleaching of the mCherry acceptor. Elevated EFRET for the FRET pair compared with NC is indicative of protein interaction. Data are presented in box plots; inter‐quartile range (IQR) 25–75%; whiskers, 25th percentile −1.5 × IQR, 75th percentile +1.5 × IQR; median, horizontal line within IQR box; mean, small square in IQR box; x, values outside ± 1.5 × IQR range. Statistically different values are highlighted by different letters. Statistical significance was calculated using one‐way ANOVA (P < 0.05) and Tukey post‐hoc test (n = 10). At least two independent experiments were performed. One representative experiment is shown.
In summary, subcellular localization and nuclear mobility of FIT are affected in FIT phospho‐mutants.
FIT phospho‐mutants display altered dimerization capacity
FIT forms nuclear homodimers and heterodimers with bHLH039, depending on Ser272 phosphorylation (Gratz et al., 2019). Functional relevance of FIT homodimerization is unclear. Yet, heterodimerization with subgroup Ib bHLH proteins is an activating mechanism stimulating FIT downstream responses (Yuan et al., 2008; Wang et al., 2013). Because of its robustness and our previous work, we focus on bHLH039 as representative for a subgroup Ib bHLH protein (Naranjo‐Arcos et al., 2017; Gratz et al., 2019). These protein interactions are detectable for WT FIT‐C in semi‐quantitative targeted yeast two‐hybrid assays (Figs 4a, 5a; controls in Figs S2, S3; note that, in the yeast assays, use of full‐length FIT‐BD is excluded because of autoactivation, as explained by Gratz et al. (2019)). Protein interactions of full‐length WT FIT are shown in plant cell quantitative FRET–APB experiments (FRET efficiency of 8% for FRET pair WT‐G + WT‐C, corresponding to FIT‐GFP/FIT‐mCherry, in Fig. 4b,c, and of c. 15% for FRET pair bHLH039‐G + WT‐C, corresponding to bHLH039‐GFP/FIT‐mCherry, in Fig. 5b,c).
Figure 5.

FER‐LIKE IRON DEFICIENCY‐INDUCED TRANSCRIPTION FACTOR (FIT)‐basic helix–loop–helix 39 (bHLH039) heterodimerization capacity is affected in phospho‐mutants. (a) FIT‐C or FITm‐C and bHLH039 heterodimerization by targeted yeast two‐hybrid assays. The yeast assay was conducted as described for Fig. 4(a) using BD‐FIT‐C or BD‐FITm‐C and AD‐bHLH039 plasmids for co‐transformation. Controls of the assays are shown in Supporting Information Fig. S3. (b, c) Quantification of heterodimerization of FIT, following Förster resonance energy transfer (FRET)–acceptor photobleaching assays in plant cells, compared with (b) serine (Ser) FITm phospho‐mutants and (c) tyrosine (Tyr) FITm phospho‐mutants with bHLH039. FRET efficiency and statistical significance were assessed as described in Fig. 4(b,c), using as FRET pairs green fluorescent protein (GFP)‐tagged bHLH039 (bHLH039‐G) together with mCherry‐tagged FIT or –FITm (FIT‐C or FITm‐C) as negative control (NC) bHLH039‐G and as positive control (PC) bHLH039‐G‐C. FRET efficiency EFRET is the relative increase of GFP intensity following photobleaching of the mCherry acceptor. Elevated EFRET for the FRET pair compared with NC is indicative of protein interaction. Data are represented in box plots; interquartile range (IQR) 25–75%; whiskers: 25th percentile, −1.5 × IQR; 75th percentile, +1.5 × IQR; median, horizontal line within IQR box; mean, small square in IQR box; x, values outside ± 1.5 × IQR range. Statistically different values are highlighted by different letters. Statistical significance was calculated using one‐way ANOVA (P < 0.05) and Tukey post‐hoc test (n = 10). At least two independent experiments were performed. One representative experiment is shown.
Less homodimerization was found for FITm‐C/FITm with S221E, SS271/2AA, and combined S221E/SS271/2AA mutations and there was no significant difference with S221A mutation relative to controls in both assays (Fig. 4a,b). A slight reduction in dimerization capacity was found for FITm‐C/FITm with Y238F and a stronger reduction with Y238E and Y278F mutations (Fig. 4a,c). Only Y278E showed opposing effects in both systems, as homodimerization was inhibited in yeast, but FRET efficiency increased vs the nonmutagenized forms.
In FIT‐bHLH039 heterodimerization experiments, phospho‐mutant interactions were either not affected in either of the two systems or reduced in only one assay: SS271/2AA and Y238E in FRET–APB vs Y278F in yeast. Y278E was the only mutation causing reduced heterodimerization in both assays (Fig. 5a,c).
Taken together, with two independent approaches, FIT homodimerization was found significantly affected in seven out of eight phospho‐mutants. FIT heterodimerization was changed in three out of eight phospho‐mutants. The previous FITm(SS271/2AA) data (Gratz et al., 2019) were confirmed. Thus, the ability of FIT to interact with itself or bHLH039 depends on the phosphorylation status.
Phospho‐mutants affect FIT transactivation ability
Promoter activation is a crucial FIT function. Intriguingly, full‐length FIT and FITm had varying abilities to autoactivate the reporter in the targeted yeast two hybrid assay. Nonmutagenized FIT and several mutants self‐activated the system even in the presence of 90 mM 3‐AT. However, FITm(SS271/2AA), FITm(S221E/SS271/2AA) and FITm(Y278E) showed reduced autoactivation (Fig. S4). Altered FIT autoactivation might have been a consequence of the phosphorylation status.
Synthetic cellular systems are becoming increasingly popular to study gene regulatory modules and the impact of functional variants in the absence of interfering secondary effectors present in plant cells (Samodelov & Zurbriggen, 2017). Low‐level IRT1 promoter induction in a fit mutant background indicates that other plant factors can, to some extent, replace FIT function for promoter control in plants (Jakoby et al., 2004). We thus exploited transactivation of the target IRT1 promoter by FIT and bHLH039 in a quantifiable mammalian assay, based on normalized human SEAP reporter expression, driven by IRT1 pro. Neither expression of FIT nor bHLH039 protein alone initiated IRT1 pro activation beyond background, but their combination led to an approximately seven‐fold activation of IRT1 pro (Fig. 6a). This demonstrates that the mammalian transactivation assay is reliable and quantitative. We observed a statistically significant increase in IRT1 pro activity for FITm(S221E) of 25% compared with WT, whereas a decrease of 25–30% was detectable for FITm(SS271/2AA) and FITm(S221E/SS271/2AA). FITm(S221A) activity was comparable to the control (Fig. 6b). FITm(Y238F) and FITm(Y278F) showed a significant increase in IRT1 pro activity by 20% and c. 70%, respectively. However, FITm(Y238E) and FITm(Y278E) displayed a significant decrease in activity by c. 75% (Fig. 6c). Immunoblot analyses in combination with promoter activity demonstrated that transcription factor proteins were expressed in the system, even in cases where only weak protein bands (FITm(S221E)) were detected (Fig. 6).
Figure 6.

FER‐LIKE IRON DEFICIENCY‐INDUCED TRANSCRIPTION FACTOR (FIT) phospho‐mutants differ in transactivation of the IRON‐REGULATED TRANSPORTER1 (IRT1) target promoter. (a) Proof‐of‐concept demonstration of the quantifiable cellular transactivation assay in Chinese hamster ovary (CHO) cells to quantify the ability of FIT and ) basic helix–loop–helix 39 (bHLH039) to induce the target promoter IRT1 pro resulting in induced activity of the secreted alkaline phosphatase (SEAP) reporter. Upper part, quantified promoter induction relative to the baseline control of IRT1 pro in the absence of bHLH039 and FIT, normalized to co‐transfected Gaussia luciferase activity. Lower part, immunoblot analysis showing protein expression of hemagglutinin (HA)‐tagged HA 3‐bHLH039 (Anti‐HA, 36 kDa, arrowhead) and FIT‐GFP (Anti‐GFP, 62 kDa, arrowhead) in transfected CHO cells; as control for protein transfer, we used Ponceau S staining of the membrane (Loading). Both FIT and bHLH039 are required to activate IRT1 pro, defining the minimal framework needed for promoter activation. Data are presented in box plots; interquartile range (IQR) 25–75%; whiskers: 25th percentile, −1.5 × IQR; 75th percentile +1.5 × IQR; median, horizontal line within IQR box; mean, small square in IQR box; x, values outside ± 1.5 × IQR range. Statistical significance is highlighted by different letters and was calculated using one‐way ANOVA (P < 0.05) and Tukey post‐hoc test (n = 3). One representative experiment is shown. (b, c) Cellular transactivation assay to quantify the ability of (b) serine (Ser) FITm and (c) tyrosine (Tyr) FITm phospho‐mutants compared with FIT. The assay, statistical analysis, immunoblot analysis, and labeling of protein bands were carried out as described for (a).
In summary, the altered transactivation activity of FIT provides evidence that predicted phospho‐sites are crucial for fine‐tuning transcriptional FIT activity. Indeed, for the three mutant forms FITm(SS271/2AA), FITm(Y238E) and FITm(Y278E), which interacted less with bHLH039 in plant cells, transactivation capacities were lower than for WT FIT. Accordingly, phospho‐mutant forms interacting with bHLH039 similar to WT showed mostly at least the same level of transactivation capacity as FIT.
A FIT phospho‐mutant has altered protein stability
Protein phosphorylation can be a signal for initiation or decrease of protein turnover (Ni et al., 2013), and phosphorylation of FIT might also be linked with proteasomal degradation. FIT‐GFP protein, expressed in plant cells, was nearly completely degraded over a 240 min time course, as shown by a quantified cell‐free degradation assay (Fig. 7). Proteasomal inhibitor MG132 antagonized this degradation and confirmed proteasomal involvement in FIT protein turnover (Figs 7, S5a). The Ser221, Ser271/2 and Tyr238 phospho‐mutants, as well as FITm(Y278F) phospho‐mutant, were not degraded in a significantly different time from WT, whereas FITm(Y278E) displayed a decrease in protein stability, confirmed by half‐life rates (Figs 7, S5b,d).
Figure 7.

A FER‐LIKE IRON DEFICIENCY‐INDUCED TRANSCRIPTION FACTOR (FIT) tyrosine (Tyr) phospho‐mutant is degraded faster than other phospho‐mutants. Quantified cell‐free protein degradation assay for (a) serine (Ser) and (b) Tyr phospho‐mutant FITm‐green fluorescent protein (GFP) in comparison with FIT‐GFP. The assay was conducted following transient expression in tobacco leaf epidermis cells. Equal amounts of total protein extract were incubated at 25°C for 0, 60, 120 and 240 min, partly treated with the proteasomal inhibitor MG132 (+MG132). Protein abundance was determined by quantitative immunoblot analysis of FIT‐GFP and FITm‐GFP. Wild‐type (WT) is represented as solid black, FITm‐GFP as solid gray curves, dashed lines are +MG132 samples. Data are means ± SD (+MG132, one replicate). Statistically significant differences between mutant and WT at each individual time‐point are highlighted by asterisks (Student's t‐test, **, P < 0.01, n = 3). Immunoblots and calculated half‐life times of FIT‐GFP and FITm‐GFP are presented in Supporting Information Fig. S5.
These results suggest that Tyr278 phosphorylation could be a trigger for faster degradation of the protein.
Phospho‐mimicking Tyr mutants do not complement the fit‐3 mutant
The aforementioned functional phospho‐mutant screen has revealed that FITm(Y238E) and FITm(Y278E) displayed a majority of phenotypes among phospho‐mutant FIT forms. To generate a proof of concept for identification of meaningful new phospho‐sites using the phospho‐mutant screen, we used these two phospho‐mimicking Tyr mutants to demonstrate phenotypes in planta, using a fit‐3 mutant complementation assay (Fig. 8). FITm mRNA and FITm protein were expressed at a comparable level to nonmutagenized FIT‐GFP in the lines analyzed (Fig. 8a,b; note that FIT and FITm‐GFP are driven by a constitutive promoter). In the line FITm(Y238E)‐GFP/fit‐3, the FIT target genes FRO2 and IRT1 were not induced to the same high level at −Fe as in FIT‐GFP/fit‐3. In the line FITm(Y278E)‐GFP/fit‐3, FRO2 was similarly expressed as in FIT‐GFP/fit‐3, but IRT1 levels were lower. Also, FITm(Y278E)‐GFP/fit‐3 expressed IRT1 to a higher level than FITm(Y238E)‐GFP/fit‐3 did at −Fe. In both Tyr‐mutated FIT lines, FRO2 and IRT1 were expressed at higher level than in fit‐3 plants (Fig. 8c,d). We therefore conclude that the Tyr phospho‐mimicking mutations cause decreased FIT activity, which confirms results of the cellular assays. However, Tyr phospho‐mimicked FIT still retains sufficient functionality for target gene activation. Elevated BHLH039 expression indicates Fe deficiency. At +Fe, BHLH039 expression was similarly low between Tyr mutant‐ and WT FIT‐complementing plants (Fig. 8e), whereas it was high in fit‐3. Therefore, Tyr phospho‐mimicked FIT is less active than WT FIT, but its function is not knocked out.
Figure 8.

Phospho‐mimicking FITm(Y238E) and FITm(Y278E) have reduced activity in Arabidopsis thaliana. fit mutant complementation assay with FITm(Y238E)‐GFP/fit‐3 and FITm(Y278E)‐GFP/fit‐3 lines in comparison to FIT‐GFP/fit‐3 (FIT, FER‐LIKE IRON DEFICIENCY‐INDUCED TRANSCRIPTION FACTOR; GFP, green fluorescent protein). Plants were grown with sufficient iron (+Fe, black bars) or deficient iron (−Fe, gray bars) supply in 2‐wk growth assays. (a) FIT gene expression analysis in roots. (b) Immunoblot analysis of FIT‐GFP and FITm‐GFP protein expression (upper, FIT‐GFP and FITm‐GFP 63 kDa), Ponceau S membrane loading control (lower). FITm‐GFP/fit‐3 lines have similar expression levels to the FIT‐GFP/fit‐3 line. (c–e) Gene expression analysis in roots of (c) FRO2, (d) IRON‐REGULATED TRANSPORTER1 (IRT1), and (e) basic helix–loop–helix 39 (BHLH039). Data are represented as mean ± SD. Statistical significance is highlighted by different letters and was calculated using one‐way ANOVA (P < 0.05) and Tukey post‐hoc test (n = 3).
Discussion
Phospho‐dead and phospho‐mimicking mutants of four Ser and Tyr sites caused different molecular and cellular phenotypes in phospho‐mutant activity assays of FIT. Whereas Ser phosphorylation, with predominance at the previously identified Ser272 site, would activate FIT, Tyr phosphorylation would deactivate it, and this also in plants. We suggest that alternative pathways exert multifaceted phosphorylation control of FIT.
All four predicted phosphorylation target residues were relevant for cellular FIT activities. Three of them were validated through transgenic plant experiments (this work) and our previous work (Gratz et al., 2019), showing suitability of the three‐step netPhos prediction, phylogenetic sequence analysis, and phosphorylation motif searches in combination with a subsequent mutant activity screening.
Clear sequence similarity of monocot and basal angiosperm FIT C‐termini was not evident. FIT regulation via FIT‐C may, therefore, have been acquired in eudicots. Phosphorylated amino acids, especially Tyr, are often conserved across plant species (Maathuis, 2008; Sugiyama et al., 2008; Nakagami et al., 2010; Mithoe et al., 2012). Because of the high conservation, Tyr regulation of FIT might be evolutionarily older than Ser regulation and potentially older than the role of FIT in regulating Strategy I. Perhaps the high pressure to survive on dry land was a selective factor for eudicots during the Cretaceous period to evolve more efficient Fe acquisition regulation with better integration into plant growth. This way, new protein interactions and protein modifications could have occurred. FIT might have acquired this function via FIT‐C, keeping some of its regulatory properties.
Phospho‐mutant analyses are widely accepted to identify and characterize functional phosphorylation patterns (Yang et al., 2015; Li H. et al., 2017; Li S. et al., 2017), and the cellular FIT mutant activities (summarized in Fig. 9) can be explained by differential phosphorylation. Local charge differences lead to conformational changes that allow or impede regulatory protein interactions. Shuttling of FIT from the cytoplasm to the nucleus is mediated by the presence of a nuclear localization signal (Zhang et al., 2006). Phosphorylation could alter this signal, and hence nuclear translocation, via a conformational change or interaction with a regulatory protein, as shown for 14‐3‐3 protein binding to phospho‐sites (Moorhead et al., 2006). Changes in FIT phospho‐mutant mobility might be due to the binding of FIT to subnuclear structures and nuclear protein complexes. FIT protein interactions are needed for target promoter transactivation, and protein stability control regulates the responsiveness of the signaling system. In 13 out of 16 cases, yeast and plant systems gave fully concordant results for FIT phospho‐mutant protein interactions, underlining the general reliability of protein interaction assays. Differences can be explained by differing regulatory mechanisms in the two systems, and likely by lack of regulatory contributions of the N‐terminal and bHLH subdomains of FIT. Yeast interaction assays were conducted with FIT‐C, in contrast to plant assays performed with full‐length FIT.
Figure 9.

Summary of FER‐LIKE IRON DEFICIENCY‐INDUCED TRANSCRIPTION FACTOR (FIT) phospho‐mutant phenotype screening using cellular assays. A color code was applied, highlighting altered regulatory properties and cellular activities between FIT (wild‐type, WT) and FITm forms. Red shading indicates a stronger effect, and blue shading a reduced effect in the respective FITm form compared with FIT for the experiment conducted, referred to by figure numbers. Increase of the individual color indicates a stronger effect. The absence of differences between FIT and FITm is marked in gray. A mathematical correlation analysis conducted with the data matrix showed significant correlation between heterodimerization of FIT and basic helix–loop–helix 39, transactivation capability, and protein stability.
Interestingly, heterodimerization of FIT and bHLH039 was correlated with transactivation capability and protein stability (see Fig. 9). On the other hand, FIT transactivation ability did not correlate with nucleo‐cytoplasmic partitioning and homodimerization, in line with the failure of FIT alone to activate IRT1 pro. A higher cytoplasmic‐to‐nuclear ratio of FIT (lower nuclear vs cytoplasmic localization, as indicated in Fig. 9) seems linked with homodimerization, but the values were not significant in correlation (Fig. 9). Perhaps FIT homodimerization affects nuclear localization. Taken together, phospho‐mutant activity screening of FIT opens up a way to connect Fe acquisition regulation to new cellular signaling pathways, including cytoplasmic‐to‐nuclear partitioning and Tyr phosphorylation.
Positive effects of phospho‐mimicking Ser (Gratz et al., 2019; this work) and phospho‐dead Tyr (this work), in contrast to negative effects of the phospho‐dead Ser272 (Gratz et al., 2019) and phospho‐mimicking Tyr (this work) mutations, are indicators for multiple phosphorylation triggers for FIT. We therefore suggest that FIT is controlled via different phosphorylation pathways, leading to activation by Ser and deactivation by Tyr phosphorylation (Fig. 10).
Figure 10.

Model of two‐step regulation of FER‐LIKE IRON DEFICIENCY‐INDUCED TRANSCRIPTION FACTOR (FIT) activity by protein phosphorylation. Active FIT (upper): serine (Ser) phosphorylation promotes FIT activity. Phosphorylation (P) at Ser221 and Ser272 in FIT‐C favors basic helix–loop–helix 39 (bHLH039) interaction and expression of IRON‐REGULATED TRANSPORTER1 promoter (IRT1 pro). Inactive FIT (lower): tyrosine (Tyr) phosphorylation (P) reduces FIT activity in a situation where no active FIT protein is needed or even could be detrimental. Phosphorylation at Tyr238 and Tyr278 in FIT‐C reduces bHLH039 heterodimerization and expression of IRT1 pro and partly promotes FIT degradation.
Ser272 phosphorylation by CIPK11 activates FIT to accumulate in the nucleus, dimerize with bHLH039, and activate target promoters (Gratz et al., 2019). CIPK11 also phosphorylates FIT‐Cm(SS271/2AA) protein to a minor extent (Gratz et al., 2019), possibly at Ser221. Mutant comparisons between FITm(S221E SS271/2AA) and the respective single mutants indicated that the multiple mutant behaved more similar to FITm(SS271/2AA), suggesting that Ser221 appears less important than Ser272. In this sense, phosphorylation of position Ser272 plays a pivotal role. Loss of phosphorylation in phospho‐dead FITm(SS271/2AA) has more dramatic effects than loss of FITm(S221A), and FITm(SS271/2AA) is not rescued by nearby phospho‐mimicking FITm(S221E) regarding nuclear mobility, transcriptional self‐activation in yeast, and transactivation. Besides CIPK11, other Fe‐regulated CIPK genes and another CIPK interactor of FIT are known, but their roles in Fe‐deficiency responses or FIT regulation remain to be determined (Gratz et al., 2019). CIPK23, on the other hand, affects FIT downstream targets FRO2 and IRT1 proteins (Tian et al., 2016; Dubeaux et al., 2018). Furthermore, other Ser/Thr kinase families are connected to Fe deficiency and could target FIT, such as MAPK3 and MAPK6, upregulated under Fe deficiency (Ye et al., 2015). mapk3 and mapk6 loss‐of function mutants have decreased gene expression levels of FRO2 and IRT1 (Ye et al., 2015). Both kinases are involved in the expression of ACC SYNTHASE (ACS) genes (Li et al., 2012; Li S. et al., 2017) and they could positively influence Fe acquisition through phosphorylation‐based stabilization of ACS proteins, needed for ethylene production (Liu & Zhang, 2004). Ethylene‐induced transcription factor EIN3 is phosphorylated and stabilized by MAPK3 and MAPK6 (Yoo et al., 2008). MAPK3 and MAPK6 could thus play a dual role in possibly activating FIT by Ser phosphorylation and via stabilization of EIN3, known to interact and activate FIT (Lingam et al., 2011). Recently, the involvement of serine/threonine kinases CALCIUM‐DEPENDENT PROTEIN KINASEs (CPKs) CPK5 and CPK6 in ACS expression has been shown (Li S. et al., 2017), and these could also represent kinase candidates for FIT Ser phosphorylation.
The presence of two regulatory Tyr sites is very intriguing. Tyr phosphorylation has been rarely described to date in plant transcription factors, whereas based on phospho‐proteomics it could be quite important (Sugiyama et al., 2008; van Wijk et al., 2014; Lu et al., 2015). Tyr can also be involved in other protein modifications; for example, nitration, and generally in hydrogen bond formation. However, the fact that Tyr phospho‐mimicking and phospho‐dead mutations yielded contrasting phenotypes in several assays speaks in favor for different activities in the phosphorylated vs nonphosphorylated state. Tyr phospho‐mimicking mutants have a decreased bHLH039 interaction and transactivation ability, and the phospho‐mimicking mutant of Tyr278 also has a lower protein stability in plant cells. Interestingly, the phospho‐mimicking Tyr mutants of FIT display very similar features to phospho‐mimicked CjWRKY1(Y115E), which is impaired in induction of target genes and shows increased cytosolic localization, where it is degraded subsequently (Yamada & Sato, 2016). Thus, Tyr phosphorylation is likely a multi‐inhibitory mechanism, rendering FIT inactive by inhibition of protein interaction with bHLH039, inhibition of transactivation, and enhanced protein degradation.
Presently, we cannot distinguish where in the cell FIT phosphorylation events occur. For example, Tyr phosphorylation could be relevant at the promoter target site in the nucleus to eliminate ‘used FIT’ and make the system responsive to ‘fresh’ FIT again, as proposed (Sivitz et al., 2011). On the other hand, only a small fraction of FIT protein is needed for being ‘used’ at the target promoters, yet the inhibitory Tyr phosphorylation affects all FIT protein (‘used’ and ‘fresh’). An alternative possibility, therefore, is that Tyr phosphorylation takes place in the cytoplasm, where Tyr kinases or dual‐specificity kinases could be present. A very interesting follow‐up question is to identify a kinase for Tyr phosphorylation of FIT. Potential Tyr kinases might belong to Raf‐like subfamilies of MAPKKKs in plants (Jouannic et al., 1999; Ichimura et al., 2002). The phosphorylation motif spanning FIT Tyr238 is a kinase substrate motif of human JANUS KINASE 2 (Argetsinger et al., 2004). The closest plant homologue is the MAPKKK Raf10, which is expressed in roots, responsive to abiotic stresses, and classified as plant Tyr kinase (Jouannic et al., 1999; Ichimura et al., 2002; Rudrabhatla et al., 2006; Lee et al., 2015). Alternatively, brassinosteroids (BRs) are negative regulators of Fe uptake (Wang et al., 2012), and BR signaling might be involved in FIT Tyr phosphorylation via dual‐specificity kinases of BR signaling, even though transcription factor substrates remain to be proven (Oh et al., 2009; Kim & Wang, 2010; Jaillais et al., 2011).
Conclusions
The three‐step prediction of phosphorylation target sites in FIT‐C was validated by phospho‐mutant activity assays. The contrasting effects of Ser and Tyr phospho‐mutations suggest alternative regulation of FIT activity by different phosphorylation pathways. This multiple regulation of FIT activity underlines the importance of FIT as a central hub for regulating Fe acquisition in dicots. It may serve to integrate changes in environmental conditions and to quickly adjust Fe acquisition at the transcriptional level. FIT can serve as a model to characterize the rare Tyr phosphorylation event in plants and to identify a Tyr kinase.
Author contributions
RG, TB, RI, MDZ and PB designed the study, RG, TB, RI, KT, LT, RO‐F, TB and JM performed research, RG, TB, RI, KT, LT, RO‐F, TB, MDZ and PB analyzed data, RG wrote the original draft, RG, TB and PB reviewed and edited the article, TB, SW‐P, MDZ and PB supervised the study, and PB and MDZ acquired funding.
Supporting information
Please note: Wiley Blackwell are not responsible for the content or functionality of any Supporting Information supplied by the authors. Any queries (other than missing material) should be directed to the New Phytologist Central Office.
Fig. S1 Representative recordings for nuclear mobility assays of phospho‐mutant FITm‐GFP forms.
Fig. S2 Controls for FIT‐ and FITm homo‐dimerization targeted yeast two‐hybrid assays.
Fig. S3 Controls for FIT‐ and FITm‐bHLH039 hetero‐dimerization targeted yeast two‐hybrid assays.
Fig. S4 Transcriptional self‐activation capacity differs in FIT phospho‐mutants.
Fig. S5 Immuno‐blot analysis and half‐life times for FIT‐GFP and FITm‐GFP forms in the quantified cell‐free protein degradation assay.
Table S1 List of recombinant plasmids and cloning procedures.
Table S2 List of primers for recombinant vector generation in alphabetical order.
Acknowledgements
We are grateful to Elke Wieneke, Gintaute Matthäi, and Kai Kirchhoff for excellent technical assistance. We are thankful for contributions of Daniela Lichtblau, Christopher Endres, and Büsra Acaroglu. RG and RO‐F are members of iGRAD Plant Graduate School, Düsseldorf. Funding from the German Research Foundation grants Ba1610/5‐2 and Ba1610/7‐1 to PB is greatly acknowledged. TB was supported for this research through the International Max Planck Research School (IMPRS) on Understanding Complex Plant Traits using Computational and Evolutionary Approaches at the Max Planck Institute for Plant Breeding Research and the universities of Düsseldorf and Cologne. This work received funding from Germany's Excellence Strategy, EXC 2048/1, Project ID: 390686111, and from Deutsche Forschungsgemeinschaft – Project no. 267205415 – SFB 1208 (CRC 1208) Project B05 to PB.
References
- Amanchy R, Kandasamy K, Mathivanan S, Periaswamy B, Reddy R, Yoon WH, Joore J, Beer MA, Cope L, Pandey A. 2011. Identification of novel phosphorylation motifs through an integrative computational and experimental analysis of the human phosphoproteome. Journal of Proteomics and Bioinformatics 4: 22–35. [DOI] [PMC free article] [PubMed] [Google Scholar]
- Argetsinger LS, Kouadio JLK, Steen H, Stensballe A, Jensen ON, Carter‐Su C. 2004. Autophosphorylation of JAK2 on tyrosines 221 and 570 regulates its activity. Molecular and Cellular Biology 24: 4955–4967. [DOI] [PMC free article] [PubMed] [Google Scholar]
- Bancaud A, Huet S, Rabut G, Ellenberg J. 2010. Fluorescence perturbation techniques to study mobility and molecular dynamics of proteins in live cells: FRAP, photoactivation, photoconversion, and FLIP. Cold Spring Harbor Protocols 2010: pdb.top90. [DOI] [PubMed] [Google Scholar]
- Beausoleil SA, Jedrychowski M, Schwartz D, Elias JE, Villen J, Li J, Cohn MA, Cantley LC, Gygi SP. 2004. Large‐scale characterization of HeLa cell nuclear phosphoproteins. Proceedings of the National Academy of Sciences, USA 101: 12130–12135. [DOI] [PMC free article] [PubMed] [Google Scholar]
- Ben Abdallah H, Bauer P. 2016. Quantitative reverse transcription‐qPCR‐based gene expression analysis in plants. Methods in Molecular Biology 1363: 9–24. [DOI] [PubMed] [Google Scholar]
- Beyer HM, Gonschorek P, Samodelov SL, Meier M, Weber W, Zurbriggen MD. 2015. AQUA cloning: a versatile and simple enzyme‐free cloning approach. PLoS ONE 10: e0137652. [DOI] [PMC free article] [PubMed] [Google Scholar]
- Blom N, Gammeltoft S, Brunak S. 1999. Sequence and structure‐based prediction of eukaryotic protein phosphorylation sites. Journal of Molecular Biology 294: 1351–1362. [DOI] [PubMed] [Google Scholar]
- Chinnusamy V, Ohta M, Kanrar S, Lee BH, Hong X, Agarwal M, Zhu JK. 2003. ICE1: a regulator of cold‐induced transcriptome and freezing tolerance in Arabidopsis . Genes Development 17: 1043–1054. [DOI] [PMC free article] [PubMed] [Google Scholar]
- Clough SJ, Bent AF. 1998. Floral dip: a simplified method for Agrobacterium‐mediated transformation of Arabidopsis thaliana . The Plant Journal 16: 735–743. [DOI] [PubMed] [Google Scholar]
- Colangelo EP, Guerinot ML. 2004. The essential basic helix–loop–helix protein FIT1 is required for the iron deficiency response. Plant Cell 16: 3400–3412. [DOI] [PMC free article] [PubMed] [Google Scholar]
- Cole TCH, Hilger HH, Stevens PF. 2019. Angiosperm phylogeny poster (APP) – flowering plant systematics, 2019. PeerJ Preprints 7: e2320v6. [Google Scholar]
- Connorton JM, Balk J, Rodriguez‐Celma J. 2017. Iron homeostasis in plants – a brief overview. Metallomics 9: 813–823. [DOI] [PMC free article] [PubMed] [Google Scholar]
- Cui Y, Chen CL, Cui M, Zhou WJ, Wu HL, Ling HQ. 2018. Four IVa bHLH transcription factors are novel interactors of FIT and mediate JA inhibition of iron uptake in Arabidopsis . Molecular Plant 11: 1166–1183. [DOI] [PubMed] [Google Scholar]
- Ding Y, Li H, Zhang X, Xie Q, Gong Z, Yang S. 2015. OST1 kinase modulates freezing tolerance by enhancing ICE1 stability in Arabidopsis . Developmental Cell 32: 278–289. [DOI] [PubMed] [Google Scholar]
- Dubeaux G, Neveu J, Zelazny E, Vert G. 2018. Metal sensing by the IRT1 transporter‐receptor orchestrates its own degradation and plant metal nutrition. Molecular Cell 69: 953–964. [DOI] [PubMed] [Google Scholar]
- Edgar RC. 2004. muscle: a multiple sequence alignment method with reduced time and space complexity. BMC Bioinformatics 5: e113. [DOI] [PMC free article] [PubMed] [Google Scholar]
- Eide D, Broderius M, Fett J, Guerinot ML. 1996. A novel iron‐regulated metal transporter from plants identified by functional expression in yeast. Proceedings of the National Academy of Sciences, USA 93: 5624–5628. [DOI] [PMC free article] [PubMed] [Google Scholar]
- Fiol CJ, Wang AQ, Roeske RW, Roach PJ. 1990. Ordered multisite protein‐phosphorylation – analysis of glycogen‐synthase kinase‐3 action using model peptide‐substrates. Journal of Biological Chemistry 265: 6061–6065. [PubMed] [Google Scholar]
- Gratz R, Manishankar P, Ivanov R, Koster P, Mohr I, Trofimov K, Steinhorst L, Meiser J, Mai HJ, Drerup M et al 2019. CIPK11‐dependent phosphorylation modulates FIT activity to promote Arabidopsis iron acquisition in response to calcium signaling. Developmental Cell 48: 726–740. [DOI] [PubMed] [Google Scholar]
- Gudesblat GE, Schneider‐Pizon J, Betti C, Mayerhofer J, Vanhoutte I, van Dongen W, Boeren S, Zhiponova M, de Vries S, Jonak C et al 2012. SPEECHLESS integrates brassinosteroid and stomata signalling pathways. Nature Cell Biology 14: 548–558. [DOI] [PubMed] [Google Scholar]
- Heim MA, Jakoby M, Werber M, Martin C, Weisshaar B, Bailey PC. 2003. The basic helix–loop–helix transcription factor family in plants: a genome‐wide study of protein structure and functional diversity. Molecular Biology and Evolution 20: 735–747. [DOI] [PubMed] [Google Scholar]
- Ichimura K, Shinozaki K, Tena G, Sheen J, Henry Y, Champion A, Kreis M, Zhang S, Hirt H, Wilson C. 2002. Mitogen‐activated protein kinase cascades in plants: a new nomenclature. Trends in Plant Science 7: 301–308. [DOI] [PubMed] [Google Scholar]
- Ivanov R, Brumbarova T, Bauer P. 2012. Fitting into the harsh reality: regulation of iron deficiency responses in dicotyledonous plants. Molecular Plant 5: 27–42. [DOI] [PubMed] [Google Scholar]
- Jacobs JL, Dinman JD. 2004. Systematic analysis of bicistronic reporter assay data. Nucleic Acids Research 32: e160. [DOI] [PMC free article] [PubMed] [Google Scholar]
- Jaillais Y, Hothorn M, Belkhadir Y, Dabi T, Nimchuk ZL, Meyerowitz EM, Chory J. 2011. Tyrosine phosphorylation controls brassinosteroid receptor activation by triggering membrane release of its kinase inhibitor. Genes & Development 25: 232–237. [DOI] [PMC free article] [PubMed] [Google Scholar]
- Jakoby M, Wang HY, Reidt W, Weisshaar B, Bauer P. 2004. FRU (BHLH029) is required for induction of iron mobilization genes in Arabidopsis thaliana . FEBS Letters 577: 528–534. [DOI] [PubMed] [Google Scholar]
- Jouannic S, Hamal A, Leprince A‐S, Tregear J, Kreis M, Henry Y. 1999. Plant MAP kinase kinase kinases structure, classification and evolution. Gene 233: 1–11. [DOI] [PubMed] [Google Scholar]
- Ju CL, Yoon GM, Shemansky JM, Lin DY, Ying ZI, Chang JH, Garrett WM, Kessenbrock M, Groth G, Tucker ML et al 2012. CTR1 phosphorylates the central regulator EIN2 to control ethylene hormone signaling from the ER membrane to the nucleus in Arabidopsis . Proceedings of the National Academy of Sciences, USA 109: 19486–19491. [DOI] [PMC free article] [PubMed] [Google Scholar]
- Kemp BE, Pearson RB. 1990. Protein‐kinase recognition sequence motifs. Trends in Biochemical Sciences 15: 342–346. [DOI] [PubMed] [Google Scholar]
- Kim T‐W, Wang Z‐Y. 2010. Brassinosteroid signal transduction from receptor kinases to transcription factors. Annual Review of Plant Biology 61: 681–704. [DOI] [PubMed] [Google Scholar]
- Lampard GR, Macalister CA, Bergmann DC. 2008. Arabidopsis stomatal initiation is controlled by MAPK‐mediated regulation of the bHLH SPEECHLESS. Science 322: 1113–1116. [DOI] [PubMed] [Google Scholar]
- Le CTT, Brumbarova T, Ivanov R, Stoof C, Weber E, Mohrbacher J, Fink‐Straube C, Bauer P. 2016. ZINC FINGER OF ARABIDOPSIS THALIANA12 (ZAT12) interacts with FER‐LIKE IRON DEFICIENCY‐INDUCED TRANSCRIPTION FACTOR (FIT) linking iron deficiency and oxidative stress responses. Plant Physiology 170: 540–557. [DOI] [PMC free article] [PubMed] [Google Scholar]
- Lee S‐J, Lee MH, Kim J‐I, Kim SY. 2015. Arabidopsis putative MAP kinase kinase kinases Raf10 and Raf11 are positive regulators of seed dormancy and ABA response. Plant and Cell Physiology 56: 84–97. [DOI] [PubMed] [Google Scholar]
- Li GJ, Meng XZ, Wang RG, Mao GH, Han L, Liu YD, Zhang SQ. 2012. Dual‐level regulation of ACC synthase activity by MPK3/MPK6 cascade and its downstream WRKY transcription factor during ethylene induction in Arabidopsis . PLoS Genetics 8: e1002767. [DOI] [PMC free article] [PubMed] [Google Scholar]
- Li H, Ding Y, Shi Y, Zhang X, Zhang S, Gong Z, Yang S. 2017. MPK3‐ and MPK6‐mediated ICE1 phosphorylation negatively regulates ICE1 stability and freezing tolerance in Arabidopsis . Developmental Cell 43: 630–642. [DOI] [PubMed] [Google Scholar]
- Li S, Han X, Yang L, Deng X, Wu H, Zhang M, Liu Y, Zhang S, Xu J. 2017. Mitogen‐activated protein kinases and calcium‐dependent protein kinases are involved in wounding‐induced ethylene biosynthesis in Arabidopsis thaliana . Plant, Cell & Environment 41: 134–147. [DOI] [PubMed] [Google Scholar]
- Lingam S, Mohrbacher J, Brumbarova T, Potuschak T, Fink‐Straube C, Blondet E, Genschik P, Bauer P. 2011. Interaction between the bHLH transcription factor FIT and ETHYLENE INSENSITIVE3/ETHYLENE INSENSITIVE3‐LIKE1 reveals molecular linkage between the regulation of iron acquisition and ethylene signaling in Arabidopsis . Plant Cell 23: 1815–1829. [DOI] [PMC free article] [PubMed] [Google Scholar]
- Liu YD, Zhang SQ. 2004. Phosphorylation of 1‐aminocyclopropane‐1‐carboxylic acid synthase by MPK6, a stress‐responsive mitogen‐activated protein kinase, induces ethylene biosynthesis in Arabidopsis . Plant Cell 16: 3386–3399. [DOI] [PMC free article] [PubMed] [Google Scholar]
- Lu Q, Helm S, Rödiger A, Baginsky S. 2015. On the extent of tyrosine phosphorylation in chloroplasts. Plant Physiology 169: 996–1000. [DOI] [PMC free article] [PubMed] [Google Scholar]
- Luo ML, Reyna S, Wang LS, Yi ZP, Carroll C, Dong LQ, Langlais P, Weintraub ST, Mandarino LJ. 2005. Identification of insulin receptor substrate 1 serine/threonine phosphorylation sites using mass spectrometry analysis: regulatory role of serine 1223. Endocrinology 146: 4410–4416. [DOI] [PubMed] [Google Scholar]
- Maathuis FJ. 2008. Conservation of protein phosphorylation sites within gene families and across species. Plant Signaling & Behavior 3: 1011–1013. [DOI] [PMC free article] [PubMed] [Google Scholar]
- Mai HJ, Pateyron S, Bauer P. 2016. Iron homeostasis in Arabidopsis thaliana: transcriptomic analyses reveal novel FIT‐regulated genes, iron deficiency marker genes and functional gene networks. BMC Plant Biology 16: e211. [DOI] [PMC free article] [PubMed] [Google Scholar]
- Marschner H, Romheld V, Kissel M. 1986. Different strategies in higher‐plants in mobilization and uptake of iron. Journal of Plant Nutrition 9: 695–713. [Google Scholar]
- Meiser J, Lingam S, Bauer P. 2011. Posttranslational regulation of the iron deficiency basic helix–loop–helix transcription factor FIT is affected by iron and nitric oxide. Plant Physiology 157: 2154–2166. [DOI] [PMC free article] [PubMed] [Google Scholar]
- Mithoe SC, Boersema PJ, Berke L, Snel B, Heck AJR, Menke FLH. 2012. Targeted quantitative phosphoproteomics approach for the detection of phospho‐tyrosine signaling in plants. Journal of Proteome Research 11: 438–448. [DOI] [PubMed] [Google Scholar]
- Moorhead GW, Templeton GT, Tran H. 2006. Role of protein kinases, phosphatases and 14‐3‐3 proteins in the control of primary plant metabolism In: Plaxton WC, McManus MT, eds. Annual plant reviews volume 22: control of primary metabolism in plants. Oxford, UK: Blackwell Publishing, 121–149. [Google Scholar]
- Muller K, Zurbriggen MD, Weber W. 2014. Control of gene expression using a red‐ and far‐red light‐responsive bi‐stable toggle switch. Nature Protocols 9: 622–632. [DOI] [PubMed] [Google Scholar]
- Nakagami H, Sugiyama N, Mochida K, Daudi A, Yoshida Y, Toyoda T, Tomita M, Ishihama Y, Shirasu K. 2010. Large‐scale comparative phosphoproteomics identifies conserved phosphorylation sites in plants. Plant Physiology 153: 1161–1174. [DOI] [PMC free article] [PubMed] [Google Scholar]
- Naranjo‐Arcos MA, Maurer F, Meiser J, Pateyron S, Fink‐Straube C, Bauer P. 2017. Dissection of iron signaling and iron accumulation by overexpression of subgroup Ib bHLH039 protein. Scientific Reports 7: e10911. [DOI] [PMC free article] [PubMed] [Google Scholar]
- Ni WM, Xu SL, Chalkley RJ, Pham TND, Guan SH, Maltby DA, Burlingame AL, Wang ZY, Quail PH. 2013. Multisite light‐induced phosphorylation of the transcription factor PIF3 is necessary for both its rapid degradation and concomitant negative feedback modulation of photoreceptor phyB levels in Arabidopsis . Plant Cell 25: 2679–2698. [DOI] [PMC free article] [PubMed] [Google Scholar]
- Oh M‐H, Wang X, Kota U, Goshe MB, Clouse SD, Huber SC. 2009. Tyrosine phosphorylation of the BRI1 receptor kinase emerges as a component of brassinosteroid signaling in Arabidopsis . Proceedings of the National Academy of Sciences, USA 106: 658–663. [DOI] [PMC free article] [PubMed] [Google Scholar]
- Pearson RB, Kemp BE. 1991. Protein‐kinase phosphorylation site sequences and consensus specificity motifs – tabulations. Methods in Enzymology 200: 62–81. [DOI] [PubMed] [Google Scholar]
- Reits EA, Neefjes JJ. 2001. From fixed to FRAP: measuring protein mobility and activity in living cells. Nature Cell Biology 3: E145. [DOI] [PubMed] [Google Scholar]
- Remy I, Michnick SW. 2006. A highly sensitive protein–protein interaction assay based on Gaussia luciferase. Nature Methods 3: 977–979. [DOI] [PubMed] [Google Scholar]
- Ren YJ, Li YY, Jiang YQ, Wu BH, Miao Y. 2017. Phosphorylation of WHIRLY1 by CIPK14 shifts its localization and dual functions in Arabidopsis . Molecular Plant 10: 749–763. [DOI] [PubMed] [Google Scholar]
- Robinson NJ, Procter CM, Connolly EL, Guerinot ML. 1999. A ferric‐chelate reductase for iron uptake from soils. Nature 397: 694–697. [DOI] [PubMed] [Google Scholar]
- Rudrabhatla P, Reddy MM, Rajasekharan R. 2006. Genome‐wide analysis and experimentation of plant serine/threonine/tyrosine‐specific protein kinases. Plant Molecular Biology 60: 293–319. [DOI] [PubMed] [Google Scholar]
- Samodelov SL, Zurbriggen MD. 2017. Quantitatively understanding plant signaling: novel theoretical–experimental approaches. Trends in Plant Sciences 22: 685–704. [DOI] [PubMed] [Google Scholar]
- Schlatter S, Rimann M, Kelm J, Fussenegger M. 2002. SAMY, a novel mammalian reporter gene derived from Bacillus stearothermophilus α‐amylase. Gene 282: 19–31. [DOI] [PubMed] [Google Scholar]
- Schwartz D, Gygi SP. 2005. An iterative statistical approach to the identification of protein phosphorylation motifs from large‐scale data sets. Nature Biotechnology 23: 1391–1398. [DOI] [PubMed] [Google Scholar]
- Silva RC, Castilho BA, Sattlegger E. 2018. A rapid extraction method for mammalian cell cultures, suitable for quantitative immunoblotting analysis of proteins, including phosphorylated GCN2 and eIF2α. MethodsX 5: 75–82. [DOI] [PMC free article] [PubMed] [Google Scholar]
- Sivitz A, Grinvalds C, Barberon M, Curie C, Vert G. 2011. Proteasome‐mediated turnover of the transcriptional activator FIT is required for plant iron‐deficiency responses. The Plant Journal 66: 1044–1052. [DOI] [PubMed] [Google Scholar]
- Sugiyama N, Nakagami H, Mochida K, Daudi A, Tomita M, Shirasu K, Ishihama Y. 2008. Large‐scale phosphorylation mapping reveals the extent of tyrosine phosphorylation in Arabidopsis. Molecular Systems Biology 4: e193. [DOI] [PMC free article] [PubMed] [Google Scholar]
- Takeo K, Ito T. 2017. Subcellular localization of VIP1 is regulated by phosphorylation and 14‐3‐3 proteins. FEBS Letters 591: 1972–1981. [DOI] [PubMed] [Google Scholar]
- Tian QY, Zhang XX, Yang A, Wang TZ, Zhang WH. 2016. CIPK23 is involved in iron acquisition of Arabidopsis by affecting ferric chelate reductase activity. Plant Science 246: 70–79. [DOI] [PubMed] [Google Scholar]
- Vert G, Grotz N, Dedaldechamp F, Gaymard F, Guerinot ML, Briat JF, Curie C. 2002. IRT1, an Arabidopsis transporter essential for iron uptake from the soil and for plant growth. Plant Cell 14: 1223–1233. [DOI] [PMC free article] [PubMed] [Google Scholar]
- Wang B, Li Y, Zhang WH. 2012. Brassinosteroids are involved in response of cucumber (Cucumis sativus) to iron deficiency. Annals of Botany 110: 681–688. [DOI] [PMC free article] [PubMed] [Google Scholar]
- Wang HY, Klatte M, Jakoby M, Baumlein H, Weisshaar B, Bauer P. 2007. Iron deficiency‐mediated stress regulation of four subgroup Ib BHLH genes in Arabidopsis thaliana . Planta 226: 897–908. [DOI] [PubMed] [Google Scholar]
- Wang N, Cui Y, Liu Y, Fan HJ, Du J, Huang ZA, Yuan YX, Wu HL, Ling HQ. 2013. Requirement and functional redundancy of Ib subgroup bHLH proteins for iron deficiency responses and uptake in Arabidopsis thaliana . Molecular Plant 6: 503–513. [DOI] [PubMed] [Google Scholar]
- van Wijk KJ, Friso G, Walther D, Schulze WX. 2014. Meta‐analysis of Arabidopsis thaliana phospho‐proteomics data reveals compartmentalization of phosphorylation motifs. Plant Cell 26: 2367–2389. [DOI] [PMC free article] [PubMed] [Google Scholar]
- Wild M, Daviere JM, Regnault T, Sakvarelidze‐Achard L, Carrera E, Lopez Diaz I, Cayrel A, Dubeaux G, Vert G, Achard P. 2016. Tissue‐specific regulation of gibberellin signaling fine‐tunes Arabidopsis iron‐deficiency responses. Developmental Cell 37: 190–200. [DOI] [PubMed] [Google Scholar]
- Xu J, Li HD, Chen LQ, Wang Y, Liu LL, He L, Wu WH. 2006. A protein kinase, interacting with two calcineurin B‐like proteins, regulates K+ transporter AKT1 in Arabidopsis . Cell 125: 1347–1360. [DOI] [PubMed] [Google Scholar]
- Yamada Y, Sato F. 2016. Tyrosine phosphorylation and protein degradation control the transcriptional activity of WRKY involved in benzylisoquinoline alkaloid biosynthesis. Scientific Reports 6: e31988. [DOI] [PMC free article] [PubMed] [Google Scholar]
- Yang KZ, Jiang M, Wang M, Xue S, Zhu LL, Wang HZ, Zou JJ, Lee EK, Sack F, Le J. 2015. Phosphorylation of serine 186 of bHLH transcription factor SPEECHLESS promotes stomatal development in Arabidopsis . Molecular Plant 8: 783–795. [DOI] [PubMed] [Google Scholar]
- Ye LX, Li L, Wang L, Wang SD, Li S, Du J, Zhang SQ, Shou HX. 2015. MPK3/MPK6 are involved in iron deficiency‐induced ethylene production in Arabidopsis . Frontiers in Plant Science 6: e953. [DOI] [PMC free article] [PubMed] [Google Scholar]
- Yoo SD, Cho YH, Tena G, Xiong Y, Sheen J. 2008. Dual control of nuclear EIN3 by bifurcate MAPK cascades in C2H4 signalling. Nature 451: 789–795. [DOI] [PMC free article] [PubMed] [Google Scholar]
- Yuan Y, Wu H, Wang N, Li J, Zhao W, Du J, Wang D, Ling HQ. 2008. FIT interacts with AtbHLH38 and AtbHLH39 in regulating iron uptake gene expression for iron homeostasis in Arabidopsis . Cell Research 18: 385–397. [DOI] [PubMed] [Google Scholar]
- Yuan YX, Zhang J, Wang DW, Ling HQ. 2005. AtbHLH29 of Arabidopsis thaliana is a functional ortholog of tomato FER involved in controlling iron acquisition in strategy I plants. Cell Research 15: 613–621. [DOI] [PubMed] [Google Scholar]
- Zhang J, Zhu HF, Liang H, Liu KF, Zhang AM, Ling HQ, Wang DW. 2006. Further analysis of the function of AtBHLH29 in regulating the iron uptake process in Arabidopsis thaliana . Journal of Integrative Plant Biology 48: 75–84. [Google Scholar]
- Zhao C, Wang P, Si T, Hsu C‐C, Wang L, Zayed O, Yu Z, Zhu Y, Dong J, Tao WA et al 2017. MAP kinase cascades regulate the cold response by modulating ICE1 protein stability. Developmental Cell 43: 618–629. [DOI] [PMC free article] [PubMed] [Google Scholar]
Associated Data
This section collects any data citations, data availability statements, or supplementary materials included in this article.
Supplementary Materials
Please note: Wiley Blackwell are not responsible for the content or functionality of any Supporting Information supplied by the authors. Any queries (other than missing material) should be directed to the New Phytologist Central Office.
Fig. S1 Representative recordings for nuclear mobility assays of phospho‐mutant FITm‐GFP forms.
Fig. S2 Controls for FIT‐ and FITm homo‐dimerization targeted yeast two‐hybrid assays.
Fig. S3 Controls for FIT‐ and FITm‐bHLH039 hetero‐dimerization targeted yeast two‐hybrid assays.
Fig. S4 Transcriptional self‐activation capacity differs in FIT phospho‐mutants.
Fig. S5 Immuno‐blot analysis and half‐life times for FIT‐GFP and FITm‐GFP forms in the quantified cell‐free protein degradation assay.
Table S1 List of recombinant plasmids and cloning procedures.
Table S2 List of primers for recombinant vector generation in alphabetical order.