

Abstract
Tau is an intrinsically disordered, microtubule-associated protein that has a role in regulating microtubule dynamics. Despite intensive research, the molecular mechanisms of Tau-mediated microtubule polymerization are poorly understood. Here we used single-molecule fluorescence to investigate the role of Tau's N-terminal domain (NTD) and proline-rich region (PRR) in regulating interactions of Tau with soluble tubulin. We assayed both full-length Tau isoforms and truncated variants for their ability to bind soluble tubulin and stimulate microtubule polymerization. We found that Tau's PRR is an independent tubulin-binding domain that has tubulin polymerization capacity. In contrast to the relatively weak interactions with tubulin mediated by sites distributed throughout Tau's microtubule-binding region (MTBR), resulting in heterogeneous Tau: tubulin complexes, the PRR bound tubulin tightly and stoichiometrically. Moreover, we demonstrate that interactions between the PRR and MTBR are reduced by the NTD through a conserved conformational ensemble. On the basis of these results, we propose that Tau's PRR can serve as a core tubulin-binding domain, whereas the MTBR enhances polymerization capacity by increasing the local tubulin concentration. Moreover, the NTD appears to negatively regulate tubulin-binding interactions of both of these domains. The findings of our study draw attention to a central role of the PRR in Tau function and provide mechanistic insight into Tau-mediated polymerization of tubulin.
Keywords: intrinsically disordered protein, tau protein (tau), Alzheimer's disease, microtubule-associated protein (MAP), single-molecule biophysics, cytoskeleton, fluorescence correlation spectroscopy (FCS), tauopathy, single-molecule FRET, tubulin polymerization
Introduction
Tau belongs to a family of microtubule-associated proteins that generally function to modulate microtubule stability and dynamics (1, 2). Deposition of aggregates of Tau is linked to a number of neurodegenerative disorders, collectively known as tauopathies (reviewed in Ref. 3). Cell death is thought to arise from the process of aggregation as well as from loss of functional Tau and subsequent destabilization of microtubules (3–5).
Tau is an intrinsically disordered protein, and it appears to remain largely disordered, even upon binding to soluble tubulin (6) or microtubules (7, 8). In vitro, Tau decreases the critical concentration for tubulin polymerization and regulates microtubule growth rates, catastrophe frequency, and recovery (9–11). More recently, Tau has been observed to sequester soluble tubulin during liquid–liquid phase separation, leading to microtubule polymerization and bundling (12). It has been proposed that this phenomenon may underlie the initiation of microtubules in the axons of neurons.
In the brain, there are six different isoforms of Tau, arising from alternative splicing, resulting in the presence of no, one, or two inserts in the N-terminal domain (NTD)2 and three or four repeats within the microtubule-binding region (MTBR) (Fig. 1) (13). Expression of these isoforms is regulated across developmental stage, cell type, and cellular location (3, 13). The MTBR is the best-studied domain of Tau because it contains the 31- or 32-residue-long eponymous repeat sequences that are important for binding to microtubules (14–16), but it also forms the core of aggregates in tauopathies (Fig. 1) (16–19). Several recent studies have focused on the role of R', the ∼25 residues C-terminal to the MTBR, a highly conserved sequence sometimes referred to as a pseudo-repeat (Fig. 1) (20–23). N-terminally flanking the MTBR is the proline-rich region (PRR), composed of ∼25% prolines across two subregions, P1 and P2 (Fig. 1). Addition of P2 and R' to MTBR fragments increases microtubule binding and stimulates polymerization (9–11, 20–24). The NTD, together with P1, is thought to regulate binding to and spacing of microtubules (9, 25–28) and mediate interactions with other cellular partners, such as signaling proteins (reviewed in Ref. 29) or the plasma membrane (30).
Figure 1.

Schematics of Tau constructs. The uppermost schematic shows the longest Tau isoform, tau2N. The domains and corresponding residues that delineate them are marked: the NTD with N-terminal inserts (N1 and N2), the PRR with subregions (P1 and P2), and the MTBR with four imperfect repeat sequences (R1–R4) flanked by the pseudo-repeat R' and the C terminus. Shown below are the additional Tau isoforms and truncated variants used in this study. All numbering of residues throughout the manuscript is based on tau2N. The nomenclature from Ref. 9 is shown in parentheses for relevant constructs. The corresponding amino acids for each construct with deletions subscripted are given.
Despite intense interest in Tau, the molecular details of its numerous proposed functions remain relatively obscure. This is in part due to the challenges that arise from its lack of a stable structure (31) and because it does not seem to form well-defined stoichiometric complexes with tubulin (21). To illustrate, it was demonstrated more than 20 years ago that P2 (9, 10, 23) greatly enhanced Tau binding to microtubules and its ability to polymerize tubulin (16), but this region of Tau is not observed in a recent structure of microtubule-bound Tau (7). It may be that P2 enhances binding indirectly through interactions with the MTBR (23) or that bound P2 is too disordered and dynamic on the microtubule surface to be resolved by EM. These apparently diverging observations and the need to reconcile them highlight the requirement for studies of Tau function that look beyond the MTBR.
Here we investigate the role of the NTD and PRR in regulating Tau's interactions with soluble tubulin. Single-molecule FRET (smFRET) and fluorescence correlation spectroscopy (FCS) of the full-length, N-terminal variants that contain four MTBR repeats (tau2N, tau1N, tau1N*, and tau0N) were used to monitor binding and probe Tau's conformation in Tau:tubulin assemblies. We found that, in the absence of tubulin, the NTD interacts with the PRR and MTBR through a conserved conformational ensemble. The NTD negatively regulates binding to soluble tubulin and subsequently slows polymerization. Strikingly, we found that the isolated PRR is capable of both stoichiometric binding to and polymerization of soluble tubulin. The presence of the NTD dramatically reduces the binding and polymerization capacity of the PRR. Based on our results, we propose a model where the PRR serves as a core tubulin-binding domain of Tau, with both binding and polymerization capacity enhanced by the MTBR and R' and reduced by the NTD.
Results
Conformational ensemble of Tau's NTD/PRR/MTBR is conserved across isoforms
In solution, the N terminus of Tau makes relatively close contacts with both the MTBR and the C terminus (32), which are lost when Tau binds soluble tubulin (6). We used smFRET to assess how the N-terminal inserts impact Tau's solution conformational ensemble. Full-length Tau isoforms were labeled with donor and acceptor fluorophores at sites spanning domains of interest (Fig. 2A). The mean energy transfer efficiencies, ETeff, were converted to experimental root-mean-square (RMSexp) distances using a Gaussian coil model (see “Experimental procedures” for details).
Figure 2.

SmFRET of Tau N-terminal isoforms. A, schematic of the reference construct tau2N, with residues labeled for smFRET measurements indicated. B, SmFRET histograms of tau2N, tau1N, tau1N*, and tau0N in the absence (dark, left axis) and presence (light, right axis) of 10 μm tubulin. Labeling positions are indicated at the top of each column. The histograms are fit to a sum of Gaussian distributions to determine the mean ETeff as detailed under “Experimental procedures.” Measurements were carried out in phosphate buffer (pH 7.4) at 20 °C. C, RMSexp were plotted in the absence (left) and presence (right) of 10 μm tubulin (53). Shaded regions indicate RMSexp that are too large to be determined accurately by the Alexa 488–Alexa 594 fluorophore pair. For reference, the RMS calculated for a random coil (RMSRC) as in Ref. 54 is indicated by the gray dashed line. Data are presented as mean ± S.D. n ≥ 3 independent measurements. See Table 2 for numerical values of ETeff ± S.D., RMSexp ± S.D., and RMSRC for each construct.
For constructs probing the C terminus, tau291–433, as well as the PRR, tau149–244, all three isoforms gave rise to comparable RMSexp values (Fig. 2B and Table 1); this was expected, as the number of residues encompassed by the probes is the same for all three NTD isoforms. The constructs probing the NTD, tau17–149, also exhibited predicted behavior in that the presence of each N-terminal insert resulted in an increase in the RMSexp (Fig. 2B and Table 1).
Table 1.
Summary of SmFRET biophysical data of Tau N-terminal isoforms
All numbering is based on tau2N. Unless otherwise noted, all constructs contain C291S and C322S mutations. “Labels” identifies the residues mutated to cysteine for site-specific labeling. Mean ETeff values are from fits to histograms as shown in Fig. 2 from measurements in the absence and presence of 10 μm tubulin. Values are mean ± S.D. for three or more independent measurements of 20–40 pm Tau in phosphate buffer (pH 7.4) at 20 °C. RMSexp was calculated from mean ETeff values as described under “Experimental Procedures,” and RMSRC was calculated from the theoretical random coil model for the number of residues noted (54).
| Isoform | Labels | No. of Residues | ETeff |
RMSexp (Å) |
RMSRC (Å) | |||
|---|---|---|---|---|---|---|---|---|
| −Tubulin | +Tubulin | −Tubulin | +Tubulin | |||||
| tau2N | 17 | 433 | 417 | 0.27 ± 0.02 | 0.10 ± 0.01 | 88 ± 3 | 134 ± 2 | 181 |
| 17 | 291 | 275 | 0.52 ± 0.02 | 0.11 ± 0.02 | 62 ± 1 | 129 ± 6 | 141 | |
| 17 | 244 | 228 | 0.62 ± 0.01 | 0.11 ± 0.01 | 52 ± 1 | 127 ± 2 | 126 | |
| 17 | 149 | 133 | 0.48 ± 0.01 | 0.25 ± 0.01 | 64 ± 1 | 92 ± 1 | 91 | |
| 149 | 244 | 96 | 0.43 ± 0.01 | 0.39 ± 0.01 | 68 ± 1 | 72 ± 1 | 75 | |
| 291 | 433 | 143 | 0.44 ± 0.01 | 0.31 ± 0.02 | 67 ± 1 | 82 ± 3 | 95 | |
| tau1N | 17 | 433 | 386 | 0.24 ± 0.01 | 0.13 ± 0.01 | 92 ± 2 | 124 ± 5 | 172 |
| 17 | 291 | 245 | 0.46 ± 0.01 | 0.15 ± 0.03 | 65 ± 1 | 116 ± 11 | 131 | |
| 17 | 244 | 198 | 0.60 ± 0.01 | 0.18 ± 0.01 | 54 ± 1 | 108 ± 3 | 115 | |
| 17 | 149 | 103 | 0.53 ± 0.01 | 0.37 ± 0.01 | 59 ± 1 | 75 ± 1 | 78 | |
| 149 | 244 | 96 | 0.44 ± 0.01 | 0.36 ± 0.01 | 67 ± 1 | 76 ± 1 | 75 | |
| 291 | 433 | 143 | 0.42 ± 0.01 | 0.30 ± 0.01 | 69 ± 1 | 84 ± 2 | 95 | |
| tau1N* | 17 | 433 | 386 | 0.26 ± 0.01 | 0.12 ± 0.01 | 89 ± 1 | 125 ± 2 | 172 |
| 17 | 291 | 245 | 0.45 ± 0.01 | 0.14 ± 0.02 | 66 ± 2 | 117 ± 10 | 131 | |
| 17 | 244 | 198 | 0.58 ± 0.01 | 0.14 ± 0.01 | 56 ± 1 | 117 ± 2 | 115 | |
| 17 | 149 | 103 | 0.56 ± 0.01 | 0.39 ± 0.01 | 57 ± 1 | 73 ± 1 | 78 | |
| 149 | 244 | 96 | 0.41 ± 0.01 | 0.38 ± 0.01 | 70 ± 1 | 73 ± 1 | 75 | |
| 291 | 433 | 143 | 0.46 ± 0.01 | 0.30 ± 0.01 | 65 ± 1 | 83 ± 1 | 95 | |
| tau0N | 17 | 433 | 358 | 0.28 ± 0.02 | 0.15 ± 0.01 | 86 ± 1 | 115 ± 5 | 165 |
| 17 | 291 | 216 | 0.46 ± 0.01 | 0.19 ± 0.01 | 67 ± 1 | 103 ± 3 | 122 | |
| 17 | 244 | 168 | 0.61 ± 0.01 | 0.20 ± 0.01 | 54 ± 1 | 101 ± 2 | 105 | |
| 17 | 149 | 75 | 0.72 ± 0.01 | 0.60 ± 0.01 | 46 ± 1 | 54 ± 1 | 65 | |
| 149 | 244 | 96 | 0.44 ± 0.01 | 0.40 ± 0.01 | 68 ± 1 | 71 ± 1 | 75 | |
| 291 | 433 | 143 | 0.46 ± 0.01 | 0.30 ± 0.02 | 65 ± 1 | 83 ± 2 | 95 | |
Interestingly, constructs whose labels span the NTD through the PRR, tau17–244, or the NTD through part of the MTBR, tau17–291, had comparable ETeff histograms, and, thus, RMSexp values in solution despite an increase of up to 60 residues between isoforms (Fig. 2B and Table 1). Similarly, the RMSexp values for the constructs probing the entirety of the isoforms, tau17–433, were also nearly equivalent; this is consistent with our observations of comparable RMSexp values for the subdomain constructs, tau17–291 and tau291–433, which make up tau17–433 (Fig. 2B and Table 1). The similar interdomain distances suggest homologous conformational ensembles between isoforms. Moreover, the ensembles for tau17–244 and tau17–291 are significantly more compact than expected for a random coil. To illustrate, the RMSexp values of the tau17–291 isoforms are of similar magnitude as those of tau149–244 despite being 120 to 180 residues longer (Fig. 2B and Table 1). Furthermore, the dimensions of tau149–244 are close to values predicted for an excluded volume polymer of an equivalent number of residues (gray dashed line in Fig. 2, B and C; values calculated in Table 1) so that, despite encompassing this very expanded region, tau17–244 and tau17–291 constructs are very compact.
The comparable ETeff values for tau17–244 and tau17–291 constructs, irrespective of the number of N-terminal inserts, suggested conserved interactions within the NTD/PRR/MTBR that were not strongly dependent upon sequence. To test this, we deleted the N1 insert from tau2N to create tau1N* (Fig. 1). As expected, the ETeff values and, consequently, the calculated RMSexp values for tau17–149, tau149–244, and tau291–433 constructs of tau1N* were all comparable with those of the physiological isoforms (Fig. 2B and Table 1). Consistent with our hypothesis, smFRET measurements of tau17–244, tau17–291, and tau17–433 constructs of tau1N* gave rise to RMSexp values comparable with those measured for the same constructs of tau0N, tau1N, and tau2N (Fig. 2B and Table 1). As a whole, our data demonstrate that the conserved ensemble within the NTD/PRR/MTBR are not insert-dependent but arise from a more general interaction mechanism within these domains. Both the MTBR and the PRR carry a positive net mean charge compared with the NTD, which carries a negative net mean charge irrespective of the specific isoform (Table 2) (55). One feasible explanation is that attractive electrostatic interactions between the NTD and the PRR/MTBR result in a compact ensemble that is largely independent of the inserts themselves. Upon binding to tubulin, deviations from scaling behavior were diminished, and all constructs yielded RMSexp values that scaled with the number of residues in a manner consistent with an extended random structure (Fig. 2C and Table 1) (6–8).
Table 2.
Charge profile of individual Tau domains
The net charge is the number of positively charged residues minus the number of negatively charged residues for each domain listed, calculated at pH 7.4 using Sequence Manipulation Suite (55). The mean net charge is the net charge divided by the number of residues for each domain.
| Domain | No. of Residues | Net Charge | Mean Net Charge |
|---|---|---|---|
| NTD2N | 149 | −21 | −0.14 |
| NTD1N | 119 | −18 | −0.15 |
| NTD1N* | 120 | −13 | −0.11 |
| NTD0N | 90 | −10 | −0.11 |
| PRR | 94 | 14 | 0.15 |
| MTBR | 125 | 9 | 0.07 |
| MTBR-R' | 152 | 12 | 0.08 |
| C-terminus | 44 | −3 | −0.07 |
Tau's NTD negatively regulates tubulin binding
The conservation of the conformational ensembles across N-terminal isoforms suggests a functional origin. This led us to examine the impact of the N-terminal inserts on Tau binding to soluble tubulin. Tubulin binding was assessed by FCS under nonpolymerizing conditions. Fluorescently labeled Tau was measured in the presence of increasing concentrations of tubulin. Both the longest full-length isoform, tau2N, and an NTD deletion fragment, tauΔN (amino acids 148–441), bound tubulin, as seen by an increase in the normalized diffusion time, τnorm, with increasing tubulin concentration (Fig. 3 and Table 3). However, there are significant differences in the binding curves; tau2N reached its maximum τnorm at ∼2.5 μm tubulin, whereas the τnorm for tauΔN continued to increase. At 10 μm tubulin, the τnorm of tauΔN was more than two times larger than that of tau2N (Fig. 3). This effect was specific to the NTD. Binding by a C-terminal deletion construct, tauΔC (amino acids 1–395), resembled that of tau2N (Fig. 3), whereas a combined N-terminal and C-terminal deletion construct, PRR-MTBR-R' (amino acids 148–395) behaved like tauΔN (Fig. 3). These measurements suggest that the NTD of Tau reduces or negatively regulates its binding to soluble tubulin, whereas the C terminus does not have a significant role. The τnorm values measured at 10 μm tubulin for constructs lacking the NTD are significantly greater than those including this domain, ∼2.7 ms as compared with ∼1 ms, with a larger spread in the diffusion times sampled (Fig. 3). In our prior work, we demonstrated that Tau forms fuzzy complexes with soluble tubulin consisting of multiple, weakly associated tubulin dimers (21). Using a similar approach as described in that work, we analyzed the individual autocorrelation curves of tau2N and PRR-MTBR-R' taken in the presence of 10 μm tubulin to assess the heterogeneity of the Tau:tubulin complexes (Fig. 4A; for details regarding the analysis, see “Experimental procedures”). From this analysis, it was apparent that Tau:tubulin complexes formed by PRR-MTBR-R' were, on average, larger (median diffusion time, τmedian, = 2.02 ms) than those formed by tau2N (τmedian = 1.29 ms), and that PRR-MTBR-R'–tubulin complexes also had the largest spread in diffusion times (1.26–2.89 ms). These complexes persisted at 300 mm KCl, indicating that they were not only present in low-salt buffer (Table 4). Analysis of the average brightness, counts per molecule (CPM), of the diffusing species demonstrated that, although tau2N typically consisted of a single Tau molecule, the PRR-MTBR-R'–tubulin complexes, especially the larger ones, may contain several Tau molecules (Fig. 4B and Table 4).
Figure 3.
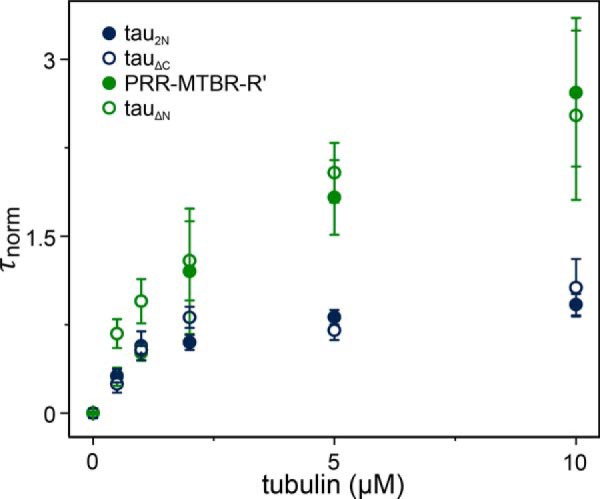
Inhibition of tubulin binding by the NTD. The increase in τnorm as a function of tubulin concentration reflects binding of fluorescently labeled Tau to unlabeled tubulin. All measurements were carried out in phosphate buffer (pH 7.4) at 20 °C. Data are presented as mean ± S.D., n ≥ 3 independent measurements. See “Experimental procedures” for details regarding data analysis. See Table 3 for numerical values for τD and τnorm at 10 μm tubulin and the labeling position for each construct.
Table 3.
Summary of FCS biophysical data of Tau isoforms and constructs
All numbering is based on tau2N. Unless otherwise noted, all constructs contain C291S and C322S mutations. CFCS is the residue number mutated to cysteine for labeling for FCS measurements. τD of Tau constructs are in the absence and presence of 10 μm tubulin. CPMnorm is the average CPM of labeled Tau in the presence of tubulin divided by the CPM of labeled Tau without tubulin. Values are mean ± S.D. for three or more independent measurements. Each measurement is the fitted average of multiple FCS curves from 15–25 nm Tau incubated with 10 μm tubulin in phosphate buffer (pH 7.4) at 20 °C. Asterisks indicate measurements with 300 mm KCl. The τnorm is calculated as described under “Experimental procedures.”
| Construct | CFCS | τD (ms) |
τnorm (ms) | CPM (kHz) |
CPMnorm (kHz) | ||
|---|---|---|---|---|---|---|---|
| −Tubulin | +Tubulin | +Tubulin | −Tubulin | +Tubulin | +Tubulin | ||
| tau2N | 433 | 0.80 ± 0.03 | 1.54 ± 0.09 | 0.92 ± 0.09 | 11 ± 4 | 15 ± 2 | 1.3 |
| tau1N | 433 | 0.76 ± 0.01 | 1.51 ± 0.16 | 0.87 ± 0.24 | 12 ± 1 | 15 ± 1 | 1.3 |
| tau1N* | 433 | 0.78 ± 0.03 | 1.53 ± 0.14 | 0.96 ± 0.14 | 12 ± 1 | 15 ± 2 | 1.3 |
| tau0N | 433 | 0.79 ± 0.02 | 1.57 ± 0.12 | 1.00 ± 0.12 | 12 ± 1 | 18 ± 2 | 1.5 |
| tau2Nscr | 433 | 0.78 ± 0.01 | 1.49 ± 0.09 | 0.92 ± 0.09 | 12 ± 1 | 16 ± 1 | 1.3 |
| tauΔN | 433 | 0.78 ± 0.02 | 2.71 ± 0.73 | 2.48 ± 0.73 | 18 ± 2 | 35 ± 8 | 1.9 |
| tauΔC | 17 | 0.79 ± 0.05 | 1.51 ± 0.15 | 0.92 ± 0.15 | 9 ± 1 | 16 ± 3 | 1.7 |
| 2N | 17 | 0.53 ± 0.07 | 0.53 ± 0.06 | -0.01 ± 0.06 | 7 ± 1 | 8 ± 1 | 1.1 |
| PRR | 149 | 0.47 ± 0.01 | 0.82 ± 0.03 | 0.75 ± 0.03 | 9 ± 1 | 9 ± 1 | 1.0 |
| MTBR | 322 | 0.50 ± 0.02 | 0.52 ± 0.01 | 0.05 ± 0.01 | 10 ± 1 | 10 ± 1 | 1.0 |
| MTBR-R' | 244 | 0.52 ± 0.01 | 0.76 ± 0.05 | 0.44 ± 0.05 | 9 ± 1 | 9 ± 1 | 1.0 |
| PRR-MTBR-R' | 149 | 0.72 ± 0.01 | 2.67 ± 0.63 | 2.72 ± 0.63 | 9 ± 2 | 26 ± 9 | 2.9 |
| PRR-MTBR-R'* | 149 | 0.73 ± 0.01 | 2.41 ± 0.99 | 2.30 ± 0.99 | 10 ± 1 | 20 ± 6 | 2.0 |
| PRR-MTBR | 149 | 0.70 ± 0.01 | 2.61 ± 0.26 | 2.25 ± 0.26 | 11 ± 1 | 22 ± 2 | 2.0 |
| 2N-PRR | 17 | 0.62 ± 0.01 | 0.76 ± 0.01 | 0.23 ± 0.01 | 8 ± 1 | 8 ± 1 | 1.0 |
| 0N-PRR | 17 | 0.51 ± 0.02 | 0.71 ± 0.01 | 0.40 ± 0.01 | 8 ± 1 | 7 ± 1 | 0.9 |
| 2N-MTBR-R' | 17 | 0.72 ± 0.01 | 0.72 ± 0.02 | -0.01 ± 0.02 | 8 ± 1 | 9 ± 1 | 1.0 |
| P1 | 149 | 0.32 ± 0.01 | 0.37 ± 0.01 | 0.16 ± 0.01 | 10 ± 1 | 10 ± 1 | 1.0 |
| P2 | 244 | 0.32 ± 0.02 | 0.39 ± 0.02 | 0.21 ± 0.02 | 11 ± 2 | 12 ± 2 | 1.0 |
| P2-MTBR | 322 | 0.60 ± 0.01 | 1.37 ± 0.18 | 1.27 ± 0.18 | 10 ± 1 | 13 ± 2 | 1.3 |
| P2-MTBR* | 322 | 0.67 ± 0.06 | 0.89 ± 0.13 | 0.33 ± 0.13 | 11 ± 2 | 10 ± 1 | 0.9 |
Figure 4.

Regulation of Tau:tubulin complex heterogeneity by the NTD. A, individual autocorrelation curves (gray dots) are plotted for tau2N (right) and PRR-MTBR-R' (left) in the presence of 10 μm tubulin. Averaged curves are indicated by colored dots, and fits of the averaged curves to Equation 2 are shown in black. Data plotted represent all collected curves from independent triplicate measurements measured on different days. B, the autocorrelation curves from A were fit individually to obtain a distribution of τD and CPM (kilohertz) values. When the NTD is absent, larger Tau:tubulin complexes form, as seen by the larger values of τD containing additional Tau molecules, as indicated by the increase in CPM (kilohertz). Measurements were carried out in phosphate buffer (pH 7.4) at 20 °C. See Table 3 for labeling positions of constructs.
Table 4.
Descriptive statistics of Tau:tubulin fuzzy complexes
The resulting correlation curves from 15–25 nM Tau incubated with 10 μm tubulin in phosphate (pH 7.4) at 20 °C were analyzed individually rather than averaged and fit to describe the distribution within each dataset. Shown are the statistics of the diffusion times from select Tau constructs incubated with 10 μm tubulin without and with our filtering algorithm. IQR, interquartile range. See “Experimental procedures” for details.
| Construct | Pre-filtering τD |
Post-filtering τD |
||||||
|---|---|---|---|---|---|---|---|---|
| Median (ms) | Mean ± S.D. | IQR | No. of Curves | Median (ms) | Mean ± S.D. | IQR | No. of Curves | |
| PRR-MTBR-R' | 2.24 | 2.52 ± 1.41 | 0.99 | 394 | 2.02 | 2.06 ± 0.42 | 0.63 | 304 |
| tau2N | 1.35 | 1.43 ± 0.34 | 0.29 | 419 | 1.29 | 1.31 ± 0.12 | 0.23 | 327 |
| tau2Nscr | 1.48 | 1.79 ± 1.11 | 0.37 | 392 | 1.42 | 1.44 ± 0.15 | 0.20 | 301 |
| tau1N | 1.49 | 1.76 ± 0.96 | 0.59 | 578 | 1.31 | 1.33 ± 0.19 | 0.27 | 348 |
| tau1N* | 1.55 | 1.73 ± 1.31 | 0.40 | 424 | 1.50 | 1.51 ± 0.20 | 0.34 | 383 |
| tau0N | 1.61 | 1.80 ± 0.86 | 0.47 | 434 | 1.55 | 1.57 ± 0.25 | 0.36 | 378 |
Measurements of tubulin binding by all three physiological N-terminal isoform variants (tau2N, tau1N, and tau0N), as well as by tau1N* revealed their binding curves to be comparable (Fig. 5A). As observed for tau2N, analysis of the individual autocorrelation curves of tau1N, tau1N*, and tau0N demonstrates that these isoforms also form smaller Tau:tubulin complexes than PRR-MTBR-R' (Fig. 5B), containing only a single Tau (Fig. S1 and Table 4). Analysis of diffusion times and brightness of the complexes suggests that the NTD limits the average number of tubulin dimers bound to a single Tau molecule and the average number of Tau found in Tau:tubulin complexes.
Figure 5.

Impact of NTD inserts N1 and N2 on binding and polymerization. A, the increase in τnorm as a function of tubulin concentration reflects binding of fluorescently labeled Tau to unlabeled tubulin. Data are presented as mean ± S.D., n ≥ 3 independent measurements. See Table 3 for numerical values for τD and τnorm at 10 μm tubulin. For comparison, tau2N and PRR-MTBR-R' from Fig. 3 are replotted. B, the autocorrelation curves for tau2N, tau1N, tau1N*, tau0N, and PRR-MTBR-R' in the presence of 10 μm tubulin were fit individually to obtain a distribution of τnorm values. Each individual τD was converted to τnorm by the average τD of each independent measurement (Table 3). When the NTD is absent, larger Tau:tubulin complexes form, as seen by the larger values of τnorm. Overlays are lognormal distributions. See Table 3 for labeling positions of constructs and Table 4 for descriptive statistics of distributions. Measurements were carried out in phosphate buffer (pH 7.4) at 20 °C. See “Experimental procedures” for details regarding data analysis. C, tubulin polymerization as measured by scattered light at 340 nm as a function of time. Measurements were made in phosphate buffer (pH 6.9) with 1 mm GTP at 37 °C with 5 μm Tau and 10 μm tubulin. See Table 5 for fit parameters. Data are presented as mean ± S.D. following normalization; n = 3 independent measurements. See “Experimental procedures” for details regarding data analysis. Arrows indicate depolymerization at 4 °C.
We explicitly tested for sequence specificity in the NTD's regulation of tubulin binding by scrambling the sequence of the N1/N2 inserts while retaining a distribution of charged and hydrophobic residues similar to the N1/N2 WT sequence, tau2Nscr (Fig. 1 and Fig. S2). As predicted, both the tubulin binding curve as well as the heterogeneity analysis of tau2Nscr are comparable with tau2N (Fig. S3 and Tables 3 and 4). Along with our smFRET measurements, these data support a model whereby regulation of tubulin binding by the NTD is largely independent of sequence and insert, likely arising from general electrostatic interactions between the NTD and the PRR/MTBR.
To determine a relationship between tubulin binding and polymerization of these constructs, the polymerization capacity of each construct was quantified. PRR-MTBR-R' had the fastest polymerization half-time (t½ = 52 ± 7 s) whereas the full-length isoforms, including tau1N*, were slower (Fig. 5C). This observation is in good agreement with prior work, where deletion of the NTD from various constructs led to small increases in polymerization rates (9). Interestingly, tau2N was the slowest (t½ = 137 ± 9 s), lagging behind tau1N, tau1N*, and tau0N (t½ = 85 ± 5 s, 88 ± 13 s, and 76 ± 10 s, respectively, and within error of each other) (Fig. 5C and Table 5). Thus, although the presence of any part of the NTD has the largest effect on binding and polymerization, the presence of both native inserts may enhance the inhibitory interactions between the NTD and PRR/MTBR. Minor differences in multiple microtubule dynamic parameters have been noted previously for tau2N and tau0N, both in vivo and in vitro (10, 22).
Table 5.
Tau-mediated polymerization
Polymerization t½ for Tau constructs shown in Figs. 5 and 6. Values listed for t½ are mean ± S.D. for n = 3 independent measurements. NA indicates constructs tested that did not measurably polymerize under assay conditions. The tubulin concentration was held constant at 10 μm across all polymerization experiments, with the Tau concentration varied according to the table below. Polymerizations were carried out in phosphate buffer (pH 6.9) with 1 mm GTP at 37 °C.
| Construct | t½ (s) | [Tau] (μm) |
|---|---|---|
| PRR-MTBR-R' | 52 ± 7 | 5 |
| tau2N | 137 ± 9 | 5 |
| tau1N | 85 ± 5 | 5 |
| tau1N* | 88 ± 13 | 5 |
| tau0N | 76 ± 10 | 5 |
| PRR | 96 ± 55 | 10 |
| 2N-PRR | NA | 10 |
| MTBR | NA | 10 |
| MTBR-R' | NA | 10 |
| 2N-MTBR-R' | NA | 10 |
The PRR independently binds and polymerizes tubulin
The reduced binding of NTD-containing constructs (Figs. 3 and 4), coupled with the conserved conformational ensembles in the NTD/PRR/MTBR constructs observed in the smFRET measurements (Fig. 2), led us to hypothesize that the NTD may regulate tubulin binding though interactions with the PRR or MTBR. To investigate this hypothesis, we created constructs corresponding to these domains and measured binding by FCS as well as Tau-mediated polymerization. Although the MTBR (amino acids 244–372) associates with microtubules in the context of the full-length protein or in constructs containing P2 (7, 15), the isolated domain bound only weakly to soluble tubulin (Fig. 6A) and was not capable of polymerizing tubulin (Fig. 6B). Addition of R', MTBR-R' (amino acids 244–395), enhanced binding (Fig. 6A) but still did not yield a construct that promoted efficient polymerization (Fig. 6B). Early studies demonstrated that the MTBR-R' (9), or even peptides corresponding to the individual MTBR repeats (33), had weak polymerization capacity, although 5- to 10-fold more Tau was required than the 10 μm used here.
Figure 6.

Independent polymerization capacity of the PRR, regulated by the NTD. A, binding of Tau constructs to tubulin as measured by an increase in τnorm as a function of tubulin concentration. Data are presented as mean ± S.D., n ≥ 3 independent measurements. Measurements were carried out in phosphate buffer (pH 7.4) at 20 °C. See Table 3 for labeling positions of constructs and Table 4 for descriptive statistics of distributions. See “Experimental procedures” for details regarding data analysis. The PRR data are fit with the Hill equation (orange line, Equation 1), yielding n = 1.7 ± 0.2 and an apparent KD ≈ 900 nm. B, tubulin polymerization as measured by scattered light at 340 nm as a function of time. Measurements were made in phosphate buffer (pH 6.9) with 1 mm GTP at 37 °C with 10 μm Tau and 10 μm tubulin. See Table 5 for fit parameters. Data are presented as mean ± S.D. following normalization, n = 3 independent measurements. Arrows indicate depolymerization at 4 °C. C, TEM images of microtubules formed by PRR-tubulin polymerization reaction, as in B (left and center panels), and the tubulin-only control (right panel). The region outlined in white in the left panel is shown at higher magnification in the center panel.
Strikingly and surprisingly, the isolated PRR (amino acids 148–244) bound tubulin tightly compared with the MTBR and MTBR-R' measured under the same conditions (Fig. 6A). Similarly, PRR exhibited a higher affinity for Taxol-stabilized microtubules compared with MTBR-R' (Fig. S4). Furthermore, unlike constructs where the PRR is coupled with the MTBR and/or R', such as PRR-MTBR or PRR-MTBR-R', the PRR demonstrated saturable binding and did not form large Tau:tubulin complexes (Fig. 7B and Fig. S5). As a consequence, unlike the binding curves of PRR-MTBR and PRR-MTBR-R', the PRR binding curves can be meaningfully fit with the Hill equation:
| (Eq. 1) |
where τnormmax is the normalized diffusion time for Tau:tubulin measured at 10 μm tubulin, n is the Hill coefficient and reflects the extent of cooperativity, KD is the apparent dissociation constant, and [tub] is the concentration of tubulin dimer. Fitting the PRR–tubulin binding curve to the Hill equation yields n = 1.7 ± 0.2 with an apparent KD ≈ 900 nm (Fig. 6A). In our previous work, we used the engineered protein construct RB3, which binds tubulin with 1:2 RB3:tubulin dimer stoichiometry to determine the expected τD of a 1:2 protein:tubulin dimer complex (21, 34). Here, the τD measured for the PRR at 10 μm tubulin (0.82 ± 0.03 ms) is consistent with 1:2 Tau:tubulin dimer stoichiometry. This observation, coupled with the cooperativity seen in the Hill equation fit, strongly supports the presence of two tubulin dimer binding sites in the PRR. This apparent specificity suggests that formation of Tau:tubulin fuzzy complexes arises primarily from the collective binding properties of the PRR and MTBR-R'. Tight binding of the PRR to tubulin required the presence of both proline-rich regions; fragments corresponding to P1 (amino acids 148–198) or P2 (amino acids 199–244) bound tubulin only weakly (Fig. 7A). Interestingly, a prior study noted that, although a P2-MTBR-R' construct lacked microtubule bundling capacity, addition of P1 to this construct conferred this ability (9), reflecting a similar enhancement in the interaction with stabilized microtubules that we found with soluble tubulin.
Figure 7.

The PRR forms stoichiometric complexes with tubulin. A, binding of Tau constructs to tubulin as measured by an increase in τnorm as a function of tubulin concentration. Data are presented as mean ± S.D., n ≥ 3 independent measurements. P1 and P2 bind only weakly but are comparable with or stronger than MTBR. Measurements were made in phosphate buffer (pH 7.4) at 20 °C. See Table 3 for labeling positions of constructs. For comparison, PRR and MTBR are replotted from Fig. 6A. B, the autocorrelation curves for PRR and PRR-MTBR-R' were fit individually to obtain a distribution of τnorm values at each tubulin concentration. Each individual τD was converted to τnorm by the average τD of each independent measurement (Table 3). Unlike PRR-MTBR-R', which forms tubulin concentration–dependent large complexes at tubulin concentrations exceeding ∼1 μm, PRR binding saturates and does not form large complexes. Data plotted represent all collected curves from independent triplicate measurements on different days. See “Experimental procedures” for details regarding data analysis.
Notably, the PRR also stimulated rapid polymerization of tubulin into microtubules (Figs. 6, B and C). Although P2 has been identified to enhance binding and accelerate polymerization in vitro when coupled to the MTBR (9, 10, 20, 23), independent polymerization capacity for PRR has not been reported previously. Rather, the opposite conclusion was reached by one study; namely, that the PRR is not capable of robust independent assembly of microtubules (23). More recent work demonstrated binding of a PRR-like construct (amino acids 166–246) to both stathmin-complexed tubulin and Taxol-stabilized microtubules with 1:2 stoichiometry (11). However, the polymerization capacity of this construct was not tested.
One reason why independent function of the PRR has been overlooked may be in part due to the widespread use of the K16 fragment consisting of P2 and the 4R MTBR (amino acids 198–372, P2-MTBR) (9). By FCS, the P2-MTBR construct binds to tubulin; however, it does not bind as many tubulin dimers at high tubulin concentrations as PRR-MTBR (Fig. S6). Thus, although the isolated P1 does not bind tubulin strongly (Fig. 7B), it does enhance binding and contribute to Tau function.
NTD negatively regulates the polymerization capacity of the PRR
Our observation that the PRR binds to and polymerizes tubulin independently of the MTBR (Fig. 6), combined with the slower polymerization rate of Tau constructs, including the NTD (tau2N, tau1N, tau1N*, and tau0N) relative to PRR-MTBR-R' (Figs. 3–5), motivated us to determine the impact of the NTD on interactions of the PRR with tubulin. Tau2N was truncated after the PRR at amino acid 244 (2N-PRR), and binding to soluble tubulin and polymerization capacity were measured. The presence of the NTD dramatically reduced binding (Fig. 6A) and significantly diminished tubulin polymerization capability (Fig. 6B). Truncated tau0N, 0N-PRR, showed similar binding behavior (Fig. S7).
Collectively, these results led us to propose that the binding and, by extension, polymerization capacities of Tau are regulated by interactions between the NTD and the PRR, as evidenced by the conserved ensembles observed with smFRET for this domain (in Fig. 2). Because the conserved ensembles extend into the MTBR (in Fig. 2 and Fig. S1), we tested this idea by making a construct lacking the PRR (2N-MTBR-R' amino acids 1–148 fused to 245–395). This construct also did not demonstrate appreciable binding to tubulin (Fig. 6A) whereas that same construct lacking the NTD (MTBR-R') clearly did (Fig. 6A). As expected from its weak binding to soluble tubulin, 2N-MTBR-R' was also not polymerization-competent (Fig. 6B). As a whole, these results strongly support a functional regulatory role for the compact, albeit disordered, NTD/PRR/MTBR ensembles observed by smFRET.
Discussion
Since it was first isolated over 40 years ago (1), both functional and structural studies of Tau have primarily focused on the MTBR (7–9, 14, 35). This study examines two domains of Tau that have been the subject of significantly less scrutiny: the NTD and the PRR. Our discoveries that the isolated PRR has the capacity to bind tubulin cooperatively and polymerize microtubules in vitro and that this function is negatively regulated by the NTD draw attention to the importance of these two domains in understanding Tau function.
The NTD has been shown previously to regulate the interaction of Tau with microtubules. Although not directly comparable with our results presented here with soluble tubulin, prior work by Mandelkow and co-workers (9) found that removal of the NTD increases the affinity of Tau for microtubules. Moreover, they observed that an NTD-lacking Tau fragment was capable of bundling Taxol-stabilized microtubules whereas the comparable construct including the NTD was not (9). This suggests a more promiscuous binding interaction for stabilized microtubules in the absence of the NTD, an observation consistent in spirit with the larger, heterogenous Tau:tubulin complexes formed by Tau constructs lacking the NTD, as described in our work (Fig. 4). Isoform-dependent regulation of microtubule bundling by the NTD is also cited in more recent papers (25, 26).
Although we do not quantify the impact of the NTD on the affinity of Tau for soluble tubulin, we do find an inhibitory effect of the NTD in binding to soluble tubulin (Figs. 3–6). This inhibition seems to be due to the NTD as a whole rather than resulting from the absence or presence of a specific insert within the domain, as only small differences in binding are observed for the tau0N, tau1N, tau1N*, and tau2N variants compared with a variant lacking the NTD (Fig. 5B). Insight into why the inserts do not have a significant effect in regulating binding is gained from our smFRET measurements, which show that the relative dimensions corresponding to the NTD-PRR (tau17–244) or NTD-MTBR (tau17–291) are independent of the number of inserts (Fig. 2 and Table 1). This suggests that conserved long-range interactions and/or conformational features of the NTD are important for regulating interactions with tubulin, more so than the inserts themselves. Given that the NTD also significantly reduces the size and heterogeneity of fuzzy Tau:tubulin complexes (Figs. 4 and 5 and Table 4) (21), it follows that the NTD may dynamically shield the weak tubulin binding sites distributed throughout the MTBR and R' (Fig. 8). Our results suggest that this screening is a general function of the NTD that serves as an initial regulatory gate to Tau-mediated polymerization and is largely independent of the individual N-terminal inserts.
Figure 8.

Model for regulation of Tau:tubulin interactions. The PRR (orange) binds tubulin tightly and stoichiometrically, negatively regulated by the NTD (blue). The MTBR-R' (red) increases the local tubulin concentration through distributed weak interactions, enhancing the polymerization capacity of Tau. The C terminus is colored black. Increasing both Tau and tubulin concentrations favors polymerization.
Prior work by our laboratory demonstrated a positive correlation between the rate of Tau-mediated tubulin polymerization and the size of Tau:tubulin complexes by systematically varying the number of tubulin binding sites in tau fragments (20). We find that this observation broadly holds for the full-length isoforms and fragments studied here in that PRR-MTBR-R' forms the largest Tau:tubulin complexes and has the shortest polymerization lag time (Fig. 5, B and C). Our current work refines that model to include controlling access to binding sites, and not simply the number of binding sites, as further regulating the kinetics of tubulin polymerization. Consistent with this model are smFRET data that show that the interactions between the NTD and PRR/MTBR observed in solution are lost upon tubulin binding (Figs. 2 and 8).
Our observation of assembly of tubulin by the isolated PRR was unexpected, as, to our knowledge, there are no prior reports of this in the literature. NMR chemical shifts suggesting binding were measured in the PRR of longer Tau fragments in the presence of engineered tubulin constructs (8, 11). We also found tight, saturable stoichiometric binding of 1:2 tau:tubulin dimers. Notably, PRR residues were not observed in the recent cryo-EM structure of microtubule-bound Tau (7). However, the high-resolution structures shown in that study were obtained with tau fragments lacking P1, which our results suggest is critical for tight binding of the PRR (Fig. 7A). It may also be that the PRR binds to a region unresolved within the structure, such as the intrinsically disordered tubulin tails. Alternatively, it may be that the PRR mediates binding at low Tau:tubulin ratios, such as the conditions of our experiments, but that it is not associated with the microtubule lattice at the high tau:tubulin ratios required for cryo-EM reconstructions.
The stoichiometric binding to soluble tubulin of the PRR provides a striking contrast with the dynamic, heterogeneous fuzzy Tau:tubulin complexes formed when the MTBR and R' were present in the constructs. In particular, tight and specific binding of the PRR may offer an attractive target for therapeutic targeting relative to the comparatively weak binding by the MTBR-R' (36). Interestingly, both P2 and R' were identified relatively early as sequences important for productive tau-mediated polymerization (8, 37). The jaws model proposed that targeting of tau to the microtubule lattice is through these regions, whereas the MTBR plays a catalytic role in assembly (10, 20, 37). Specifically, introduction of either P2 or R' to the three-repeat MTBR fragment enhanced binding to Taxol-stabilized microtubules almost 10-fold and decreased the polymerization lag time by a factor of two (9). The presence of both P2 and R' further enhanced the binding affinity and polymerization rate.
However, in our study, the PRR is the only isolated domain that demonstrates any significant tubulin polymerization capacity; this is not seen for MTBR or MTBR-R' (Fig. 6). This leads us to propose a variation of that model (Fig. 8). In our model, the PRR serves as the core tubulin binding domain, binding to two tubulin dimers in a critical step toward initiating polymerization. Multiple weak tubulin binding sites in the MTBR and R' allow increasing the local concentration of tubulin, resulting in accelerated microtubule growth. Ubiquitous screening by the NTD of both the PRR and the MTBR serves as an initial gating that controls the size of these Tau:tubulin ensembles and, consequently, tubulin assembly.
Tau's interactions with microtubules are regulated by phosphorylation (reviewed in Refs. 38, 39), and the majority of Tau's more than 40 known phosphorylation sites are located in the PRR, including those associated with Alzheimer's disease (40, 41). Given this, perhaps the relative importance of the PRR in both binding to and polymerizing tubulin should not be so surprising. It has long been known that phosphorylation at serines 199 and 202 and threonine 205 varies along growing axons (42). One very recent study reported a link between phosphorylation of P2 and proper axonal localization of Tau (43). However, the relationship between phosphorylation and microtubule binding is not straightforward; to illustrate, although phosphorylation of serine 214 and threonines 212 and 231 in the PRR and serine 262 in the MTBR lowers the affinity of Tau for microtubules, phosphorylation at other PRR sites has only a minor effect on microtubule binding (reviewed in Ref. 44). How phosphorylation at any of these sites impacts binding to soluble tubulin has not yet been tested. Moreover, the MTBR is also modified by lysine acetylation (40). Individual or combinatorial effects of these modifications may alter both the binding affinity and the stoichiometry of tubulin binding. There is at least one example of coordinated modifications to Tau in the literature: acetylation at lysines 280 and 281 within the MTBR influences phosphorylation at serines 202 and 205 within the PRR (45). As a whole, posttranslational modifications may influence the interaction of the PRR or MTBR with the NTD, suggesting that regulation of binding may be more complex than simply reducing affinity and stoichiometry, but instead, that there is an intricate interplay between the NTD, PRR, and MTBR domains.
Experimental procedures
Tubulin purification and handling
Tubulin was purified from fresh bovine brains as described previously (46). Purified tubulin was snap-frozen in BRB80 (80 mm PIPES (pH 6.8), 1 mm MgCl2, and 1 mm EGTA). Prior to use, frozen aliquots were rapidly thawed and then clarified at 100,000 × g for 6 min. BioSpin 6 columns (Bio-Rad) were used to buffer-exchange tubulin into the desired assay buffer. The tubulin absorbance at 280 nm was converted to concentration using a molar extinction coefficient of 115,000 M−1 cm−1. Tubulin was used within 2 h following clarification.
Tau cloning, purification, and labeling
The parent tau plasmid encodes for the longest human Tau isoform, tau2N. It includes an N-terminal His tag with a tobacco etch virus (TEV) protease cleavage site for purification (6). For site-specific fluorescent labeling, the native cysteines, Cys-291 and Cys-322, are mutated to serine to allow introduction of cysteines at the desired locations. Tau1N, tau1N*, and tau0N were generated using deletion cloning from the tau2N plasmid. The nicked DNA fragments were fused using T4 DNA ligase (New England Biolabs) and T4 polynucleotide kinase (New England Biolabs). The remaining Tau fragments were generated using either site-directed mutagenesis to introduce stop codons and cysteines, deletion cloning of the remaining Tau amino acids within the parent Tau vector, or a combination of the two techniques.
For the tau2Nscr construct, the Sequence Manipulation Suite (http://www.bioinformatics.org/sms/index.html)3 was used to generate a series of random sequences based on residues 45–103, corresponding to the N1 and N2 inserts. We chose the shuffled sequence that most closely matched the distribution of hydrophobic and charged residues found in the WT sequence without replicating the majority of that sequence. This oligonucleotide was synthesized (Integrated DNA Technologies) with flanking nucleotides in tau0N (C291S, C322S, S433C) for splicing by overlap extension (47).
For all constructs (expect tau1N) longer than 200 residues, protein expression was induced with 1 mm IPTG at OD ∼0.6 overnight at 16 °C. For constructs shorter than 200 residues, Tau protein expression was induced with 1 mm IPTG at OD ∼0.8 for 4–5 h at 37 °C. Tau1N constructs were induced with 1 mm IPTG at OD ∼0.8 at 25 °C for 4–5 h. Purification was based on methods reported previously (6). Briefly, cells were lysed by sonication, and the cell debris was pelleted by centrifugation. The supernatant was incubated with nickel-nitrilotriacetic acid resin (Qiagen or Bio-Rad), and the recombination protein was bump-eluted with 500 mm imidazole. The His tag was removed by incubation with laboratory-purified TEV proteinase for either 4 h at 20 °C (constructs shorter than 200 residues) or overnight at 4 °C (constructs longer than 200 residues). Uncleaved protein was removed by a second pass over the nickel-nitrilotriacetic acid column. Remaining contaminants were removed using size exclusion chromatography on a HiLoad 16/600 Superdex 200 Column (GE Life Sciences). Proteins that did not require fluorescent labeling were buffer-exchanged using Amicon concentrators (Millipore) into the final assay buffer of interest, aliquoted, and snap-frozen for storage at −80 °C. Because of the small size and lack of aromatic residues, P1 and P2 were TEV-cleaved as described above but after fluorescent labeling (below). All other proteins were labeled following elution from the size exclusion column.
All FRET and FCS measurements were carried out in constructs where both native cysteines have been mutated to serine, C291/322S; for FRET, two additional cysteines were introduced at the desired locations as indicated in Table 2. For FCS, a single cysteine was introduced as indicated in Table 3. Site-specific labeling of Tau for FRET or FCS measurements was carried out as described previously (6). Briefly, Tau was incubated with 1 mm DTT for 30 min and then buffer-exchanged into labeling buffer (20 mm Tris (pH 7.4), 50 mm NaCl, and 6 m guanidine HCl). For FRET-labeled constructs, the donor fluorophore, Alexa Fluor 488 maleimide (Invitrogen), was added at substoichiometric ratios (0.3–0.5×) and incubated at room temperature for 15 min. A 3-fold molar excess of the acceptor fluorophore, Alexa Fluor 594 maleimide (Invitrogen), was added, and the reaction was incubated for another 10 min at room temperature and then moved to 4 °C for overnight incubation. For FCS-labeled constructs, Alexa Fluor 488 maleimide was added in 3-fold molar excess and incubated at room temperature for 10 min, followed by overnight incubation at 4 °C. Labeling reactions were protected from ambient light and stirred constantly; the dye was added dropwise. For shorter constructs and tau1N, incubation for 1.5 h at room temperature instead of overnight at 4 °C was used on occasion. The labeled protein was buffer-exchanged into 20 mm Tris (pH 7.4) and 50 mm NaCl, and unreacted dye was removed using HiTrap desalting columns (GE Life Sciences). Labeled protein was aliquoted and snap-frozen for storage at −80 °C. Cloned constructs were verified by MALDI-TOF MS analysis.
FCS instrument and data analysis
All FCS measurements were performed on our home-built instrument as described previously (21). Prior to entering the inverted Olympus 1X-71 microscope, the laser power was adjusted to ∼5 μW (488-nm diode-pumped solid-state laser, Spectra-Physics) and focused into the sample via a ×60 water immersion objective (Olympus). Fluorescence emission from the sample was collected through the objective, separated from excitation light by a Z488RDC long-pass dichroic and a 500-nm long pass filter (Chroma). The filtered emission was focused the aperture of a 50-μm-diameter optical fiber (OzOptics) coupled to an avalanche photodiode (PerkinElmer Life Sciences). A digital correlator (FLEX03LQ-12) generated the autocorrelation curves.
Measurements were made in eight-chamber Nunc coverslips (Thermo-Fisher) passivated by incubation with PEG-poly(l-lysine) (PEG-PLL) (48). The labeled Tau (15–25 nm) and tubulin (concentrations vary) were incubated in chambers for 5 min prior to measurement. Unless otherwise noted, all FCS experiments were carried out in phosphate buffer (pH 7.4) (20 mm phosphate, 20 mm KCl, 1 mm MgCl2, 0.5 mm EGTA, and 1 mm DTT) at 20 °C. Multiple (20–40) 10-s autocorrelation curves were collected per sample and fit to a single-component 3D diffusion equation:
| (Eq. 2) |
where G(τ) is the autocorrelation function as a function of time (τ), τD is the translational diffusion time of the labeled molecules, and N is the average number of fluorescent species. For our instrument, the ratio of the radial to axial dimensions of the focal volume (s) was determined to be 0.2 and consequently fixed for analysis. The recorded intensity trace is divided by N to give CPM in kilohertz.
For some Tau constructs, high tubulin concentrations (>1 μm) result in formation of large bright species (Figs. 4 and 5, Figs. S1 and S3, and Table 4). These species are not present in the traces of protein in the absence of tubulin (Figs. S6 and S8). A prior study by our laboratory demonstrated that these species are Tau:tubulin–specific, electrostatically sensitive, and reversible (21). For P2-MTBR, increasing the KCl concentration in our phosphate buffer to 300 mm, seen previously by NMR to disrupt interactions between the PRR and tubulin, results in disassembly of the larger species (Table 3) (20). In the case of PRR-MTBR-R', these species persist even at 300 mm KCl, suggesting that the binding is either tighter or has a more hydrophobic character (Table 3).
The individual autocorrelation curves arising from these larger assemblies disproportionally weight the averaged autocorrelation curves used in the analysis described above (Table 4 and Fig. S8). Working under the premise that removal of these outliers would allow a more meaningful analysis of the majority of Tau:tubulin complexes, we developed an algorithm to remove aberrant curves, broadly following the approach we described previously (21). Individual autocorrelation curves were fit with Equation 2 and assessed the goodness of fit using least-squares X2 = [G(τ)fit − G(τ)raw]2 with a tolerance of X2 = 0.0001 for a consecutive run of 75 ms. In other words, if the fit deviated beyond the X2 for more than 75 ms, then the curve was discarded. This process removes 99.5% of curves that cannot be accurately fit using Equation 2. The frequency of these aberrant curves is ∼3% (Fig. S8A).
Autocorrelation curves arising from larger assemblies that pass this initial criterion still skew the data toward slower diffusion times (Table 4). Descriptive statistics of these diffusion times are reported in Table 4 as “pre-filtering.” In some cases, such as PRR-MTBR-R', the measured τD could be as large as ∼14 ms and up to four times brighter than unbound Tau (Figs. S8, B and C). Although of potential interest in another context, these species do not represent the majority of the Tau:tubulin complexes of interest here. These outliers were removed in an iterative fashion by testing the individual curves using an Anderson–Darling statistical test for either a lognormal or normal distribution. Diffusion times above or below the interquartile range were removed until a stable population was reached, and no more curves were removed from the dataset. We did not enforce a lognormal or normal distribution on the dataset prior to outlier removal or continue to use outlier removal when the population was normal or lognormal after testing. This iterative function is demonstrated for tau2N in the absence (Fig. S8D) or presence of 10 μm tubulin (Fig. S8E). The initial iteration simply tests for normality (seen by the straight line in Fig. S8D for a single iteration). This results the removal approximately ∼15%–25% of curves that passed the initial goodness-of-fit filtering from the dataset (Table 4).
The fit parameters from the individual filtered curves are presented in Fig. 4A and Fig. S8 (τnorm and CPM), and the descriptive statistics of these values across multiple independent measurements are listed in Table 4 and graphed in Figs. 4B, 5B, and 7B and S1, S3B, and S8. There is a general correlation showing that Tau:tubulin complexes with larger τDs also had larger CPMs, reflecting the presence of multiple Tau molecules in these assemblies (Fig. 4B). To allow straightforward comparison between Tau constructs, we also averaged the filtered curves from each independent measurement and fit the average curve with Equation 2. These τD values obtained from these fits are reported in Table 3 for saturating points and are graphed in figures with FCS binding curves (Figs. 3, 4A, 5A, 6A, and 7A and S2A, S3A, S5, S6, and S7).
Tau constructs of different lengths have different diffusion times. To allow for straightforward comparison of the extent of binding between the various constructs, the diffusion times for each construct in the presence of tubulin τDbound were normalized to that of the construct in the absence of tubulin (τDfree) as follows:
| (Eq. 3) |
FRET instrument and analysis
FRET histograms where the protein signal was readily distinguishable from the “zero peak” (49), arising from imperfect labeling, were carried out on our laboratory-built instrument, as described above with a few modifications. The laser power was adjusted to ∼30 μW (488-nm diode-pumped solid-state laser, Spectra-Physics) prior to entering the microscope. Donor and acceptor photons were separated using a HQ585 long-pass dichroic and further selected with ET525/50 M band-pass and HQ600 long-pass filters (Chroma). For each path, the emission was focused onto the aperture of a 100-μm-diameter optical fiber (OzOptics) coupled to an Avalanche photodiode (PerkinElmer Life Sciences). Time traces were collected in 1-ms time bins for 1 h. As described above, measurements were carried out in PEG-PLL–coated Nunc chambers with 20–40 pm labeled Tau following 5-min incubation with tubulin.
To differentiate photon bursts arising from transit of a labeled molecule from background fluorescence, a photon count threshold of 30 counts/ms was applied. For each burst, ETeff was calculated using a laboratory-based written software (MATLAB) according to the following equation (50, 51):
| (Eq. 4) |
where Ia is the intensity of the acceptor photons and Id is the intensity of the donor photons. Within our system, the bleedthrough of the donor channel into the acceptor channel (β) and the difference in the total quantum efficiency of the system and fluorophores (γ) were determined using Alexa Fluor 488 hydrazine (Invitrogen) and Alexa Fluor 594 hydrazine (Invitrogen) and fixed for analysis. Because of variations in instrument build and detector efficiency over the course of the study, β and γ were redetermined regularly and checked with DNA standards of 10, 14, and 18 bases labeled with Alexa Fluor 488 and Alexa Fluor 594 (Integrated DNA Technologies). The energy efficiencies were then binned, and the histograms were fit using a sum of Gaussians in Origin. One Gaussian described the zero peak (donor-only fluorescence), and the second peak described donor- and acceptor-labeled protein (main peak fit listed in Table 2). In some cases, the distribution was asymmetric (such as tau17–149). In these cases, three Gaussians were used to fit the data. The Gaussian that fit the dominant peak is reported in Table 2.
At some of the labeling positions, the proteins gave rise to low energy efficiencies with overlap with zero peak, making it difficult to accurately determine the peak ETeff for the protein sample. To separate donor-only labeled species from the low-energy donor- and acceptor-labeled species, measurements were repeated on a commercial MicroTime 200 time-resolved confocal microscope (Picoquant) using its pulsed interleaved excitation FRET mode. The power of the excitation lasers (485 nm and 562 nm) were matched ∼30 μW at 40 MHz. The fluorescence emission was focused through a 100-μm pinhole and collected by Avalanche photodiode. Fluorescence emissions of the donor and acceptor fluorophores were separated using a HQ585 long-pass dichroic and further selected with ET525/50 M band-pass and HQ600 long-pass filters. SymphoTime 64 software was used to analyze the photon bursts to yield the ETeff and stoichiometry factors for each burst, using photon threshold, binning, and experimentally determined β and γ values as described previously. The binned histograms were fit as described above.
Tubulin light-scattering assay
Polymerization of soluble tubulin was measured by monitoring the increase in scattered light at 340 nm. The tubulin was clarified as described above and buffer-exchanged in phosphate buffer (pH 6.9) (20 mm phosphate, 20 mm KCl, 1 mm MgCl2, 0.5 mm EGTA, and 1 mm DTT) immediately prior to use. For polymerization reactions, 10 μm tubulin was incubated with 5 μm Tau (for tau2N, tau1N, tau1N*, tau0N, and PRR-MTBR-R') or 10 μm Tau (for PRR, 2N-PRR, MTBR, and MTBR-R') for 2.5 min on ice prior to addition of 1 mm GTP. Immediately after addition of GTP, the reaction was transferred to a warmed cuvette, and the reaction was monitored for 10 min at 37 °C in a fluorometer (Fluorolog FL-1039/40, Horiba) with a photon-counting module (SPEX DM302, Horiba), with both excitation and emission wavelengths set to 340 nm. Following polymerization, the samples were quickly returned to 4 °C for 5 min; cold depolymerization is evidence that the proteins are not aggregated.
The curves were normalized to account for account for day-to-day variability in lamp intensity and fit in Origin with
| (Eq. 5) |
where y is the normalized fluorescence intensity, t is time, t½ is the polymerization half-time, and dt is the time constant. The mean and standard deviation of the t½ values are listed in Table 5. The plotted graphs represent the average of the normalized triplicate with standard deviation. Curves with very little polymerization were normalized to the brightest intensity within the given day.
Polymerization assays were carried out with WT constructs (containing the native cysteines at residues 291 and 322) and with constructs that had been designed for FCS measurements but had not been labeled (native cysteines at residues 291 and 322 mutated to serines with an additional cysteine mutation introduced for labeling). For PRR-MTBR-R', we directly compared the polymerization kinetics of WT and the T149C-C291S/C322S mutants and found that, within the resolution of the light-scattering assay, the curves are identical (Fig. S9). This indicates that removal of the native cysteines does not impact the ability of Tau to polymerize tubulin and that introduction of a nonnative cysteine for labeling purposes does not impact the ability of Tau to polymerize tubulin (also tested with WT PRR and PRRT149C). Thus, for the data shown in Figs. 5C and 6B, the triplicate measurements often consist of both WT and C291S/C322S variants. To illustrate, for one triplicate, one curve was obtained with WT Tau, whereas the other two were obtained with the C291S/C322S mutant (or vice versa).
EM imaging
Polymerization reactions using PRR were carried out and monitored as described above. After 10 min of polymerization at 37 °C, the sample was transferred to Cu-coated 200 mesh EM grids (Electron Microscopy Sciences, FCF200-Cu) and incubated with 20 μm Taxol on the grid for 1.5 min, as generally described in published protocols (52). The grids were washed with BRB80 buffer to remove interfering phosphate salts and stained with 2% uranyl acetate. Images were taken on a JEOL JEM-1011 transmission electron microscope.
Microtubule pelleting assay
Taxol-stabilized microtubules were made by incubating ∼65 μm clarified tubulin with 4 μm Taxol for 15 min at 37 °C. The Taxol concentration was increased to 40 μm, followed by incubation for another 15 min. The polymerized microtubules were pelleted by ultracentrifugation at 353,000 × g for 20 min at 25 °C. The resulting pellet was resuspended in phosphate buffer adjusted to pH 6.9. The concentration of the harvested microtubules was determined by absorbance at 280 nm (ϵ = 115,000 M−1 cm−1) after cold and chemical denaturation in 8 m urea at 4 °C. The Taxol-stabilized microtubules were diluted to 10 μm in phosphate buffer (pH 6.9) and incubated with 1 μm Alexa Fluor 488–labeled Tau for 10 min at room temperature. The microtubules and associated Tau were pelleted by centrifugation at 353,000 × g for 20 min. The pellet was resuspended in an equal volume as the collected supernatant (70 μl) and cold-denatured. Tau in the absence of microtubules was subjected to the same assay as a control. Quantification of microtubule binding was by SDS-PAGE; the band intensity of Alexa Fluor 488 fluorescence was analyzed using ImageJ. The gels were imaged using Typhoon FLA 7000. Both Alexa Fluor 488 fluorescence and Coomassie staining were recorded for the same gel.
Author contributions
K. M. M. and E. R. conceptualization; K. M. M. data curation; K. M. M. software; K. M. M. formal analysis; K. M. M. validation; K. M. M. and E. R. investigation; K. M. M. visualization; K. M. M. and E. R. methodology; K. M. M. writing-original draft; K. M. M. and E. R. writing-review and editing; E. R. resources; E. R. supervision; E. R. funding acquisition.
Supplementary Material
Acknowledgments
We thank H. Y. J Fung, S. Wickramasinghe, I. Yannatos, and H. Merens for assistance with the various tubulin purifications; the Chenoweth laboratory for use of their fluorimeter; the Svitkina laboratory for use of their transmission electron microscope, and C. Yang for assistance with the microscope and insightful suggestions.
This work was supported by National Institutes of Health Institutional Training Grant T32 GM071399 (to K. M. M.) and NIA, National Institutes of Health Grant AG053951 (to E. R.). The authors declare that they have no conflicts of interest with the contents of this article. The content is solely the responsibility of the authors and does not necessarily represent the official views of the National Institutes of Health.
This article contains Figs. S1–S9 and supporting references.
Please note that the JBC is not responsible for the long-term archiving and maintenance of this site or any other third party–hosted site.
- NTD
- N-terminal domain
- MTBR
- microtubule-binding region
- PRR
- proline-rich region
- smFRET
- single-molecule FRET
- FCS
- fluorescence correlation spectroscopy
- CPM
- counts per molecule
- TEV
- tobacco etch virus
- IPTG
- isopropyl 1-thio-β-d-galactopyranoside
- OD
- optical density
- W
- watt
- RMS
- root-mean-square.
References
- 1. Weingarten M. D., Lockwood A. H., Hwo S. Y., and Kirschner M. W. (1975) A protein factor essential for microtubule assembly. Proc. Natl. Acad. Sci. U.S.A. 72, 1858–1862 10.1073/pnas.72.5.1858 [DOI] [PMC free article] [PubMed] [Google Scholar]
- 2. Drubin D. G., and Kirschner M. W. (1986) Tau protein function in living cells. J. Cell Biol. 103, 2739–2746 10.1083/jcb.103.6.2739 [DOI] [PMC free article] [PubMed] [Google Scholar]
- 3. Guo T., Noble W., and Hanger D. P. (2017) Roles of tau protein in health and disease. Acta Neuropath. 133, 665–704 10.1007/s00401-017-1707-9 [DOI] [PMC free article] [PubMed] [Google Scholar]
- 4. Ballatore C., Lee V. M., and Trojanowski J. Q. (2007) Tau-mediated neurodegeneration in Alzheimer's disease and related disorders. Nat. Rev. Neurosci. 8, 663–672 10.1038/nrn2194 [DOI] [PubMed] [Google Scholar]
- 5. Winklhofer K. F., Tatzelt J., and Haass C. (2008) The two faces of protein misfolding: gain- and loss-of-function in neurodegenerative diseases. EMBO J. 27, 336–349 10.1038/sj.emboj.7601930 [DOI] [PMC free article] [PubMed] [Google Scholar]
- 6. Melo A. M., Coraor J., Alpha-Cobb G., Elbaum-Garfinkle S., Nath A., and Rhoades E. (2016) A functional role for intrinsic disorder in the tau-tubulin complex. Proc. Natl. Acad. Sci. U.S.A 113, 14336–14341 10.1073/pnas.1610137113 [DOI] [PMC free article] [PubMed] [Google Scholar]
- 7. Kellogg E. H., Hejab N. M. A., Poepsel S., Downing K. H., DiMaio F., and Nogales E. (2018) Near-atomic model of microtubule-tau interactions. Science 360, 1242–1246 10.1126/science.aat1780 [DOI] [PMC free article] [PubMed] [Google Scholar]
- 8. Mukrasch M. D., Bibow S., Korukottu J., Jeganathan S., Biernat J., Griesinger C., Mandelkow E., and Zweckstetter M. (2009) Structural polymorphism of 441-residue tau at single residue resolution. PLoS Biol. 10.1371/journal.pbio.1000034 [DOI] [PMC free article] [PubMed] [Google Scholar]
- 9. Gustke N., Trinczek B., Biernat J., Mandelkow E. M., and Mandelkow E. (1994) Domains of tau protein and interactions with microtubules. Biochemistry 33, 9511–9522 10.1021/bi00198a017 [DOI] [PubMed] [Google Scholar]
- 10. Trinczek B., Biernat J., Baumann K., Mandelkow E. M., and Mandelkow E. (1995) Domains of tau protein, differential phosphorylation, and dynamic instability of microtubules. Mol. Biol. Cell 6, 1887–1902 10.1091/mbc.6.12.1887 [DOI] [PMC free article] [PubMed] [Google Scholar]
- 11. Fauquant C., Redeker V., Landrieu I., Wieruzseski J.-M., Verdegem D., Laprevote O., Lippens G., Gigant B., and Knossow M. (2011) Systematic identification of tubulin interacting fragments of the microtubule-associated protein tau leads to a highly efficient promoter of microtubule assembly. J. Biol. Chem. 33358–333658 [DOI] [PMC free article] [PubMed] [Google Scholar]
- 12. Hernández-Vega A., Braun M., Scharrel L., Jahnel M., Wegmann S., Hyman B. T., Alberti S., Diez S., and Hyman A. A. (2017) Local nucleation of microtubule bundles through tubulin concentration into a condensed tau phase. Cell Rep. 20, 2304–2312 10.1016/j.celrep.2017.08.042 [DOI] [PMC free article] [PubMed] [Google Scholar]
- 13. Andreadis A. (2005) Tau gene alternative splicing: expression patterns, regulation and modulation of function in normal brain and neurodegenerative diseases. Biochim. Biophys. Acta 1739, 91–103 10.1016/j.bbadis.2004.08.010 [DOI] [PubMed] [Google Scholar]
- 14. Goode B. L., Chau M., Denis P. E., and Feinstein S. C. (2000) Structural and functional differences between 3-repeat and 4-repeat tau isoforms: implications for normal tau function and the onset of neurodegenerative disease. J. Biol. Chem. 275, 38182–38189 10.1074/jbc.M007489200 [DOI] [PubMed] [Google Scholar]
- 15. Butner K. A., and Kirschner M. W. (1991) Tau protein binds to microtubules through a flexible array of distributed weak sites. J. Cell Biol. 115, 717–730 10.1083/jcb.115.3.717 [DOI] [PMC free article] [PubMed] [Google Scholar]
- 16. Goode B. L., and Feinstein S. C. (1994) Identification of a novel microtubule binding and assembly domain in the developmentally regulated inter-repeat region of tau. J. Cell Biol. 124, 769–782 10.1083/jcb.124.5.769 [DOI] [PMC free article] [PubMed] [Google Scholar]
- 17. Falcon B., Zivanov J., Zhang W., Murzin A. G., Garringer H. J., Vidal R., Crowther R. A., Newell K. L., Ghetti B., Goedert M., and Scheres S. H. W. (2019) Novel tau filament fold in chronic traumatic encephalopathy encloses hydrophobic molecules. Nature 568, 420–423 10.1038/s41586-019-1026-5 [DOI] [PMC free article] [PubMed] [Google Scholar]
- 18. Fitzpatrick A. W. P., Falcon B., He S., Murzin A. G., Murshudov G., Garringer H. J., Crowther R. A., Ghetti B., Goedert M., and Scheres S. H. W. (2017) Cryo-EM structures of tau filaments from Alzheimer's disease. Nature 547, 185–190 10.1038/nature23002 [DOI] [PMC free article] [PubMed] [Google Scholar]
- 19. Falcon B., Zhang W., Murzin A. G., Murshudov G., Garringer H. J., Vidal R., Crowther R. A., Ghetti B., Scheres S. H. W., and Goedert M. (2018) Structures of filaments from Pick's disease reveal a novel tau protein fold. Nature 561, 137–140 10.1038/s41586-018-0454-y [DOI] [PMC free article] [PubMed] [Google Scholar]
- 20. Mukrasch M. D., von Bergen M., Biernat J., Fischer D., Griesinger C., Mandelkow E., and Zweckstetter M. (2007) The “jaws” of the tau-microtubule interaction. J. Biol. Chem. 282, 12230–12239 10.1074/jbc.M607159200 [DOI] [PubMed] [Google Scholar]
- 21. Li X.-H., and Rhoades E. (2017) Heterogeneous tau-tubulin complexes accelerate microtubule polymerization. Biophys. J. 112, 2567–2574 10.1016/j.bpj.2017.05.006 [DOI] [PMC free article] [PubMed] [Google Scholar]
- 22. Niewidok B., Igaev M., Sündermann F., Janning D., Bakota L., and Brandt R. (2016) Presence of a carboxy-terminal pseudorepeat and disease-like pseudohyperphosphorylation critically influence tau's interaction with microtubules in axon-like processes. Mol. Biol. Cell 27, 3537–3549 10.1091/mbc.e16-06-0402 [DOI] [PMC free article] [PubMed] [Google Scholar]
- 23. Goode B. L., Denis P. E., Panda D., Radeke M. J., Miller H. P., Wilson L., and Feinstein S. C. (1997) Functional interactions between the proline-rich and repeat regions of tau enhance microtubule binding and assembly. Mol. Biol. Cell 8, 353–365 10.1091/mbc.8.2.353 [DOI] [PMC free article] [PubMed] [Google Scholar]
- 24. Gigant B., Landrieu I., Fauquant C., Barbier P., Huvent I., Wieruszeski J. M., Knossow M., and Lippens G. (2014) Mechanism of Tau-promoted microtubule assembly as probed by NMR spectroscopy. J. Am. Chem. Soc. 136, 12615–12623 10.1021/ja504864m [DOI] [PubMed] [Google Scholar]
- 25. Rosenberg K. J., Ross J. L., Feinstein H. E., Feinstein S. C., and Israelachvili J. (2008) Complementary dimerization of microtubule-associated tau protein: implications for microtubule bundling and tau-mediated pathogenesis. Proc. Natl. Acad. Sci. U.S.A. 105, 7445–7450 10.1073/pnas.0802036105 [DOI] [PMC free article] [PubMed] [Google Scholar]
- 26. Chung P. J., Choi M. C., Miller H. P., Feinstein H. E., Raviv U., Li Y., Wilson L., Feinstein S. C., and Safinya C. R. (2015) Direct force measurements reveal that protein Tau confers short-range attractions and isoform-dependent steric stabilization to microtubules. Proc. Natl. Acad. Sci. U.S.A. 112, E6416–E6425 10.1073/pnas.1513172112 [DOI] [PMC free article] [PubMed] [Google Scholar]
- 27. Chen J., Kanai Y., Cowan N. J., and Hirokawa N. (1992) Projection domains of MAP2 and tau determine spacings between microtubules in dendrites and axons. Nature 360, 674–677 10.1038/360674a0 [DOI] [PubMed] [Google Scholar]
- 28. Scott C. W., Klika A. B., Lo M. M., Norris T. E., and Caputo C. B. (1992) Tau protein induces bundling of microtubules in vitro: comparison of different tau isoforms and a tau protein fragment. J. Neurosci. Res. 33, 19–29 10.1002/jnr.490330104 [DOI] [PubMed] [Google Scholar]
- 29. Morris M., Maeda S., Vossel K., and Mucke L. (2011) The many faces of tau. Neuron 70, 410–426 10.1016/j.neuron.2011.04.009 [DOI] [PMC free article] [PubMed] [Google Scholar]
- 30. Brandt R., Léger J., and Lee G. (1995) Interaction of tau with the neural plasma membrane mediated by tau's amino-terminal projection domain. J. Cell Biol. 131, 1327–1340 10.1083/jcb.131.5.1327 [DOI] [PMC free article] [PubMed] [Google Scholar]
- 31. Cleveland D. W., Hwo S.-Y., and Kirschner M. W. (1977) Physical and chemical properties of purified tau factor and the role of tau in microtubule assembly. J. Mol. Biol. 116, 227–247 10.1016/0022-2836(77)90214-5 [DOI] [PubMed] [Google Scholar]
- 32. Elbaum-Garfinkle S., and Rhoades E. (2012) Identification of an aggregation-prone structure of Tau. J. Am. Chem. Soc. 134, 16607–16613 10.1021/ja305206m [DOI] [PMC free article] [PubMed] [Google Scholar]
- 33. Ennulat D. J., Liem R. K., Hashim G. A., and Shelanski M. L. (1989) Two separate 18-amino acid domains of tau promote the polymerization of tubulin. J. Biol. Chem. 264, 5327–5330 [PubMed] [Google Scholar]
- 34. Li X.-H., Culver J. A., and Rhoades E. (2015) Tau binds to multiple tubulin dimers with helical structure. J. Am. Chem. Soc. 137, 9218–9221 10.1021/jacs.5b04561 [DOI] [PMC free article] [PubMed] [Google Scholar]
- 35. Maccioni R. B., Rivas C. I., and Vera J. C. (1988) Differential interaction of synthetic peptides from the carboxyl-terminal regulatory domain of tubulin with microtubule-associated proteins. EMBO J. 7, 1957–1963 10.1002/j.1460-2075.1988.tb03033.x [DOI] [PMC free article] [PubMed] [Google Scholar]
- 36. Chong F. P., Ng K. Y., Koh R. Y., and Chye S. M. (2018) Tau proteins and tauopathies in Alzheimer's disease. Cell Mol. Neurobiol. 38, 965–980 10.1007/s10571-017-0574-1 [DOI] [PMC free article] [PubMed] [Google Scholar]
- 37. Preuss U., Biernat J., Mandelkow E. M., and Mandelkow E. (1997) The “jaws” model of tau-microtubule interaction examined in CHO cells. J. Cell Sci. 110, 789–800 [DOI] [PubMed] [Google Scholar]
- 38. Hanger D. P., Anderton B. H., and Noble W. (2009) Tau phosphorylation: the therapeutic challenge for neurodegenerative disease. Trends Mol. Med. 15, 112–119 10.1016/j.molmed.2009.01.003 [DOI] [PubMed] [Google Scholar]
- 39. Buée L., Bussière T., Buée-Scherrer V., Delacourte A., and Hof P. R. (2000) Tau protein isoforms, phosphorylation and role in neurodegenerative disorders. Brain Res. Rev. 33, 95–130 10.1016/S0165-0173(00)00019-9 [DOI] [PubMed] [Google Scholar]
- 40. Morris M., Knudsen G. M., Maeda S., Trinidad J. C., Ioanoviciu A., Burlingame A. L., and Mucke L. (2015) Tau post-translational modifications in wild-type and human amyloid precursor protein transgenic mice. Nat. Neurosci. 18, 1183–1189 10.1038/nn.4067 [DOI] [PMC free article] [PubMed] [Google Scholar]
- 41. Funk K. E., Thomas S. N., Schafer K. N., Cooper G. L., Liao Z., Clark D. J., Yang A. J., and Kuret J. (2014) Lysine methylation is an endogenous post-translational modification of tau protein in human brain and a modulator of aggregation propensity. Biochem. J. 462, 77–88 10.1042/BJ20140372 [DOI] [PMC free article] [PubMed] [Google Scholar]
- 42. Mandell J. W., and Banker G. A. (1996) A spatial gradient of tau protein phosphorylation in nascent axons. J. Neurosci. 16, 5727–5740 10.1523/JNEUROSCI.16-18-05727.1996 [DOI] [PMC free article] [PubMed] [Google Scholar]
- 43. Iwata M., Watanabe S., Yamane A., Miyasaka T., and Misonou H. (2019) Regulatory mechanisms for the axonal localization of tau protein in neurons. Mol. Biol. Cell 30, 2441–2457 10.1091/mbc.E19-03-0183 [DOI] [PMC free article] [PubMed] [Google Scholar]
- 44. Wang Y., and Mandelkow E. (2016) Tau in physiology and pathology. Nat. Rev. Neurosci. 17, 5–21 10.1038/ncb3086 [DOI] [PubMed] [Google Scholar]
- 45. Trzeciakiewicz H., Tseng J.-H., Wander C. M., Madden V., Tripathy A., Yuan C.-X., and Cohen T. J. (2017) A dual pathogenic mechanism links tau acetylation to sporadic tauopathy. Sci. Rep. 7, 44102–44102 10.1038/srep44102 [DOI] [PMC free article] [PubMed] [Google Scholar]
- 46. Castoldi M., and Popov A. V. (2003) Purification of brain tubulin through two cycles of polymerization-depolymerization in a high-molarity buffer. Protein Expr. Purif. 32, 83–88 10.1016/S1046-5928(03)00218-3 [DOI] [PubMed] [Google Scholar]
- 47. Holehouse A. S., Das R. K., Ahad J. N., Richardson M. O., and Pappu R. V. (2017) CIDER: Resources to analyze sequence-ensemble relationships of intrinsically disordered proteins. Biophys. J. 112, 16–21 10.1016/j.bpj.2016.11.3200 [DOI] [PMC free article] [PubMed] [Google Scholar]
- 48. Elbaum-Garfinkle S., Cobb G., Compton J. T., Li X.-H., and Rhoades E. (2014) Tau mutants bind tubulin heterodimers with enhanced affinity. Proc. Natl. Acad. Sci. U.S.A. 111, 6311–6316 10.1073/pnas.1315983111 [DOI] [PMC free article] [PubMed] [Google Scholar]
- 49. Kapanidis A. N., Lee N. K., Laurence T. A., Doose S., Margeat E., and Weiss S. (2004) Fluorescence-aided molecule sorting: analysis of structure and interactions by alternating-laser excitation of single molecules. Proc. Natl. Acad. Sci. U.S.A. 101, 8936–8941 10.1073/pnas.0401690101 [DOI] [PMC free article] [PubMed] [Google Scholar]
- 50. Metskas L. A., and Rhoades E. (2015) Conformation and dynamics of the Troponin I C-terminal domain: combining single-molecule and computational approaches for a disordered protein region. J. Am. Chem. Soc. 137, 11962–11969 10.1021/jacs.5b04471 [DOI] [PMC free article] [PubMed] [Google Scholar]
- 51. Trexler A. J., and Rhoades E. (2010) Single molecule characterization of α-synuclein in aggregation-prone states. Biophys. J. 99, 3048–3055 10.1016/j.bpj.2010.08.056 [DOI] [PMC free article] [PubMed] [Google Scholar]
- 52. Vemu A., Szczesna E., Zehr E. A., Spector J. O., Grigorieff N., Deaconescu A. M., and Roll-Mecak A. (2018) Severing enzymes amplify microtubule arrays through lattice GTP-tubulin incorporation. Science 361, eaau1504 10.1126/science.aau1504 [DOI] [PMC free article] [PubMed] [Google Scholar]
- 53. O'Brien E. P., Morrison G., Brooks B. R., and Thirumalai D. (2009) How accurate are polymer models in the analysis of Förster resonance energy transfer experiments on proteins? J. Chem. Phys. 130, 124903 10.1063/1.3082151 [DOI] [PMC free article] [PubMed] [Google Scholar]
- 54. Kohn J. E., Millett I. S., Jacob J., Zagrovic B., Dillon T. M., Cingel N., Dothager R. S., Seifert S., Thiyagarajan P., Sosnick T. R., Hasan M. Z., Pande V. S., Ruczinski I., Doniach S., and Plaxco K. W. (2004) Random-coil behavior and the dimensions of chemically unfolded proteins. Proc. Natl. Acad. Sci. U.S.A. 101, 12491–12496 10.1073/pnas.0403643101 [DOI] [PMC free article] [PubMed] [Google Scholar]
- 55. Stothard P. (2000) The Sequence Manipulation Suite: JavaScript programs for analyzing and formatting protein and DNA sequences. BioTechniques 28, 1102–1104 10.2144/00286ir01 [DOI] [PubMed] [Google Scholar]
Associated Data
This section collects any data citations, data availability statements, or supplementary materials included in this article.