

Abstract
The D2 dopamine receptor and the serotonin 5-hydroxytryptamine 2A receptor (5-HT2A) are closely-related G-protein–coupled receptors (GPCRs) from the class A bioamine subfamily. Despite structural similarity, they respond to distinct ligands through distinct downstream pathways, whose dysregulation is linked to depression, bipolar disorder, addiction, and psychosis. They are important drug targets, and it is important to understand how their bias toward G-protein versus β-arrestin signaling pathways is regulated. Previously, evolution-based computational approaches, difference Evolutionary Trace and Evolutionary Trace–Mutual information (ET-Mip), revealed residues and residue pairs that, when switched in the D2 receptor to the corresponding residues from 5-HT2A, altered ligand potency and G-protein activation efficiency. We have tested these residue swaps for their ability to trigger recruitment of β-arrestin2 in response to dopamine or serotonin. The results reveal that the selected residues modulate agonist potency, maximal efficacy, and constitutive activity of β-arrestin2 recruitment. Whereas dopamine potency for most variants was similar to that for WT and lower than for G-protein activation, potency in β-arrestin2 recruitment for N124H3.42 was more than 5-fold higher. T205M5.54 displayed high constitutive activity, enhanced dopamine potency, and enhanced efficacy in β-arrestin2 recruitment relative to WT, and L379F6.41 was virtually inactive. These striking differences from WT activity were largely reversed by a compensating mutation (T205M5.54/L379F6.41) at residues previously identified by ET-Mip as functionally coupled. The observation that the signs and relative magnitudes of the effects of mutations in several cases are at odds with their effects on G-protein activation suggests that they also modulate signaling bias.
Keywords: G-protein–coupled receptor (GPCR), dopamine receptor, dopamine, arrestin, allosteric regulation, G protein, cell signaling
Introduction
G-protein–coupled receptors, the dominant mechanism by which we sense our external and internal environment, convey their signals through divergent downstream signaling pathways, particularly G-protein activation and β-arrestin signaling. Of these, the β-arrestin pathway appears to be more complex and is less completely understood. Signaling events depend not only on agonist binding to the receptor and the resultant conformational changes, but also on agonist-dependent phosphorylation and multiple protein–protein and protein–lipid interactions occurring both at the cell surface and at the surface of intracellular endosomal vesicles (1–5).
Although both G-protein activation and β-arrestin signaling result from agonist binding, they do so on distinct time scales and, in at least some cases, in different locations and molecular contexts (6, 7). Considerable evidence suggests that the conformational states of the receptors triggering these pathways are also different (8, 9). Understanding the molecular mechanisms for these diverging pathways is important for understanding their roles in cellular physiology. It is also important for understanding the pharmacology of existing and yet-to-be discovered therapeutics, most of which act directly or indirectly on GPCR2 pathways (10–14). In this work we use the term “bias” to indicate the relative tendency for a ligand or a receptor to signal via one pathway versus another, particularly as compared with the responses of the WT receptor to its endogenous ligand, dopamine.
The D2 dopamine receptor is arguably the GPCR of most pervasive neuropharmacological importance, due to its role in the actions of virtually all psychotropic drugs and in human disorders ranging from substance abuse to Parkinson's disease (2, 15–19). Recent studies in vivo using either biased drugs selected for preferential activation of one pathway or the other downstream of D2R (20) or D2R variants engineered to trigger β-arrestin or G-protein pathways selectively (21), have confirmed that different behavioral effects of D2R-directed drugs act differentially through these two pathways.
Previously, we have used D2 dopamine receptors as a model system for testing the predictive value of evolution-based computational tools for identifying amino acid residues and pairs of residues important for specificity, potency, and efficacy of GPCR signaling; the results have confirmed their value in this regard (22, 23). Note that we use the term “efficacy” here in its normal meaning (the “ability to effect a desired result”) with the result of interest being the response in our assays, and not “efficacy” as used in describing drug responses in clinical pharmacology. In the work presented here, we have tested the roles of these computationally identified residues in β-arrestin engagement and activation. Comparison of their roles in G-protein versus β-arrestin signaling also serves to validate the evolutionary importance of fine-tuned signaling bias in GPCRs. Although there have been a number of studies on residues at the GPCR cytoplasmic surface regulating differential interactions with β-arrestins and G-proteins (24–28), our focus here is on residues within the seven transmembrane helices that convey the allosteric signal from the ligand-binding site to the cytoplasmic surface (29–31).
The computational techniques employed are the Evolutionary Trace (22, 23, 32–37), which ranks residues in terms of their evolutionary sensitivity to mutations, and a synthesis of the Evolutionary Trace with mutual information-based assessment of co-evolution and functional coupling termed ET-Mip (23), which ranks pairs of residues by their correlated impact on function. The experimental method employed for assessing β-arrestin signaling is the TANGO assay (38), routinely used to test the effects of compounds on this signaling pathway (39). The assay is exquisitely sensitive because of its highly-amplified nature, employing transcription factor release and chemiluminescent detection of luciferase expression. It reports exclusively on physical interactions between an engineered version of the receptor and an engineered version of β-arrestin2, so many of the subtleties of this complex pathway may be missing. However, it does provide a useful measure of relative recruitment efficiencies in a cellular context.
Results
Residue selection
The difference ET algorithm was used to select residues differing between D2R and 5-HT2A within the transmembrane domain as described previously (22). Fourteen residues ranked as being of high evolutionary importance (top 40%) were chosen, but three of lower importance (bottom 20%), I105K3.23, A188N5.37, and I195F5.44, were also studied as negative controls. The amino acid residues chosen to replace the WT residues at the selected positions were those found in the 5-HT2A receptor, based on the hypothesis, largely borne out by experiments (22, 23), that those substitutions are compatible with proper folding and stability but associated with distinct signaling properties. Two double mutations, I48T1.46/F110W3.28 and T205M5.54/L379F6.41, were chosen to assess functional coupling based on analysis by the ET-Mip algorithm, which ranks pairs of residues according to their mutual information integrated into the ET framework as described previously (23). The resulting set of 19 mutants (Fig. 1), along with WT D2R, were tested in the β-arrestin2 recruitment assay. None of them are within the region thought to be the site of interactions with β-arrestin, and only two, F110W3.28 and C118S3.36, are near the agonist-binding site.
Figure 1.
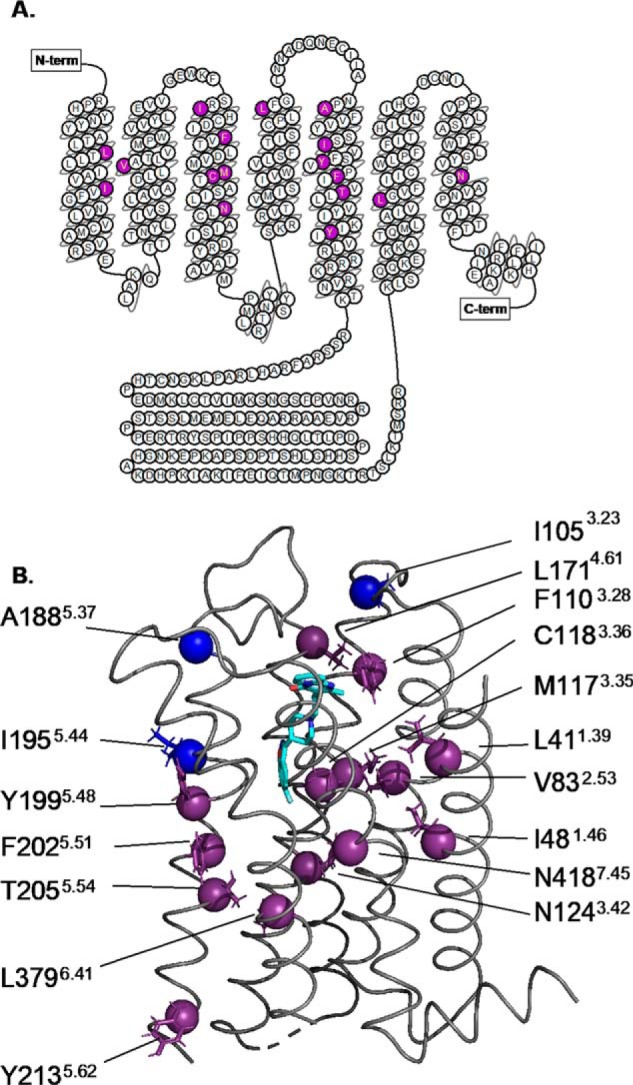
Summary of mutations used to test allosteric regulation of β-arrestin2 recruitment to D2R. A, serpentine plot of D2R from GPCRdb with the residues of interest chosen based on difference-ET highlighted in purple. B, ET residues are shown in the structure of D2R as spheres (Cα atoms) and side chains, with hydrogens (PDB 6CM4, Wang et al. (43)). The spheres of the low ranked residues are in blue and the high ranked residues are in purple. The compound in cyan is the inverse agonist risperidone, located in the binding pocket. Superscripts represent the Ballesteros-Weinstein index for each residue.
Surface expression was measured for each construct as described under “Experimental procedures” and in the figure legends and routinely remeasured in conjunction with TANGO assays in order to correct for differences and to allow determination of relative efficacies. All the mutants studied display levels of surface expression comparable with those of WT, although the results varied from day to day and between plasmid preparations.
Evolutionary Trace residues alter β-arrestin2 responses to dopamine
To test whether any of the D2R mutations fine-tune the response to dopamine, we generated TANGO assay dose-response curves to detect changes in potency and efficacy (Figs. 2 and 3; Tables 1 and 2). The EC50 value for dopamine acting on WT D2R in this assay, 56 nm, is similar to the value of 41 nm reported previously based on a bioluminescence resonance energy transfer assay that measures β-arrestin2 recruitment more directly on a shorter time scale (36), suggesting the assay used here is a faithful reporter of β-arrestin2 recruitment. The WT EC50 value is significantly higher than the values measured previously for activation of Gαi (6.6 nm (36) or 9.7 nm (23)), consistent with the idea that G-protein activation and β-arrestin activation depend on distinct receptor conformations with distinct affinities for dopamine. The results for the mutant D2R constructs revealed altered responses relative to WT, including both increases and decreases in dopamine potency, both increases and decreases in efficacy, and increases in constitutive activity.
Figure 2.

Dopamine potency for β-arrestin recruitment. A–C, example TANGO assay dopamine dose-response curves shown normalized to maximum and minimum values of the best-fit curves. Points and error bars represent means ± S.E. of three technical replicates. Error bars not shown are smaller than the symbols. D, dopamine potency data from multiple experiments (n = 3–11 for mutants and 25 for WT). Points represent pEC50 values obtained from sigmoidal curve fits of raw data from the TANGO dose-response for each day tested. For T205M5.54, which exhibited a biphasic dose-response, data were truncated at 10−6 m for fitting to the sigmoidal curve. L379F6.41 is not included because the TANGO response is similar to that of the negative control. The bars represent means ± S.E. of the points shown. All mutants were compared with WT using an unpaired two-tailed t test; ****, p < 0.0001; *, p < 0.05. Detailed information about the sample sizes and statistics is provided in Table 1.
Figure 3.

Relative efficacy of β-arrestin recruitment by dopamine. A and B, example of dopamine dose-response curves for assays carried out in parallel on the same day. Points are means ± S.E.M. of single-day experiments (n = 3 for mutants and 9 for WT). Error bars that are not shown are smaller than the symbols. Raw intensity values are shown, uncorrected for surface expression levels relative to WT, which were: logSErel (± S.D.) = −0.1 ± 0.18 (T205M), 0.71 ± 0.33 (L379F), and 0.56 ± 0.47 (V83L). C, constitutive activity was determined from the bottom plateau of dose-response curve fits, except for L379F6.41 where the response with no drug added was used, relative to WT, and normalized by mean surface expression. Points show constitutive activity values of biological replicates (i.e. single-day experiments; n = 3–6 for mutants and 38 for WT), and bars represent means ± S.E. D, dopamine efficacy. Points represent the maximal response relative to WT on individual days, based on the maximal values of the best-fit curves for the dose-response data, normalized for mean surface expression relative to WT. For the inactive mutant, L379F6.41, the response to 10−5 m dopamine is plotted. The bars represent the mean values ± S.E. over multiple biological replicates, handled and plotted as in C. In both C and D, for those values that appeared different at the p < 0.05 level by two-tailed unpaired t test, values were tested at the positive or negative extreme of the 95% confidence level for mean log(relative surface expression) and scored as significantly different (*) only if the differences were retained when re-normalized for those surface expression values. Detailed information about the sample sizes and statistics is provided in Table 1.
Table 1.
Potency and efficacy of dopamine in β-arrestin2 recruitment to D2R mutants
TANGO assay results for detecting β-arrestin2 recruitment to D2R variants are shown. The nonlinear regression curve-fitting analysis and statistics are described under “Experimental procedures.” The Erel p values with asterisks indicate values are different from WT over the 95% confidence limit range for log(mean relative surface expression).
| D2R variant | Na | pEC50b | EC50 | S.E. (log pEC50) | p valuec (vs. WT) | Ereld | S.E. | p valuee (vs. WT) |
|---|---|---|---|---|---|---|---|---|
| nm | ||||||||
| WT | 25 | 7.25 | 56 | 0.054 | 1 | 0.022f | ||
| L41T1.39 | 4 | 7.15 | 71 | 0.15 | 0.95 | 0.51 | 0.26 | 0.1 |
| I48T1.46 | 11 | 7.53 | 30 | 0.23 | *0.032 | 0.75 | 0.10 | 0.03 |
| V83L2.53 | 10 | 7.25 | 56 | 0.08 | 1.0 | 0.66 | 0.12 | 0.014* |
| I105K3.23 | 5 | 7.18 | 65 | 0.11 | 0.9 | 0.99 | 0.16 | .95 |
| F110W3.28 | 4 | 6.84 | 145 | 0.06 | *0.027 | 1.09 | 0.44 | 0.91 |
| I48T1.46/F110W3.28 | 3 | 6.96 | 110 | 0.17 | 0.31 | 0.52 | 0.16 | 0.06 |
| M117F3.35 | 4 | 7.14 | 72 | 0.08 | 0.9 | 0.39 | 0.17 | 0.014 |
| C118S3.36 | 4 | 6.27 | 540 | 0.04 | ***0.0001 | 0.68 | 0.26 | 0.278 |
| N124H3.42 | 3 | 6.95 | 111 | 0.08 | 0.26 | 1.06 | 0.55 | 0.919 |
| L171P4.61 | 11 | 7.13 | 74 | 0.04 | 0.36 | 1.20 | .271 | .169 |
| A188N5.37 | 3 | 6.92 | 120 | 0.16 | 0.22 | 0.35 | 0.07 | 0.003 |
| I195F5.44 | 3 | 6.92 | 121 | 0.14 | 0.22 | 1.27 | 0.54 | 0.643 |
| Y199F5.48 | 3 | 6.99 | 102 | 0.17 | 0.39 | 0.35 | 0.08 | 0.004 |
| F202L5.51 | 3 | 6.33 | 467 | 0.13 | ***0.0001 | 0.44 | 0.10 | 0.001 |
| T205M5.54 | 11 | 7.56 | 28 | 0.31 | *0.016 | 1.60 | 0.165 | 0.002* |
| Y213I5.62 | 3 | 7.04 | 92 | 0.14 | 0.53 | 0.20 | 0.10 | 0.003 |
| L379F6.41 | 4 | Ambiguous | 0.06 | 0.02 | 0.0001* | |||
| T205M/L379F1 | 3 | 7.07 | 84 | 0.20 | 0.46 | 0.36 | 0.06 | 0.0026 |
| N418S7.45 | 3 | 5.86 | 1385 | 0.22 | ***0.0001 | 0.27 | 0.09 | 0.0034 |
a Sample size (biological replicates) is shown.
b Means of biological replicates, each containing three technical triplicates, are shown. The term “Ambiguous” is used in place of numerical values for L379F6.41 because it did not respond to dopamine, precluding calculation of an accurate EC50 value.
c p values were determined using Student's t test. *, p < 0.05; ***, p < 0.0005.
d The Erel values are relative to WT, with scaling by relative surface expression.
e The p values were determined using two-tailed unpaired Student's t test, with N for WT set to N for the mutant being compared, and WT S.D. set to 0.11.
f The S.D. was estimated as mean relative sample standard deviation for each day's samples (3–9 each day) over 25 separate experiments on 25 different days.
Table 2.
Values for β-arrestin-2 and G-protein–coupling to D2R after dopamine treatment
| D2R variant | Gαi pEC50a | Gαi EC50a | Gα16 pEC50b | Gα16 EC50b | ARRB2 pEC50 | ARRB2 EC50 | Gαi Erel | ARRB2 Erel | pKia | Ki vs. spiperonea | pKib | Ki vs. spiperoneb |
|---|---|---|---|---|---|---|---|---|---|---|---|---|
| nm | nm | nm | μm | μm | ||||||||
| WT | 8.01 | 9.8 | 7.24 | 57 | 7.25 | 56 | 1 | 1 | 4.51 | 30.9 | 4.46 | 34.5 |
| L41T1.39 | NAc | 7.7 | 20 | 7.15 | 71 | NA | 0.50 | NA | 4.91 | 12.4 | ||
| I48T1.46 | 8.74 | 1.8 | 7.32 | 48 | 7.53 | 30 | 3.89 | 0.75 | 4.49 | 32.4 | 4.61 | 24.7 |
| V83L2.53 | 7.68 | 20.9 | 6.51 | 306 | 7.25 | 56 | 1.4 | .66 | 3.72 | 191.3 | ||
| I105K3.23 | 7.99 | 10.2 | NA | NA | 7.18 | 65 | 1.76 | 0.99 | 4.54 | 28.8 | NA | NA |
| F110W3.28 | 7.21 | 61.7 | 7.35 | 45 | 6.84 | 145 | 2.96 | 1.09 | 4.62 | 24 | 4.59 | 26 |
| M117F3.35 | 7.97 | 10.7 | 6.98 | 105 | 7.14 | 72 | 1.09 | 0.39 | 4.26 | 55 | 4.19 | 64.1 |
| C118S3.36 | NA | NA | 6.88 | 131 | 6.27 | 540 | NA | 0.68 | NA | 4.09 | 81.3 | |
| N124H3.42 | 6.26 | 549.5 | 7.32 | 48 | 6.95 | 111 | 1.11 | 1.06 | 4.57 | 26.9 | 4.47 | 33.9 |
| L171P4.61 | 7.23 | 58.9 | NA | NA | 7.13 | 74 | 4.46 | 1.2 | 3.91 | 123 | NA | NA |
| A188N5.37 | NA | NA | NA | NA | 6.92 | 120 | NA | 0.35 | NA | NA | NA | NA |
| I195F5.44 | 7.55 | 28.2 | NA | NA | 6.92 | 121 | 1.56 | 1.27 | 4.58 | 26.3 | NA | NA |
| Y199F5.48 | 6.78 | 166 | 6.92 | 120 | 6.99 | 102 | 5.97 | 0.35 | 4.26 | 55 | 4.29 | 50.8 |
| F202L5.51 | 6.53 | 295.1 | NA | NA | 6.33 | 467 | 1.4 | 0.44 | 4.46 | 34.7 | NA | NA |
| T205M5.54 | 8.6 | 2.5 | 8.31 | 4.9 | 7.56 | 28 | 2.57 | 1.60 | 5.39 | 4.1 | 5.66 | 2.2 |
| Y213I5.62 | 8.48 | 3.3 | NA | NA | 7.04 | 92 | 1.28 | 0.20 | 4.66 | 21.9 | NA | NA |
| L379F6.41 | NA | NA | 6.81 | 155 | NA | NA | 0.02 | 0.06 | 4.12 | 75.9 | 3.99 | 102.8 |
| N418S7.45 | NA | NA | 6.7 | 201 | 5.86 | 1385 | NA | 0.27 | NA | NA | 3.92 | 120.6 |
| Doubles | ||||||||||||
| I48T1.46/F110W3.28 | 8.06 | 8.7 | NA | NA | 6.96 | 110 | 1.47 | 0.52 | 4.48 | 33.1 | NA | NA |
| T205M5.54/L379F6.41 | 7.83 | 14.8 | NA | NA | 7.07 | 84 | 1.35 | 0.36 | 5.64 | 2.3 | NA | NA |
Mutations that have WT-like dopamine potency
Twelve of the point mutants tested, including the three negative control residues, I105K3.23, A188N5.37, and I195F5.44, had potencies similar to WT (Fig. 2, B and C; Tables 1 and 2). Of these mutants with WT-like potency, potency for V83L2.53 was more than 5-fold higher in TANGO than in Gα16 assays (22) and that for T205M was more than 3-fold lower. Dopamine potency in Gαi assays (23) was higher than in TANGO assays for WT and all mutants except for N124H3.42, for which the potency was more than 5-fold higher for TANGO, and Y199F5.48 for which potency in TANGO was ∼1.5-fold higher.
Mutations that have altered dopamine potency
Four of the point mutants had significantly reduced dopamine potencies for β-arrestin2 recruitment, F110W3.28, C118S3.36, F202L5.51, and N418S7.45. In previous assays of dopamine potency in G-protein activation assays, F202L5.51 had lower potency for Gαi (23), whereas C118S3.36 and N418S7.45 had lower potency for Gα16 activation (22). The potency of dopamine for I48T1.46 recruitment of β-arrestin2 was enhanced relative to that of WT but much lower than for Gαi activation.
T205M5.54 mutant has constitutive activity, enhanced dopamine potency, and enhanced efficacy in β-arrestin2 recruitment
The most strikingly altered dose response was observed for T205M5.54. This mutation confers β-arrestin2 recruitment activity in the absence of agonist that is even greater than the maximum agonist-stimulated activity of WT (Figs. 3, A and D, and 4), revealing a high level of constitutive activity.
Figure 4.

Bias parameters and rescue of WT behavior by second-site mutations. A and B, bias factors computed from relative activities of D2R mutants in response to dopamine for β-arrestin (β-arr) recruitment (TANGO assay, this study) and Gαi activation (membrane potential assay, Sung et al. (23)). A, equiactive comparison (40) calculated from relative Emax/EC50 values for the two assays. B, single measure bias factors calculated separately for Emax (x axis) and pEC50 (y axis). Error bars were derived from the S.E. of the two measurements using error propagation. Positive and negative values indicate bias toward β-arrestin recruitment or Gαi activation, respectively. Details of the bias factor calculations are provided under “Experimental procedures.” C–H, radar plots (generated using R) for I48T1.46 (C), F110W2.38 (D), I48T1.46/F110W2.38 (E), T205M5.54 (F), L379F6.41 (G), and T205M5.54/L379F6.41 (H) represent multiassay data after dopamine stimulation. The intersections of the lines outlining the inner magenta-shaded region with the radial axes denote WT activity, and those outlining the green-shaded regions depict activities of mutants. Data shown are as follows: Gαi pEC50; Gαi Erel; β-arrestin2 (ARRB2) pEC50; ARRB2 constitutive activity (CA); ARRB2 Erel, and dopamine (DA) binding pKi. The G-protein (G prot) and pKi data were obtained from Sung et al. (23) and Rodriguez et al. (22). All the radar plots share the same axes. The same maximum and minimum values were used for both ARRB2 and G-protein pEC50 and Erel to allow for comparison of values. The pEC50 axis origin is 6 and the outermost line corresponds to 7.8. The Erel axis origin is 0 and the outermost line is 3.9. The constitutive activity axes range from −0.03 to 1.44, and the pKi axes range from 3 to 5.7. All values are listed in Table 2.
The T205M5.54 dopamine dose-response curve has a biphasic shape (Fig. 3) that could be explained by two (or possibly more) binding sites that enhance activity. Assuming that the higher affinity site corresponds to the orthosteric site and that the plateau of activity between 10−7 and 10−6 m dopamine corresponds to saturation of this site, the total activity increase stimulated by dopamine at the orthosteric site is higher than the total activity elicited by dopamine in WT (Fig. 3, A and C, and Table 1). The total activity at this plateau, including the constitutive activity, is close to three times that of WT and 65% higher than that of WT when the constitutive activity is subtracted, indicating a dramatic increase in the ability of this mutant receptor to recruit β-arrestin2, both with and without bound dopamine. The apparent potency of dopamine at the presumed orthosteric site (see results with a competitive ligand below for caveats) is also increased, with a pEC50 value nearly 4-fold higher than that of WT (Fig. 2 and Table 1). Increased dopamine potency and efficacy for this mutant were also observed for Gαi activation; however, there was no sign of constitutive activity or a second activating site affecting G-protein activation (23).
Two mutants display reduced efficacy in β-arrestin2 recruitment by dopamine
The V83L2.53 and L379F6.41 mutations both reduced the maximal amplitudes of the responses over the concentration ranges tested. L379F6.41 was essentially nonresponsive (Fig. 3, A and D). This mutation was previously found to be nonresponsive for G-protein activation as well (22, 23), even though its ligand-binding affinity and specificity are very similar to those of WT. The potency of dopamine for L379F6.41 could not be determined due to the very low or nonexistent maximal activity level, but that of V83L2.53 was not significantly different from WT.
Quantification of bias
Although there is some danger of oversimplification in reducing multiple measurements of different components of signaling to single parameters, it can be useful for comparisons with the results from other studies to calculate them. We have employed three different measures (Fig. 4, A and B; see “Experimental procedures” for details). One, βEmax/EC50, is based on the relative ratios of Emax and EC50. It is derived from the “equiactive” comparison (40) formulated for comparing ligands and modified for comparing mutants. The other two, βEmax and βpEC50, parameterize the efficacies and potencies separately so they can be compared as points in a two-dimensional vector space. The results shown in Fig. 4, A and B, reveal diverse effects of the mutations, displaying enhanced bias toward either G-protein signaling or β-arrestin recruitment depending on both the site of mutation and the measure compared.
Paired mutations at coupled residue positions
Previously, the mutation pairs I48T1.46/F110W3.28 and T205M5.54/L379F6.41 had been shown to be co-varying in evolution and functionally coupled (23). Thr-2055.54/Leu-3796.41 are only 4 Å apart, so presumably their interactions are direct. However, Ile-481.46/Phe-1103.28 are too distant to be in direct contact, implying allosteric interactions. Of these pairs, T205M5.54/L379F6.41 is particularly interesting because the two individual mutations yielded the most dramatic phenotypes, with a striking gain–of–function for β-arrestin2 recruitment in the case of T205M5.54 and a complete loss of function in the case of L379F6.41. The results of the double mutations are shown in Fig. 4, C–H, and Table 1. The addition of the T205M5.54 swap rescued the loss of function induced by L379F6.41, resulting in a receptor variant that has similar dopamine potency as WT and a similar efficacy. For F110W3.28 and I48T1.46, the results for potency and efficacy of the single and double mutants were all within statistical uncertainty of WT values. These results contrast with observations for Gαi activation, in which F110W3.28 displayed decreased efficacy and potency, whereas I48T1.46 and the double mutant displayed greatly enhanced efficacy and potency. In that case, combining the mutations restored dopamine potency to a level intermediate between those of the individual mutants and closer to that of WT, but yielded efficacy resembling that of I48T1.46 (23). For T205M5.54, the double mutation abolished its constitutive activity, and in both cases, the double mutations eliminated the β-arrestin2 recruitment activity elicited by serotonin in the single mutants I48T1.46 and T205M5.54 (Fig. 5B). The “radar” plots in Fig. 4, C–H, depict the multidimensionality of mutation effects on signaling behavior. For example, I48T1.46 displays enhanced G-protein efficacy and potency, and it displays enhanced potency but slightly reduced efficacy for β-arrestin recruitment, without effect on its intrinsic dopamine-binding affinity. In contrast, T205M5.54 signals more strongly in both pathways by all six measures plotted.
Figure 5.

Serotonin stimulation of β-arrestin2 recruitment. A and B, example of serotonin dose-response curves. Points with error bars are means ± S.E. of technical replicates (n = 3 for mutants and 9 for WT), compared with WT treated with dopamine (DA) the same day and normalized to expression levels relative to WT from three or more independent surface-expression assays. Error bars that are not shown are smaller than the symbols. WT and mutant constructs were assayed, and the results were analyzed as in Figs. 2 and 3.
Serotonin responses
Although the residue positions for mutations were chosen according to evolutionary importance, the identities of the substitutions were chosen as the corresponding amino acid residues in the 5-HT2A receptor. Therefore, it was of interest to test whether any of the mutations altered serotonin responses, as some did with respect to G-protein activation (22, 23). In contrast to Gα16 activation, in which serotonin elicits weak but readily measurable responses from WT D2R (22), β-arrestin2 recruitment by WT D2R was not detected below 10 μm serotonin, and even at high concentrations it was very weak (Fig. 5). Only two mutants, I48T1.46 (pEC50 ± S.E., 6.27 ± 0.131, n = 4) and T205M5.54 (pEC50 ± S.E., 6.87 ± 0.082, n = 4), displayed substantial and saturable responses to serotonin. These mutants had previously shown the strongest serotonin-induced responses in G-protein activation (22, 23). These results suggest that most of the residues tested here, although important for fine tuning the sensitivity of β-arrestin2 signaling to dopamine, do not play an important role in the ligand specificity of those responses.
Responses to biased agonists and an antagonist
We measured responses (Fig. 6) of WT D2R and four of the more interesting mutants, V83L2.53, I48T1.46, L171P4.61, and T205M5.54 to two drugs with previously reported signaling biases: UNC9994, a β-arrestin–biased agonist (20), and MLS1547, a G-protein–biased agonist (41). WT D2R responded to UNC9994 in the TANGO assay as reported previously (20), with an EC50 value of 4.4 nm, in agreement with the previous report of 6.1 nm. In contrast, UNC9994 was more potent in stimulating β-arrestin2 recruitment for V83L2.53 and I48T1.46, less potent for L171P4.61 (an accurate EC50 value could not be calculated due to lack of saturation), and more efficacious for T205M5.54. Surprisingly, MLS1547 elicited robust β-arrestin2 recruitment activity in WT (about half the maximum activity observed with dopamine) and even higher responses relative to dopamine for T205M5.54 and I48T1.46. In contrast responses were much lower for V83L2.53 and nearly undetectable for L171P4.61. We also checked whether an antagonist of dopamine, previously characterized as a partial agonist and widely used as an antipsychotic, quetiapine, could block the constitutive activity or dopamine responses of the constitutively-active T205M5.54. As reported previously (42), quetiapine antagonized the β-arrestin2 recruitment activity of WT D2R. Surprisingly, it not only did not block constitutive activity, but it acted as a fairly potent agonist for T205M5.54, and actually potentiated its response to dopamine (Fig. 7), again suggesting the possibility of more than one site of agonist action on this mutant. Taken together, the results with these drugs suggest that D2R variants could lead to dramatic differences in drug responses in patients with respect to β-arrestin2 recruitment.
Figure 6.

Effects of biased ligands. A–C, responses in TANGO assay to β-arrestin–biased ligand UNC9994. D–F, responses in TANGO assay to G-protein–biased ligand MLS1547. A and D show example dose-response curves plotted as a ratio to the best-fit maximum response elicited by dopamine in parallel assays on the same day. B and E, pEC50 values. Individual points are average values for sets of three or more assays on individual days, and the bars show average over multiple days ±S.E. C and F, maximum responses normalized by dopamine responses on the same days, with both determined as best-fit values for sets of three or more titrations on individual days. Points show results for individual days, and bars show averages over multiple days ±S.E. All mutants were compared with WT using an unpaired two-tailed t test; ****, p < 0.0001; **, p < 0.001; *, p < 0.05. Responses relative to WT can be derived by comparisons to data in Fig. 3 and Table 1.
Figure 7.
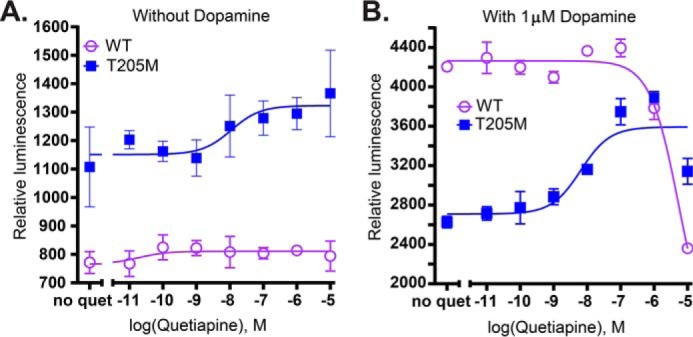
Effects of antagonist/weak partial agonist quetiapine on WT and T205M D2R. A and B, antagonist (quetiapine) TANGO dose-response curves carried out in parallel on the same day. A, no dopamine was added. B, quetiapine was added along with 10 μm dopamine. Points and error bars represent means ± S.E. of three technical replicates. Error bars that are not shown are smaller than the symbols. Raw intensity values are shown, uncorrected for surface expression levels relative to WT, which were: logSErel (± S.D.) = 0.18 ± 0.21 for T205M.
Discussion
Mutations at ET-identified residues result in perturbed β-arrestin signaling
The experiments described here were carried out to test the hypothesis that residues of evolutionary importance, as scored by the Evolutionary Trace algorithm, are important contributors of β-arrestin2 signaling as well as G-protein signaling. The observation that seven of the 14 mutations tested at positions of high ET rank had significant impacts on constitutive activity, potency, efficacy, or specificity, while none of the three mutations tested at positions of low ET rank had significant effects, supports this hypothesis.
The results also support the hypothesis that the allosteric pathways mediating G-protein activation and β-arrestin2 recruitment are distinct, albeit overlapping at some points. For example, Y213I5.62 leads to a 3-fold increase in dopamine potency for Gαi-protein activation (23), but no change in dopamine potency and a slight (and nonsignificant) decrease in dopamine efficacy for β-arrestin2 recruitment. N124H3.42, Y199F5.48, and the double mutation I48T1.46/F110W3.28 all result in substantial decreases in dopamine potency for Gαi-protein activation, of 572-, 17-, and 6-fold, respectively, whereas the potencies for β-arrestin2 recruitment do not differ significantly from that of WT. Three mutations, I48T1.46, I105K3.23, and F110W3.28, all increase G-protein activation efficacy substantially (23), but yield no significant change in efficacy for β-arrestin2 recruitment. F202L5.51 had reduced G-protein activation efficacy and potency (23), but only reduced potency for β-arrestin2 recruitment. Thus, particular mutations can have functional consequences that differ in sign or magnitude, depending on the downstream allosteric pathway. Of the 14 residues with high ET ranks whose swaps are studied here, only a subset had significant effects on β-arrestin2 recruitment, but all had detectable effects on at least one assay for β-arrestin2 recruitment, G-protein signaling, or endogenous ligand affinity/potency.
Structural basis of mutant phenotypes
The lowered dopamine potency of C118S3.36 might be explained in terms of its adjacency to the agonist-binding pocket (Fig. 8). Cys-1183.36 forms part of the risperidone-binding pocket in the D2R structure, and its mutation to alanine was found to decrease risperidone affinity significantly (43). The C118S3.36 mutant also had reduced affinity for dopamine (22). Mutations have previously been identified in the third transmembrane helix of D2R that significantly reduces β-arrestin2- (D2R A135R3.53/M140D3.58) or G-protein (D2R L125N3.43/Y133L3.51)-signaling pathways (36), and these two mutations might be disrupting coupled interactions involving TM3, which is shifted outward toward the extracellular end in the structure of constitutively-active rhodopsin bound to arrestin, as compared with inactive rhodopsin (44).
Figure 8.
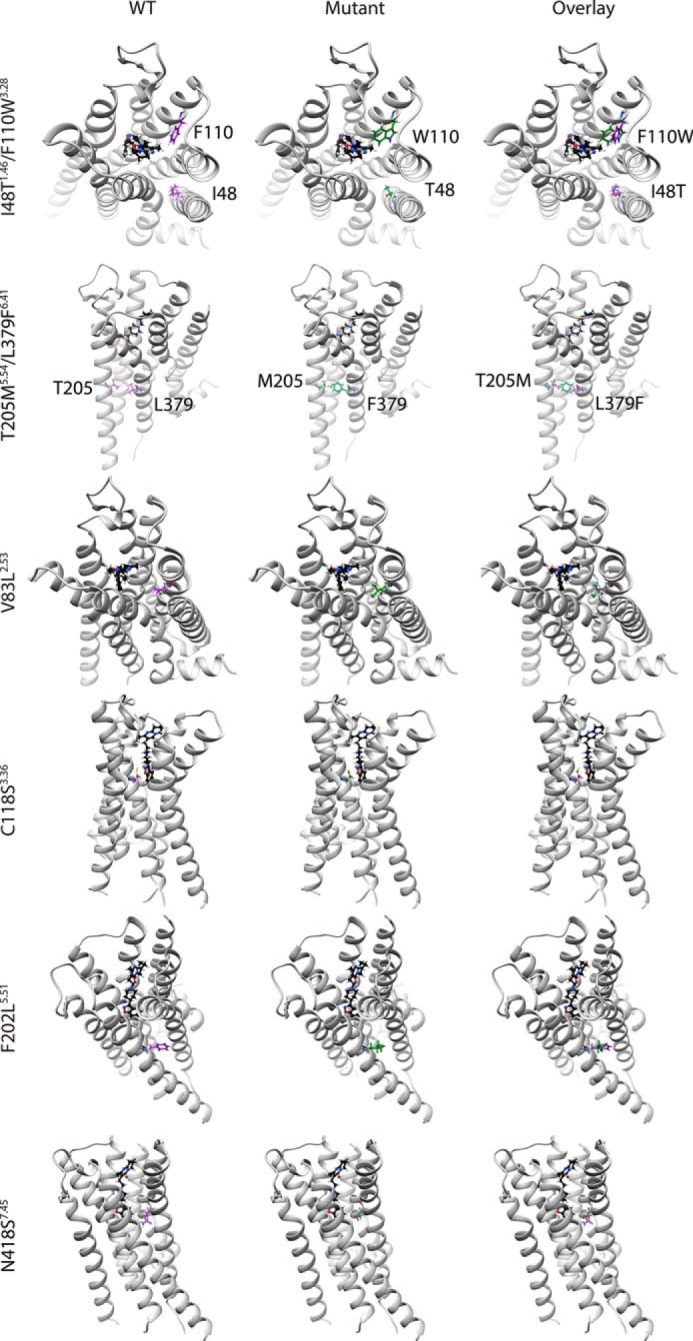
Structural comparison between WT and mutagenized residues. D2R (helices in light gray) bound to risperidone (ball and stick in black) (PDB 6CM4 (43)). The WT residues are depicted in purple, and the mutagenized residues are depicted in green. The residues depicted both before and after mutagenesis using Chimera are I48T1.46/F110W2.38, T205M5.54/L379F6.41, V83L2.53, C118S3.36, F202L5.51, and N418S7.45.
The structure of constitutively-active rhodopsin bound to arrestin compared with that of the inactive form of rhodopsin (44) reveals major shifts in TM6, and it seems likely that the large effects of L379F6.41 on efficacy are due to its interference with the TM6 conformational shift. It is intriguing that the N418S7.45 mutation affects ligand potency yet is far from the ligand-binding site in the structure. The C-terminal end of TM7 interacts with arrestin in that structure, and N418S7.45 is immediately adjacent to the break in TM7, suggesting that it might disrupt coupling between the agonist-binding site and the β-arrestin2–binding interface, leading to reduced dopamine potency through allosteric coupling. TM5 in the rhodopsin–arrestin complex is shifted outward toward the extracellular side and lengthens at the intracellular side, compared with inactive rhodopsin, and three mutations with significant alterations in dopamine potency or efficacy for β-arrestin2 recruitment are found in this helix, including the T205M5.54 mutation which leads to dramatic gain–of–function.
The double mutation T205M5.54/L379F6.41 might be altering the dynamics between TM5 (Thr-2055.54) and TM6 (Leu-3796.41), as their side chains are close (4 Å), measured as the minimum side-chain–to–side-chain distance without hydrogens, or 2.3 Å with hydrogens present, and pointing toward one another in the D2R structure. It is not surprising that replacing the polar threonine with the nonpolar methionine and leucine with the more bulky phenylalanine in this inter-helical space would be disruptive, but it is hard to understand how making both mutations simultaneously overcomes the disruption and restores near-WT function. Similar results were observed with Gαi activation, in which T205M5.54 paired with either L379F6.41 or N124H3.42 resulted in functional coupling to restore WT-like function (23).
I48T1.46, which confers serotonin responsiveness in β-arrestin2 recruitment, is roughly in the middle of TM1, which undergoes an outward shift toward the cytoplasmic end in the rhodopsin–arrestin complex. Its effects might involve proximal coupling to the agonist-binding site. It was previously reported that the mutation I48C1.46 (going from the nonpolar isoleucine to the polar cysteine) increased the Kd value for N-methylspiperone by about 2-fold, and it increased affinity for sulpiride by about the same factor, consistent with our observations of the effects of this site on ligand specificity (45). When I48T1.46 is mutated in the presence of F110W3.28, the serotonin response is lost, possibly due to compensatory effects of Phe-1103.28 at the ligand-binding pocket. Phe-1103.28 corresponds to Leu-1113.28 in the D4 receptor, which has high affinity for the agonist nemonapride, and to Phe-1103.28 in D3, which, like D2, does not (46). A mutation of the corresponding residue in rhodopsin, E113Q3.28, along with the M257Y6.40 mutation (at a position immediately adjacent to our Leu-3796.41 site), yields a constitutively active form that was used to obtain a structure of the rhodopsin–arrestin complex (44). Because threonine is at that position in 5-HT2A, it makes sense that this substitution would increase serotonin potency in D2R.
Implications for therapeutic design
Drugs that treat mood disorders and target D2R and/or 5-HT2A tend to lack effector pathway selectivity resulting in significant side effects (47–49). Our findings should help to understand the structural mechanisms in D2R that allosterically regulate effector pathway activation and signaling bias for use in rational drug design. The observation that sites well-removed from both the ligand-binding site and the cytoplasmic surface where effectors interact suggests that there are opportunities for development of biased allosteric modulators as well as for biased agonists and antagonists. Our data suggest that ET residues affect signal modulation between the β-arrestin2 and Gαi–protein pathways, and one plausible explanation could be due to signaling bias.
Experimental procedures
Cell culture
The HTLA cell line (a HEK293 cell line stably expressing a tetracycline-controlled transactivator (tTA)-dependent luciferase reporter and a β-arrestin2–TEV fusion gene) was obtained as a generous gift from the Bryan Roth lab and cultured in 10-cm plates as described (39).
D2R cloning and transfections
D2R cDNA templates (Missouri S&T cDNA Resource Center, catalog no. DRD020TN00), previously mutated and published (22, 23), were PCR-amplified utilizing KOD Hot Start DNA Polymerase and primers containing flanking ClaI restriction sites to generate D2R mutants in the TANGO backbone (Addgene catalog no. 66269) (38, 39). The resulting plasmids express a protein containing an N-terminal HA signal sequence, followed by a FLAG tag, and then D2R; at its C terminus, D2R is fused to the V2 vasopressin receptor tail, a TEV cleavage site, and the tTA transcription factor. Each D2R variant contained one or two difference ET–identified 5-HT2A residue swaps. The plasmid was expressed in HTLA cells at ∼80% confluency by transfecting 2 μg of DNA with 10 μl of Lipofectamine 2000 in a final volume of 500 μl of Opti-MEM (Thermo Fisher Scientific) per well in a 6-well plate where the cells were grown in DMEM with 10% (v/v) FBS. The cells from the 6-well plates were later collected and re-plated in 96-well plates as explained below under “TANGO and cell-ELISA.”
TANGO and cell-ELISA
We used the transcriptional activation following arrestin translocation (TANGO) assay to measure recruitment of β-arrestin2 to D2R (39). Upon recruitment of the β-arrestin2–TEV protease fusion protein, the D2R fusion will be cleaved at the TEV cleavage site, releasing tTA and promoting luciferase expression. HTLA cells transfected with TANGO constructs were trypsinized at 12–15 h after transfection in 6-well plates, resuspended in 10 ml per well of DMEM containing 1% (v/v) dialyzed FBS (Omega Scientific) with 50 units/ml penicillin and 50 μg/ml streptomycin (Lonza), and replated at 100 μl per well in a 96-well plate. Cells were allowed to adhere for 7 h and then 50 μl of 3× drug solution or vehicle control was added. Drugs used were dopamine-HCl (Sigma catalog no. H8502), UNC9994 (Axon Medchem catalog no. 2562), MLS1547 (Sigma catalog no. SML1331), and quetiapine hemifumarate salt (Sigma catalog no. Q3638). Dopamine was dissolved in H2O as 10 and 100 mm stock solutions, and all other ligands were dissolved in DMSO as 10 mm stock solutions. Final drug concentrations were 10−9, 10−8, 10−7, 10−6.5, 10−6, and 10−5 m, and in some cases 10−4.8 m, and treatments were performed in triplicate wells. The plates were removed from the 37 °C incubator 18–20 h after adding drug; wells were washed once with 200 μl of PBS and then 100 μl of BrightGlo (Promega) containing the luciferase substrate, and cell lysis reagent was added to each well. The plate was incubated for 20 min prior to starting the reading, and then luminescence was measured at 570 nm using a FlexStation III (Molecular Devices) at a standard read time per plate of ∼2 min. Surface expression for comparison of dopamine and serotonin responses was determined using a cell–ELISA protocol, as described previously (23), except that the primary antibody was rabbit anti-DYKDDDDK (Cell Signaling, catalog no. 2368), added to a final concentration of 0.257 μg/ml. Surface expression for the responses to UNC9994, MLS1547, and quetiapine was determined using a cell–ELISA protocol adapted from Refs. 23, 50. The primary antibody was mouse monoclonal anti-DYKDDDDK (Sigma, catalog no. A8592), added to a final concentration of 3.333 μg/ml.
Data analysis
For potency determinations, raw TANGO data from each experiment, including internal replicates, were fit to a single-site saturation dose-response curve: T(C) = T0 + (Tmax − T0)C/(C + EC50), where C is concentration of dopamine or serotonin; T is the TANGO chemiluminescence signal; and Tmax, T0, and EC50 are fit parameters. For the case of T205M5.54, which displayed evidence for a second site, a similar two-site binding curve, with two additional fit parameters (Tmax, 2 and EC50, 2) was also tried, and for the single-site fit, only data up to the first plateau (10−6 m) were included. Wells with no drug treatment were included in the fits and plots by assigning them a nominal concentration of 10−13 m. To facilitate visual comparison of mutants in Fig. 2, A–C, data were rescaled to the top and bottom plateaus of the curve fits. EC50 and pEC50 (−log10(EC50)) values for each mutant and WT were averaged across three or more separate experiments on different days as reported in Table 1.
For quantification of efficacy and constitutive activity, TANGO dose-response curves were normalized to internal controls from the same plate as follows. Internal replicates were averaged, and for each drug concentration the values from corresponding wells transfected with pCDNA3.1 empty vector were subtracted. Resulting data for WT D2R were then fit with a sigmoidal dose-response curve (as above), and the span between the baseline and the top plateau of that fit (Tmax) was compared with the fits for mutants on the same plate to yield E0, the relative efficacy without consideration of relative surface expression, E0 = Tmax, mut/Tmax, WT, and for constitutive activity, CA, CA0 = T0, mut/Tmax, WT. Cell–ELISA values for surface expression (SE) were normalized to internal controls from the same plate in a similar manner: SErel = (SEmut − SE0)/(SEWT − SE0), where SE is the cell–ELISA luminescence signal, and SE0 is the value for the cells transfected with the empty vector control.
The SErel values from at least three independent experiments carried out using the same plasmid constructs were averaged and used to determine the final relative efficacy and constitutive activity values corrected for differences in surface expression: Erel = E0/SErel, and CArel = CA0/SErel. These values are plotted in Fig. 3, C and D, and reported in Table 1. The sample standard deviations from averaging the Erel values across three or more independent experiments on separate days were used to calculate the standard error of the mean, which is reported as the uncertainty in Table 1. In Fig. 3, C and D, the error bars represent the standard error of the mean of all the individual experiments, and the value for each individual experiment is plotted.
For L379F6.41, which is largely unresponsive to dopamine, reliable values of EC50 and Tmax could not be obtained, so relative efficacy was calculated for each day's experiments using the values measured at 10−5 m dopamine instead of Tmax.
For testing the biased agonists UNC9994 and MLS1547, TANGO assays and cell-surface assays were carried out and analyzed as described above. For quantifying relative efficacy, the span of the best-fit curve for the TANGO signal was normalized to the span for dopamine responses carried out in parallel.
All curve fitting was carried out using the Levenberg-Marquardt algorithm for nonlinear least-squares regression as implemented in GraphPad Prism version 8. Values of pEC50 and Erel for each variant were tested for differences from WT values using a two-tailed unpaired t test; the underlying assumption is that these values reflect intrinsic properties of each variant and that the variance results from measurement uncertainties. The null hypothesis tested is that the properties for each variant are indistinguishable from those of WT within the measurement uncertainties, and the alternative hypothesis is that they are measurably different. For Erel comparisons, each value was normalized by its mean level of surface expression as compared with WT before comparison, and for those that appeared different at the p < 0.05 level, values were tested at the positive or negative extreme of the 95% confidence level for mean log(relative surface expression) and scored as significantly different only if the differences were retained when re-normalized for those surface expression values.
Bias parameters
Bias factors were calculated using the equi-active comparison method (40) adapted to compare mutants rather than ligands as shown in Equation 1,
| (Eq. 1) |
where P1 is β-arrestin recruitment; P2 is Gαi activation, and mut is the mutant of interest. To examine bias separately for different measured quantities, the following bias factors were used as shown in Equations 2 and 3,
| (Eq. 2) |
and
| (Eq. 3) |
Radar plots
Web representations (51) were used to compare the effect each mutation has in terms of preference for the Gαi effector pathway (22, 23) versus the β-arrestin2 effector pathway. Plots were generated using the package fmsb in R.
Molecular graphics
These were generated from the referenced PDB files using Chimera version 1.11.2 as seen in Figs. 1 and 6.
Author contributions
M. E. T.-D., O. L., and T. G. W. conceptualization; M. E. T.-D., S. J. W., M. A. A., O. L., and T. G. W. formal analysis; M. E. T.-D., M. A. A., O. L., and T. G. W. supervision; M. E. T.-D., O. L., and T. G. W. funding acquisition; M. E. T.-D., S. J. W., and M. A. A. investigation; M. E. T.-D., S. J. W., and M. A. A. methodology; M. E. T.-D. and T. G. W. project administration; M. E. T.-D., S. J. W., M. A. A., O. L., and T. G. W. writing-review and editing; S. J. W. and M. A. A. validation; M. E. T. and T. G. W. writing-original draft.
Acknowledgments
The HTLA cell line was a gift from Dr. Bryan Roth laboratory. Dr. Hye Jin Kang provided protocols and guidance throughout the process of implementing and troubleshooting the TANGO assay. We also thank Dr. Andrés S. Benítez-Cárdenas for helpful comments on data handling and the manuscript.
This work was supported by National Institutes of Health Grants R01-GM66099 (to O. L.) and R01-EY025218, R01-EY26545, and R01-EY007891 (to T. G. W.) and by Welch Foundation Grant Q0035. The authors declare that they have no conflicts of interest with the contents of this article. The content is solely the responsibility of the authors and does not necessarily represent the official views of the National Institutes of Health.
- GPCR
- G-protein–coupled receptor
- 5-HT2A
- 5-HT2A serotonin receptor
- D2R
- D2 dopamine
- ET
- evolutionary trace
- ET-Mip
- coupling algorithm integrating mutual information and evolutionary trace
- TANGO
- transcription/luminescence-based assay for β-arrestin2 recruitment
- PDB
- Protein Data Bank
- DMEM
- Dulbecco's modified Eagle's medium
- FBS
- fetal bovine serum
- TEV
- tobacco etch virus
- tTA
- tetracycline-controlled transactivator
- CA
- constitutive activity.
References
- 1. Emamian E. S. (2012) AKT/GSK3 signaling pathway and schizophrenia. Front. Mol. Neurosci. 5, 33 10.3389/fnmol.2012.00033 [DOI] [PMC free article] [PubMed] [Google Scholar]
- 2. Schmid C. L., Streicher J. M., Meltzer H. Y., and Bohn L. M. (2014) Clozapine acts as an agonist at serotonin 2A receptors to counter MK-801–induced behaviors through a β-arrestin2–independent activation of Akt. Neuropsychopharmacology 39, 1902–1913 10.1038/npp.2014.38 [DOI] [PMC free article] [PubMed] [Google Scholar]
- 3. Deslauriers J., Desmarais C., Sarret P., and Grignon S. (2013) α-Lipoic acid interaction with dopamine D2 receptor-dependent activation of the Akt/GSK-3β signaling pathway induced by antipsychotics: potential relevance for the treatment of schizophrenia. J. Mol. Neurosci. 50, 134–145 10.1007/s12031-012-9884-4 [DOI] [PubMed] [Google Scholar]
- 4. Beaulieu J. M., Sotnikova T. D., Marion S., Lefkowitz R. J., Gainetdinov R. R., and Caron M. G. (2005) An Akt/β-arrestin2/PP2A signaling complex mediates dopaminergic neurotransmission and behavior. Cell 122, 261–273 10.1016/j.cell.2005.05.012 [DOI] [PubMed] [Google Scholar]
- 5. Beaulieu J. M., Del'guidice T., Sotnikova T. D., Lemasson M., and Gainetdinov R. R. (2011) Beyond cAMP: the regulation of Akt and GSK3 by dopamine receptors. Front. Mol. Neurosci. 4, 38 10.3389/fnmol.2011.00038 [DOI] [PMC free article] [PubMed] [Google Scholar]
- 6. Beaulieu J. M., and Gainetdinov R. R. (2011) The physiology, signaling, and pharmacology of dopamine receptors. Pharmacol. Rev. 63, 182–217 10.1124/pr.110.002642 [DOI] [PubMed] [Google Scholar]
- 7. Shukla A. K., Xiao K., and Lefkowitz R. J. (2011) Emerging paradigms of β-arrestin-dependent seven transmembrane receptor signaling. Trends Biochem. Sci. 36, 457–469 10.1016/j.tibs.2011.06.003 [DOI] [PMC free article] [PubMed] [Google Scholar]
- 8. Woo A. Y., Ge X. Y., Pan L., Xing G., Mo Y. M., Xing R. J., Li X. R., Zhang Y. Y., Wainer I. W., Cheng M. S., and Xiao R. P. (2019) Discovery of β-arrestin-biased β2-adrenoceptor agonists from 2-amino-2-phenylethanol derivatives. Acta Pharmacol. Sin. 40, 1095–1105 10.1038/s41401-018-0200-x [DOI] [PMC free article] [PubMed] [Google Scholar]
- 9. Weiss D. R., Karpiak J., Huang X. P., Sassano M. F., Lyu J., Roth B. L., and Shoichet B. K. (2018) Selectivity challenges in docking screens for GPCR targets and antitargets. J. Med. Chem. 61, 6830–6845 10.1021/acs.jmedchem.8b00718 [DOI] [PMC free article] [PubMed] [Google Scholar]
- 10. Xu R., Hranilovic D., Fetsko L. A., Bucan M., and Wang Y. (2002) Dopamine D2S and D2L receptors may differentially contribute to the actions of antipsychotic and psychotic agents in mice. Mol. Psychiatry 7, 1075–1082 10.1038/sj.mp.4001145 [DOI] [PubMed] [Google Scholar]
- 11. Schrader J. M., Irving C. M., Octeau J. C., Christian J. A., Aballo T. J., Kareemo D. J., Conti J., Camberg J. L., Lane J. R., Javitch J. A., and Kovoor A. (2019) The differential actions of clozapine and other antipsychotic drugs on the translocation of dopamine D2 receptors to the cell-surface. J. Biol. Chem. 294, 5604–5615 10.1074/jbc.RA118.004682 [DOI] [PMC free article] [PubMed] [Google Scholar]
- 12. Dolgin E. (2018) First GPCR-directed antibody passes approval milestone. Nat. Rev. Drug Discov. 17, 457–459 10.1038/nrd.2018.103 [DOI] [PubMed] [Google Scholar]
- 13. Urs N. M., Gee S. M., Pack T. F., McCorvy J. D., Evron T., Snyder J. C., Yang X., Rodriguiz R. M., Borrelli E., Wetsel W. C., Jin J., Roth B. L., O'Donnell P., and Caron M. G. (2016) Distinct cortical and striatal actions of a β-arrestin-biased dopamine D2 receptor ligand reveal unique antipsychotic-like properties. Proc. Natl. Acad. Sci. U.S.A. 113, E8178–E8186 10.1073/pnas.1614347113 [DOI] [PMC free article] [PubMed] [Google Scholar]
- 14. Qin S., Meng M., Yang D., Bai W., Lu Y., Peng Y., Song G., Wu Y., Zhou Q., Zhao S., Huang X., McCorvy J. D., Cai X., Dai A., Roth B. L., et al. (2018) High-throughput identification of G protein-coupled receptor modulators through affinity mass spectrometry screening. Chem. Sci. 9, 3192–3199 10.1039/C7SC04698G [DOI] [PMC free article] [PubMed] [Google Scholar]
- 15. Tsai S. J. (2004) Dopamine receptor down-regulation: an alternative strategy for schizophrenia treatment. Med. Hypotheses 63, 1047–1050 10.1016/j.mehy.2004.04.012 [DOI] [PubMed] [Google Scholar]
- 16. Lemos A., Melo R., Preto A. J., Almeida J. G., Moreira I. S., and Dias Soeiro Cordeiro M. N. (2018) In silico studies targeting G-protein coupled receptors for drug research against Parkinson's disease. Curr. Neuropharmacol. 16, 786–848 10.2174/1570159X16666180308161642 [DOI] [PMC free article] [PubMed] [Google Scholar]
- 17. Chen R., McIntosh S., Hemby S. E., Sun H., Sexton T., Martin T. J., and Childers S. R. (2018) High and low doses of cocaine intake are differentially regulated by dopamine D2 receptors in the ventral tegmental area and the nucleus accumbens. Neurosci. Lett. 671, 133–139 10.1016/j.neulet.2018.02.026 [DOI] [PMC free article] [PubMed] [Google Scholar]
- 18. Ma T., Cheng Y., Roltsch Hellard E., Wang X., Lu J., Gao X., Huang C. C. Y., Wei X. Y., Ji J. Y., and Wang J. (2018) Bidirectional and long-lasting control of alcohol-seeking behavior by corticostriatal LTP and LTD. Nat. Neurosci. 21, 373–383 10.1038/s41593-018-0081-9 [DOI] [PMC free article] [PubMed] [Google Scholar]
- 19. Smith M. A., Fronk G. E., Abel J. M., Lacy R. T., Bills S. E., and Lynch W. J. (2018) Resistance exercise decreases heroin self-administration and alters gene expression in the nucleus accumbens of heroin-exposed rats. Psychopharmacology 235, 1245–1255 10.1007/s00213-018-4840-9 [DOI] [PMC free article] [PubMed] [Google Scholar]
- 20. Allen J. A., Yost J. M., Setola V., Chen X., Sassano M. F., Chen M., Peterson S., Yadav P. N., Huang X. P., Feng B., Jensen N. H., Che X., Bai X., Frye S. V., Wetsel W. C., et al. (2011) Discovery of β-arrestin-biased dopamine D2 ligands for probing signal transduction pathways essential for antipsychotic efficacy. Proc. Natl. Acad. Sci. U.S.A. 108, 18488–18493 10.1073/pnas.1104807108 [DOI] [PMC free article] [PubMed] [Google Scholar]
- 21. Rose S. J., Pack T. F., Peterson S. M., Payne K., Borrelli E., and Caron M. G. (2018) Engineered D2R variants reveal the balanced and biased contributions of G-protein and β-arrestin to dopamine-dependent functions. Neuropsychopharmacology 43, 1164–1173 10.1038/npp.2017.254 [DOI] [PMC free article] [PubMed] [Google Scholar]
- 22. Rodriguez G. J., Yao R., Lichtarge O., and Wensel T. G. (2010) Evolution-guided discovery and recoding of allosteric pathway specificity determinants in psychoactive bioamine receptors. Proc. Natl. Acad. Sci. U.S.A. 107, 7787–7792 10.1073/pnas.0914877107 [DOI] [PMC free article] [PubMed] [Google Scholar]
- 23. Sung Y. M., Wilkins A. D., Rodriguez G. J., Wensel T. G., and Lichtarge O. (2016) Intramolecular allosteric communication in dopamine D2 receptor revealed by evolutionary amino acid covariation. Proc. Natl. Acad. Sci. U.S.A. 113, 3539–3544 10.1073/pnas.1516579113 [DOI] [PMC free article] [PubMed] [Google Scholar]
- 24. Podder A., Pandey D., and Latha N. (2016) Investigating the structural impact of S311C mutation in DRD2 receptor by molecular dynamics and docking studies. Biochimie 123, 52–64 10.1016/j.biochi.2016.01.011 [DOI] [PubMed] [Google Scholar]
- 25. Yang Z., Yang F., Zhang D., Liu Z., Lin A., Liu C., Xiao P., Yu X., and Sun J. P. (2017) Phosphorylation of G protein–coupled receptors: from the barcode hypothesis to the flute model. Mol. Pharmacol. 92, 201–210 10.1124/mol.116.107839 [DOI] [PubMed] [Google Scholar]
- 26. Sinmaz N., Tea F., Pilli D., Zou A., Amatoury M., Nguyen T., Merheb V., Ramanathan S., Cooper S. T., Dale R. C., and Brilot F. (2016) Dopamine-2 receptor extracellular N terminus regulates receptor surface availability and is the target of human pathogenic antibodies from children with movement and psychiatric disorders. Acta Neuropathol. Commun. 4, 126 10.1186/s40478-016-0397-1 [DOI] [PMC free article] [PubMed] [Google Scholar]
- 27. de Graaf C., Foata N., Engkvist O., and Rognan D. (2008) Molecular modeling of the second extracellular loop of G-protein coupled receptors and its implication on structure-based virtual screening. Proteins 71, 599–620 10.1002/prot.21724 [DOI] [PubMed] [Google Scholar]
- 28. Cho D. I., Zheng M., Min C., Kwon K. J., Shin C. Y., Choi H. K., and Kim K. M. (2013) ARF6 and GASP-1 are post-endocytic sorting proteins selectively involved in the intracellular trafficking of dopamine D(2) receptors mediated by GRK and PKC in transfected cells. Br. J. Pharmacol. 168, 1355–1374 10.1111/bph.12025 [DOI] [PMC free article] [PubMed] [Google Scholar]
- 29. Ding X., Zhao X., and Watts A. (2013) G-protein–coupled receptor structure, ligand binding and activation as studied by solid-state NMR spectroscopy. Biochem. J. 450, 443–457 10.1042/BJ20121644 [DOI] [PubMed] [Google Scholar]
- 30. Bhattacharya S., Hall S. E., and Vaidehi N. (2008) Agonist-induced conformational changes in bovine rhodopsin: insight into activation of G-protein-coupled receptors. J. Mol. Biol. 382, 539–555 10.1016/j.jmb.2008.06.084 [DOI] [PubMed] [Google Scholar]
- 31. Draper-Joyce C. J., Verma R. K., Michino M., Shonberg J., Kopinathan A., Klein Herenbrink C., Scammells P. J., Capuano B., Abramyan A. M., Thal D. M., Javitch J. A., Christopoulos A., Shi L., and Lane J. R. (2018) The action of a negative allosteric modulator at the dopamine D2 receptor is dependent upon sodium ions. Sci. Rep. 8, 1208 10.1038/s41598-018-19642-1 [DOI] [PMC free article] [PubMed] [Google Scholar]
- 32. Sowa M. E., He W., Wensel T. G., and Lichtarge O. (2000) A regulator of G protein signaling interaction surface linked to effector specificity. Proc. Natl. Acad. Sci. U.S.A. 97, 1483–1488 10.1073/pnas.030409597 [DOI] [PMC free article] [PubMed] [Google Scholar]
- 33. Yao H., Kristensen D. M., Mihalek I., Sowa M. E., Shaw C., Kimmel M., Kavraki L., and Lichtarge O. (2003) An accurate, sensitive, and scalable method to identify functional sites in protein structures. J. Mol. Biol. 326, 255–261 10.1016/S0022-2836(02)01336-0 [DOI] [PubMed] [Google Scholar]
- 34. Madabushi S., Gross A. K., Philippi A., Meng E. C., Wensel T. G., and Lichtarge O. (2004) Evolutionary trace of G protein-coupled receptors reveals clusters of residues that determine global and class-specific functions. J. Biol. Chem. 279, 8126–8132 10.1074/jbc.M312671200 [DOI] [PubMed] [Google Scholar]
- 35. Shenoy S. K., Drake M. T., Nelson C. D., Houtz D. A., Xiao K., Madabushi S., Reiter E., Premont R. T., Lichtarge O., and Lefkowitz R. J. (2006) β-Arrestin–dependent, G protein-independent ERK1/2 activation by the β2 adrenergic receptor. J. Biol. Chem. 281, 1261–1273 10.1074/jbc.M506576200 [DOI] [PubMed] [Google Scholar]
- 36. Peterson S. M., Pack T. F., Wilkins A. D., Urs N. M., Urban D. J., Bass C. E., Lichtarge O., and Caron M. G. (2015) Elucidation of G-protein and β-arrestin functional selectivity at the dopamine D2 receptor. Proc. Natl. Acad. Sci. U.S.A. 112, 7097–7102 10.1073/pnas.1502742112 [DOI] [PMC free article] [PubMed] [Google Scholar]
- 37. Kang H. J., Wilkins A. D., Lichtarge O., and Wensel T. G. (2015) Determinants of endogenous ligand specificity divergence among metabotropic glutamate receptors. J. Biol. Chem. 290, 2870–2878 10.1074/jbc.M114.622233 [DOI] [PMC free article] [PubMed] [Google Scholar]
- 38. Barnea G., Strapps W., Herrada G., Berman Y., Ong J., Kloss B., Axel R., and Lee K. J. (2008) The genetic design of signaling cascades to record receptor activation. Proc. Natl. Acad. Sci. U.S.A. 105, 64–69 10.1073/pnas.0710487105 [DOI] [PMC free article] [PubMed] [Google Scholar]
- 39. Kroeze W. K., Sassano M. F., Huang X. P., Lansu K., McCorvy J. D., Giguère P. M., Sciaky N., and Roth B. L. (2015) PRESTO–Tango as an open-source resource for interrogation of the druggable human GPCRome. Nat. Struct. Mol. Biol. 22, 362–369 10.1038/nsmb.3014 [DOI] [PMC free article] [PubMed] [Google Scholar]
- 40. Rajagopal S., Ahn S., Rominger D. H., Gowen-MacDonald W., Lam C. M., Dewire S. M., Violin J. D., and Lefkowitz R. J. (2011) Quantifying ligand bias at seven-transmembrane receptors. Mol. Pharmacol. 80, 367–377 [DOI] [PMC free article] [PubMed] [Google Scholar]
- 41. Free R. B., Chun L. S., Moritz A. E., Miller B. N., Doyle T. B., Conroy J. L., Padron A., Meade J. A., Xiao J., Hu X., Dulcey A. E., Han Y., Duan L., Titus S., Bryant-Genevier M., et al. (2014) Discovery and characterization of a G protein-biased agonist that inhibits β-arrestin recruitment to the D2 dopamine receptor. Mol. Pharmacol. 86, 96–105 10.1124/mol.113.090563 [DOI] [PMC free article] [PubMed] [Google Scholar]
- 42. Masri B., Salahpour A., Didriksen M., Ghisi V., Beaulieu J. M., Gainetdinov R. R., and Caron M. G. (2008) Antagonism of dopamine D2 receptor/β-arrestin2 interaction is a common property of clinically effective antipsychotics. Proc. Natl. Acad. Sci. U.S.A. 105, 13656–13661 10.1073/pnas.0803522105 [DOI] [PMC free article] [PubMed] [Google Scholar]
- 43. Wang S., Che T., Levit A., Shoichet B. K., Wacker D., and Roth B. L. (2018) Structure of the D2 dopamine receptor bound to the atypical antipsychotic drug risperidone. Nature 555, 269–273 10.1038/nature25758 [DOI] [PMC free article] [PubMed] [Google Scholar]
- 44. Kang Y., Zhou X. E., Gao X., He Y., Liu W., Ishchenko A., Barty A., White T. A., Yefanov O., Han G. W., Xu Q., de Waal P. W., Ke J., Tan M. H., Zhang C., et al. (2015) Crystal structure of rhodopsin bound to arrestin by femtosecond X-ray laser. Nature 523, 561–567 10.1038/nature14656 [DOI] [PMC free article] [PubMed] [Google Scholar]
- 45. Shi L., Simpson M. M., Ballesteros J. A., and Javitch J. A. (2001) The first transmembrane segment of the dopamine D2 receptor: accessibility in the binding-site crevice and position in the transmembrane bundle. Biochemistry 40, 12339–12348 10.1021/bi011204a [DOI] [PubMed] [Google Scholar]
- 46. Wang S., Wacker D., Levit A., Che T., Betz R. M., McCorvy J. D., Venkatakrishnan A. J., Huang X. P., Dror R. O., Shoichet B. K., and Roth B. L. (2017) D4 dopamine receptor high-resolution structures enable the discovery of selective agonists. Science 358, 381–386 10.1126/science.aan5468 [DOI] [PMC free article] [PubMed] [Google Scholar]
- 47. You H., Mariani L. L., Mangone G., Le Febvre de Nailly D., Charbonnier-Beaupel F., and Corvol J. C. (2018) Molecular basis of dopamine replacement therapy and its side effects in Parkinson's disease. Cell Tissue Res. 373, 111–135 10.1007/s00441-018-2813-2 [DOI] [PubMed] [Google Scholar]
- 48. Takaki M., Kodama M., Mizuki Y., Kawai H., Yoshimura B., Kishimoto M., Sakamoto S., Okahisa Y., and Yamada N. (2018) Effects of the antipsychotics haloperidol, clozapine, and aripiprazole on the dendritic spine. Eur. Neuropsychopharmacol. 28, 610–619 10.1016/j.euroneuro.2018.03.004 [DOI] [PubMed] [Google Scholar]
- 49. Kim S., Zavitsanou K., Gurguis G., and Webster M. J. (2012) Neuropathology markers and pathways associated with molecular targets for antipsychotic drugs in postmortem brain tissues: exploration of drug targets through the Stanley Neuropathology Integrative Database. Eur. Neuropsychopharmacol. 22, 683–694 10.1016/j.euroneuro.2012.01.010 [DOI] [PubMed] [Google Scholar]
- 50. Schönegge A. M., Gallion J., Picard L. P., Wilkins A. D., Le Gouill C., Audet M., Stallaert W., Lohse M. J., Kimmel M., Lichtarge O., and Bouvier M. (2017) Evolutionary action and structural basis of the allosteric switch controlling β2AR functional selectivity. Nat. Commun. 8, 2169 10.1038/s41467-017-02257-x [DOI] [PMC free article] [PubMed] [Google Scholar]
- 51. Costa-Neto C. M., Parreiras-E-Silva L. T., and Bouvier M. (2016) A pluridimensional view of biased agonism. Mol. Pharmacol. 90, 587–595 10.1124/mol.116.105940 [DOI] [PubMed] [Google Scholar]