

Abstract
Manganese supports numerous neuronal functions but in excess is neurotoxic. Consequently, regulation of manganese flux at the blood–brain barrier (BBB) is critical to brain homeostasis. However, the molecular pathways supporting the transcellular trafficking of divalent manganese ions within the microvascular capillary endothelial cells (BMVECs) that constitute the BBB have not been examined. In this study, we have determined that ZIP8 and ZIP14 (Zrt- and Irt-like proteins 8 and 14) support Mn2+ uptake by BMVECs and that neither DMT1 nor an endocytosis-dependent pathway play any significant role in Mn2+ uptake. Specifically, siRNA-mediated knockdown of ZIP8 and ZIP14 coincided with a decrease in manganese uptake, and kinetic analyses revealed that manganese uptake depends on pH and bicarbonate and is up-regulated by lipopolysaccharide, all biochemical markers of ZIP8 or ZIP14 activity. Mn2+ uptake also was associated with cell-surface membrane presentation of ZIP8 and ZIP14, as indicated by membrane protein biotinylation. Importantly, surface ZIP8 and ZIP14 biotinylation and Mn2+-uptake experiments together revealed that these transporters support manganese uptake at both the apical, blood and basal, brain sides of BMVECs. This indicated that in the BMVECs of the BBB, these two transporters support a bidirectional Mn2+ flux. We conclude that BMVECs play a critical role in controlling manganese homeostasis in the brain.
Keywords: brain metabolism, manganese, transport metal, endothelial cell, trafficking, blood brain barrier, brain microvascular endothelial cells, metal homeostasis, ZIP14, ZIP8
Introduction
Manganese is an essential nutrient utilized as a cofactor for various enzymes, e.g. glutamine synthetase, superoxide dismutase, and glycosyltransferases (1). However, imbalance in manganese homeostasis caused by environmental overexposure or dysregulation of manganese trafficking has been correlated with a variety of neuropathologies. Overexposure can lead to manganese deposits in the basal ganglia, the region responsible for voluntary muscle coordination resulting in manganism, hypermanganesemia, and Parkinson's disease (2). Manganese overload at the cellular level promotes lipid, protein, and DNA oxidation and induces mitochondrial stress (3). Clinical investigations have identified patient mutations in putative manganese transport proteins, providing clues to some of the proteins involved in maintaining normal manganese levels (4–8). However, how these proteins function in the management of manganese within specific organs and cell types has not been fully elucidated. The goal of the research described herein was to identify the transport proteins involved in Mn2+ uptake in the brain microvascular endothelial cells that form the barrier between the circulation and the brain's interstitium.
The molecular mechanisms by which manganese enters into the brain from the systemic circulation have not been well-characterized. Crossgrove et al. (9, 10) examined the general features of manganese uptake via perfusion studies in isolated brains. These authors demonstrated that the rate of manganese transfer from the blood into the brain was faster than could be described by simple diffusion; they demonstrated also that Mn2+, Mn2+-citrate, and Mn3+-transferrin were all substrates for the accumulation of brain manganese. Fitsanakis et al. (11) observed that manganese accumulation in rat BMVECs2 was influenced by temperature and pH, was energy-dependent, and was inhibited by other divalent metal ions. In this work we identify those proteins responsible for Mn2+ uptake into the brain, demonstrate their membrane presentation, and examine factors that modulate their activity in Mn2+ uptake.
The blood–brain barrier is a highly selective barrier, primarily composed of brain microvascular endothelial cells surrounded by a basement membrane and pericytes, which regulate microvessel blood flow. BMVECs are also in direct contact with astrocyte end-feet and neurons within the brain parenchyma. Unlike most blood vessels in the body, brain capillaries are deprived of fenestrations; rather, BMVEC form tight junctions much like those formed by epithelial cells facing the intestinal lumen (12). Thus, nutrients entering the brain from the blood must do so by transcellular-mediated uptake and efflux (13). Significantly, little attention has been paid to the alternative trajectory, from the basal, abluminal space into the apical, blood side of this barrier.
Under normal conditions, manganese levels in the blood range from 4 to 15 μg/liter or 75 to 300 nm (14). Divalent manganese is bound to small ligands such as HCO3− and citrate and loosely bound to larger proteins like albumin and macroglobulin (15). Trivalent manganese complexes with pyrophosphate or transferrin as chelating agents are found, also; the latter supports receptor-mediated uptake of Mn3+ (16, 17). A number of membrane proteins have been implicated in cellular Mn2+ uptake in mammalian cells, including the citrate shuttle, plasma membrane calcium channels, DMT1 (divalent metal transporter 1), ZIP8 (solute carrier family 39 member 8, SLC39A8), and ZIP14 (solute carrier family 39 member 14, SLC39A14); the latter three are known to be promiscuous divalent metal importers (18). As noted, manganic transferrin is transported into/out of mammalian cells via the transferrin receptor utilizing clatherin-coated endosomes. Mn3+-transferrin is unlikely to be a predominant manganese species in the brain because rat perfusion studies and neuronal cell uptake assays suggest that the rate of Mn3+-transferrin uptake is much slower than that of the uptake of Mn2+ species (9, 16). This study focuses on the molecular mechanism of Mn2+ uptake by BMVECs. We previously illustrated that DMT1 is expressed by the brain microvasculature but appeared to play little role in the transport of non–transferrin-bound iron (19). DMT1 is a proton/divalent cation transporter, which functions optimally at pH 5.5 (20–22). On the other hand, the ZIP family proteins, ZIP8 and ZIP14, which have been implicated in manganese uptake (8, 23–30), function optimally at pH 7.5 and are suggested to be HCO3−/divalent cation symporters (29, 30). We have taken advantage of these functional characteristics to implicate the two ZIP transporters and not DMT1 in Mn2+ uptake into human BMVECs (hBMVECs).
Our work takes advantage of a well-established in vitro blood–brain barrier model composed of an immortalized human-derived cell line of brain microvascular endothelial cells grown in monolayers or polarized in Transwell inserts (19). We followed manganese transport at normal physiologic concentrations (100–200 nm) and manipulated conditions of manganese acquisition by these endothelial cells to interrogate the protein(s) responsible. Mn2+ uptake is enhanced at basic pH values, by LPS treatment and by increasing HCO3− concentrations, behaviors that support the premise that ZIP8 and/or ZIP14 and not DMT1 function in Mn2+ accumulation by hBMVECs. Treatment with Dynasore, an inhibitor of clatherin-dependent endocytosis (31, 32), Fe2+, or Mn2+ enhances cell-surface localization of ZIP14 but not ZIP8; the effect of Fe2+ and Mn2+ indicates that ZIP14 recycling at the plasma membrane is regulated by the transporter's ligands. Knockdown of ZIP8 and/or ZIP14 by siRNA reduces Mn2+ accumulation in hBMVECs at both the apical (luminal-facing) and basolateral (abluminal-facing) membranes, indicating that ZIP8 and ZIP14 function in Mn2+ accumulation by hBMVECs at both membranes in these polarized cells. In confirmation of this premise, cell-surface biotinylation experiments in Transwells reveal that ZIP8 and ZIP14 reside on both the apical and basolateral surfaces of hBMVECs and that Mn2+ uptake at those two membranes correlates with their occupancy. In summary, these data suggest that ZIP8 and ZIP14 are functional Mn2+ importers at the blood and brain interfaces of the brain's capillary bed.
Results
The kinetic profile of Mn2+ accumulation in brain microvascular endothelial cells
The predominant species of manganese in the brain is in the divalent form (9, 33). Therefore, we monitored the accumulation of Mn2+ in hBMVECs utilizing 54Mn2+ as radiotracer with the objective of characterizing the kinetic profiles of uptake and efflux. 54Mn2+ uptake in hBMVEC monolayers was linear between 10 and 60 min at a rate of 0.125 ± 0.013 pmol/mg/min. From 3 to 24 h, the rate of 54Mn2+ accumulation was 0.022 ± 0.001 pmol/mg/min (Fig. 1, A and B).
Figure 1.

54Mn2+ accumulation by hBMVECs is biphasic and does not proceed via an endocytosis pathway. hBMVECs were incubated with 100 nm 54Mn2+ at 37 °C for 10–60 min (A) and for 0–30 h (B). The initial velocity of 54Mn2+ accumulation was calculated for the first hour of 54Mn2+ to be 0.125 ± 0.013 pmol/mg protein/min. The velocity of 54Mn2+ accumulation from 3 to 24 h was 0.0224 ± 0.001 pmol/mg/min. The data are means ± S.D., with n ≥ 4 experimental replicates/time point. hBMVECs were loaded with 100 nm 54Mn2+ for 24 h and then incubated in efflux medium at 37 °C for 0–3 h (C). The velocity of 54Mn2+ efflux from 0 to 3 h was 0.049 ± 0.006 pmol/mg/min. hBMVECs were pretreated with 80 μm Dynasore in DMSO (D, open squares) or DMSO alone (D, closed circles) for 30 min prior to loading for 1 or 3 h with 100 nm 54Mn2+, with n = 6 experimental replicates/sample. Statistical significance was provided by an unpaired t test. ****, p < 0.0001.
These data suggest that Mn2+ uptake in hBMVECs was biphasic; another interpretation of the data is that the apparent slower accumulation at the later time was due to competing Mn2+ efflux. To test this premise, we investigated the kinetics of Mn2+ efflux. hBMVECs grown in monolayers were incubated with 100 nm 54Mn2+ for 24 h. After washing, 54Mn2+ efflux was quantified. Efflux was linear at a rate of 0.049 ± 0.006 pmol/mg/min (Fig. 1C). We conclude that during uptake, cell [Mn2+] reaches a level that supports efflux sufficient to reduce the net uptake measured. This interpretation leads to the prediction that Mn2+ accumulation by hBMVECs would reach a steady state. The uptake data shown in Fig. 1B indicate this condition was reached between 24 and 30 h.
To test whether 54Mn2+ accumulation in hBMVECs was supported by a bulk, endocytic mechanism versus a carrier-mediated one, we utilized a well-recognized inhibitor of clatherin-coated endocytosis, Dynasore (32, 34). In fact, pretreatment with 80 μm Dynasore enhanced manganese uptake in hBMVECs compared with the DMSO vehicle (Fig. 1D). This finding is consistent with the premise that by reducing membrane protein retrograde recovery, Dynasore treatment increases the lifetime of a Mn2+ transporter(s) on the plasma membrane.
Mn2+ uptake is influenced by pH, LPS, and HCO3−
To help identify this transporter(s), we took advantage of the differential biochemical regulators of the known divalent metal ion transporters (18). Thus, we examined the effects of pH, LPS, and HCO3− on Mn2+ uptake in hBMVECs. As noted, DMT1 functions optimally at pH 5.5, whereas ZIP8 and ZIP14 function best at pH 7.5 (8, 22, 24, 25). Using HEPES buffers (11) ranging from pH 6.2 to 7.8, we demonstrated that 54Mn2+ accumulation exhibited an ascending pH-rate profile with an increase in uptake of 25-fold over this pH range (Fig. 2A). In addition, we examined Mn2+ uptake by hBMVECs pretreated with LPS, a pro-inflammatory endotoxin. LPS-treated macrophages and hepatocytes exhibit an increased expression of ZIP8 and ZIP14, respectively (35, 36). We found that LPS enhanced Mn2+ accumulation compared with untreated cells (Fig. 2B). Last, the transport function of ZIP8 and ZIP14 depends on the presence of HCO3− (24, 25). Thus, we added varying amounts of HCO3− to HBSS uptake buffer and observed a direct relationship between the concentration of extracellular HCO3− and hBMVEC 54Mn2+ accumulation (Fig. 2C). Note that in contrast to the 54Mn2+ uptake in the absence of HCO3− illustrated in Fig. 1A, in the experiment in Fig. 2C, a different loading medium was used. To control for carbonate, HBSS was the loading buffer used in Fig. 2C, whereas RPMI 1640 plus serum growth medium was used in Fig. 1. Collectively, the results presented in Fig. 2 support the conclusion that ZIP8 and/or ZIP14 likely make(s) a majority contribution to Mn2+ accumulation by hBMVECs, whereas DMT1 does not. Based on these findings we sought direct evidence that one or both of these two transporters were primarily responsible for divalent manganese uptake by hBMVECs. In addition, we tested the novel premise that these proteins supported Mn2+ accumulation at both the apical and basal membranes of these polarized endothelial cells.
Figure 2.

54Mn2+ accumulation by hBMVECs is pH-, LPS-, and HCO3−-dependent. hBMVECs were loaded with 100 nm 54Mn2+ for 1 h in HEPES buffers (11) with pH ranging from 6.2 to 7.8 (A). Statistical significance was tested by Tukey's multiple comparison test (n = 3 experimental replicates/pH). *, significant difference compared with pH 6.2; ***, p < 0.001; ∼, significant difference compared with pH 6.8; ∼∼, p < 0.01; ∼∼∼, p < 0.001; ∧, significant difference compared with pH 7.2; ∧∧∧, p < 0.001. hBMVECs were pretreated in the absence or presence of 1 μg/ml LPS in RPMI growth medium and then loaded with 100 nm 54Mn for 1 h (B). Statistical significance was tested by unpaired t test (6 experimental replicates/condition). ***, p < 0.001. hBMVECs were loaded with 100 nm 54Mn for 1 h in HBSS containing HCO3− (C). Statistical significance was tested by Tukey's multiple comparison test (6 experimental replicates/condition). *, significant difference compared with 0 mm HCO3−; ***, p < 0.001; ∼, significant difference compared with 1 mm HCO3−; ∼∼∼, p < 0.001; , significant difference compared with 10 mm HCO3−; ∧∧∧, p < 0.001.
ZIP8 and ZIP14 are expressed by hBMVECs
Although both ZIP8 and ZIP14 exhibit a broad tissue distribution (30), their expression in hBMVECs has not been reported. To this end, standard ΔΔCt data were obtained for both transcripts with respect to β-actin (Fig. 3A) but also with respect to the relative abundance of ZIP8 versus ZIP14 message (Fig. S1). As noted, this latter quantification was based on the amplification efficiency for each set of primers determined from the slope of a Ct versus log[cDNA] analysis. The near equivalency of the intercept values of these plots indicate a comparable abundance of ZIP8 and ZIP14 mRNA (37, 38). In addition, both proteins were visualized in these cells by indirect immunofluorescence (Fig. 3B). The punctate, cytosolic localization indicated by these images is similar to that reported previously for chromosomally encoded ZIP8 and ZIP14 (24, 25). This distribution indicated by immunofluorescence is consistent with the surface biotinylation results presented below.
Figure 3.
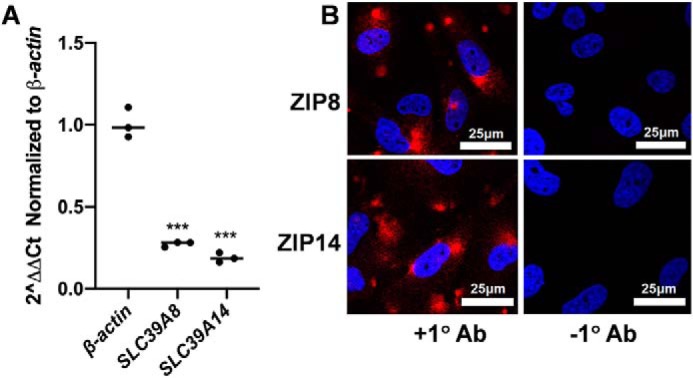
ZIP8 and ZIP14 expression in hBMVECs. Transcript abundance of each protein was quantified by qPCR (A). RNA was collected, reverse-transcribed and resulting cDNA was quantified by qPCR. The relative fold expression of ZIP8 and ZIP14 presented was calculated by the standard ΔΔCt method. ZIP8 and ZIP14 in hBMVECs were visualized by indirect immunofluorescence (B). The cells were grown on sterile coverslips to 85% confluency, fixed, blocked, and incubated overnight with primary antibodies to ZIP8 (top left panel) or ZIP14 (bottom left panel). Coverslips were incubated in anti-rabbit Alexa Fluor 647-conjugated secondary for 1 h followed by a 10-min nuclear stain with Hoescht 33342. Coverslips were mounted using Prolong Gold mounting media and sealed. Images were acquired at 63× magnification with oil immersion on a Leica TCS SP8 confocal microscope. Negative controls (right panel) were obtained by omitting the primary antibody incubation.
ZIP14 surface residence is modulated by clatherin-coated endocytosis, LPS, and Mn2+
The enhanced Mn2+ accumulation upon Dynasore treatment suggested that it stabilized Mn2 importer(s) on the surface of hBMVECs. Because treatment of cells with Fe2+, Mn2+, or LPS has increased expression of ZIP8 and/or ZIP14 (4, 8, 30, 35, 36), we examined whether any of these treatments influenced cell surface ZIP8 or ZIP14 occupancy in hBMVECs.
To quantify such a response, we took a cell-surface biotinylation approach to tag membrane-expressed proteins in hBMVECs grown in monolayers. After the cells were incubated with the biotin reagent, the cells were lysed; the lysates, normalized by protein content, are presented here as the “input” samples. These samples were fractionated by affinity capture on streptavidin columns. Nonbiotinylated proteins were collected in the flow-through (the “unbound” fractions), whereas tagged, cell-surface proteins were eluted off the streptavidin column by reductive cleavage of the disulfide bond linker; this is the “bound” fraction. The abundance of biotinylated, bound protein species was normalized based on the protein content of the input. These fractions were analyzed by Western blotting to establish whether Dynasore, Fe2+, Mn2+, or LPS treatments affected ZIP8 and ZIP14 surface localization (Fig. 4 and Figs. S2 and S3).
Figure 4.

Cell-surface localization of ZIP14, but not ZIP8 is enhanced with Dynasore, Mn2+, and LPS treatment. hBMVECs were treated with 80 μm Dynasore, 1 μm Fe2+-citrate (1 μm FeCl3 + 250 μm citrate + 5 mm ascorbate), or 200 nm MnCl2 for 3.5 h prior to cell-surface biotinylation. Input, unbound (flow-through) and bound fractions were collected and processed for Western blotting. Blots of the bound fractions were probed with ZIP8 (top panel) and ZIP14 (middle panel); the input was probed for β-actin (bottom panel) (A; see Fig. S2 to see all blots). The arrowheads denote the monomeric forms of the ZIP proteins; * denotes oligomeric forms. Quantification of ZIP8 and ZIP14 surface fractionation compared with untreated cells, normalized to β-actin (B). Statistically significant difference was calculated using Tukey's multiple comparison test, with n = 3 experimental replicates/condition. *, p < 0.05; ***, p < 0.001. n = 3 experimental replicates/condition. hBMVECs were treated with 1 μg/ml LPS for 3 or 24 h prior to cell surface biotinylation (C and D). Input and bound fractions were processed for Western blotting (see Fig. S3 to see blots). Band intensities for ZIP8 (C) and ZIP14 (D) expression were normalized to β-actin. Statistically significant difference was measured by Tukey's multiple comparison test. *, statistically significantly different compared with untreated cells. *, p < 0.05, with n = 3 or more replicates/condition.
ZIP8 and ZIP14 band intensities in all of the fractions were normalized to β-actin in the input, appropriate because all samples processed were adjusted to maintain constant total protein concentration. The data show that none of these treatments had a statistically significant effect on the surface presentation of ZIP8. In contrast, Mn2+, Dynasore, and LPS increased ZIP14 surface residence 2-fold compared with untreated cells without, however, any effect on the total cell ZIP14 protein content (Fig. 4A and Figs. S2 and S3). These effects are quantified in Fig. 4 (B–D). Note that the band intensities in the bound fractions (Fig. S2 and S3) are stronger than in the input because of their concentration in the affinity capture protocol and a difference in exposure time. However, by normalizing input and bound protein abundance based on these factors, the fraction of total cell transporter in the membrane was estimated. This estimate for both ZIP8 and ZIP14 was 5%, a value consistent with the proteins' primarily intracellular localization indicated by the images presented in Fig. 3B.
ZIP8 and ZIP14 facilitate Mn2+ accumulation in hBMVECs
The dependence of Mn2+ uptake on pH, for example, and the cell-surface localization of ZIP8 and ZIP14 support the inference that these transporters are the primary Mn2+ import proteins in hBMVECs. To test this hypothesis, siRNA delivery via electroporation was used to knock down endogenous ZIP8 and/or ZIP14 transcripts. With this approach, SLC39A8 mRNA was reduced by 85%, and SLC39A14 transcript was reduced by 65% in the single knockdowns, and each were reduced by 50% in the double knockdown (DKD) samples (Fig. 5, A and B, respectfully). siRNA knockdown of SLC39A8 decreased ZIP8 protein by 25%, and siRNA knockdown of SLC39A14 reduced ZIP14 protein by 50% at 2 days post-transfection (Fig. 5, C and D, respectively; and Fig. S4).
Figure 5.

siRNA knockdown of ZIP8 and ZIP14 demonstrates each contribution to hBMVEC 54Mn2+ accumulation. ZIP8 and ZIP14 transcript expression is reduced in siRNA knockdown samples (A and B). RNA was collected 2 days postelectroporation and reverse-transcribed, and the resulting cDNA was quantified by qPCR. The samples were compared with siGLO controls and normalized to β-actin transcript. #, significantly different compared with siGLO control; ###, p < 0.001; ***, p < 0.001. n = 9 or more /siRNA condition. ZIP8 and ZIP14 protein expression is reduced in siRNA knockdown samples (C and D). Lysates of siRNA samples were collected 2 days postelectroporation, cell surface–biotinylated, and processed for Western blotting. The samples were compared with siGLO controls and normalized to β-actin transcript levels. *, significantly different compared with siGLO control. *, p < 0.05; **, p < 0.01. n = 3–4 samples/siRNA condition. Physiologic 54Mn2+ accumulation is reduced in ZIP8 and ZIP14 knockdown hBMVECs (E). hBMVECs were loaded with 54Mn2+ (200 nm) for 1 h with uptake normalized for protein concentration. Statistical significance was tested by Tukey's multiple comparison test. #, significantly different compared with siGLO control; ###, p < 0.001; **, p < 0.01; ***, p < 0.001. n = 6 experimental replicates/sample. 54Mn2+ accumulation is somewhat reduced in ZIP8 and ZIP14 knockdown hBMVECs challenged with a hypernormal [Mn] (F). hBMVECs were loaded with 54Mn2+ (1 μm) for 1 h with uptake normalized for protein concentration. Statistical significance was tested by Tukey's multiple comparison test. #, significantly different compared with siGLO control; ###, p < 0.001; **, p < 0.01. n = 6 experimental replicates/sample.
We used these knockdown conditions to examine the effect on 54Mn2+ accumulation. Under 200 nm 54Mn2+-loading conditions, single knockdowns of ZIP8 and ZIP14 reduced Mn2+ uptake in hBMVECs ∼50% compared with the siGLO negative controls (Fig. 5E). In the DKD conditions, there was a synergistic drop in 54Mn2+ accumulation (Fig. 5E). These data indicate that both proteins support Mn2+ uptake by hBMVECs.
Our next objective was to determine how knockdown of these transporters altered uptake at [Mn] >35 μg/liter, a blood marker of manganese overload; we used 1 μm 54Mn2+ to reproduce this condition. Knockdown of either ZIP8 and ZIP14 reduced 54Mn2+ uptake by 20%, which was further decreased to 50% in the DKD samples compared with the siGLO controls (Fig. 5F). Although the differences were not as statistically robust as those observed under conditions of physiological Mn2+ loading, ZIP8 and ZIP14 appear, nonetheless, to support Mn2+ accumulation under manganese-overload conditions as well. Although there was a consistent correlation between the percentage of knockdown of transporter abundance and a decrease in Mn2+ uptake, our data do not strictly exclude the possibility that another divalent metal ion transporter contributes to the 54Mn2+ accumulation quantified.
ZIP8 and ZIP14 function at both the apical and basolateral membranes of hBMVECs
hBMVECs are polarized cells with luminal (or apical; blood-facing) and abluminal (or basolateral; brain-facing) membranes (39). Mn2+ from the circulation crosses the apical membrane to supply the brain with a dietary manganese source via efflux from the basolateral membrane (40). Thus, we examined whether ZIP8 and ZIP14 are localized on the apical membrane of hBMVECs. We seeded hBMVECs in Transwells to establish an in vitro BBB model and quantified 54Mn2+ accumulation from the apical chamber. As a control, we compared apical to basolateral Mn2+ uptake. Unexpectedly, uptake at the basolateral membrane was more robust than at the apical membrane (Fig. 6, compare B with A). This differential in flux trajectory is illustrated in Fig. 6C; the more robust uptake at the basal surface is indicated also by the more robust 54Mn2+ accumulation by hBMVECs when loaded from the basal compartment (Fig. 6D). Note that in addition to using transendothelial electrical resistance (TEER) measurement to ensure retention of barrier integrity in these experiments, this differential flux trajectory by itself also demonstrates the absence of paracellular leakage.
Figure 6.
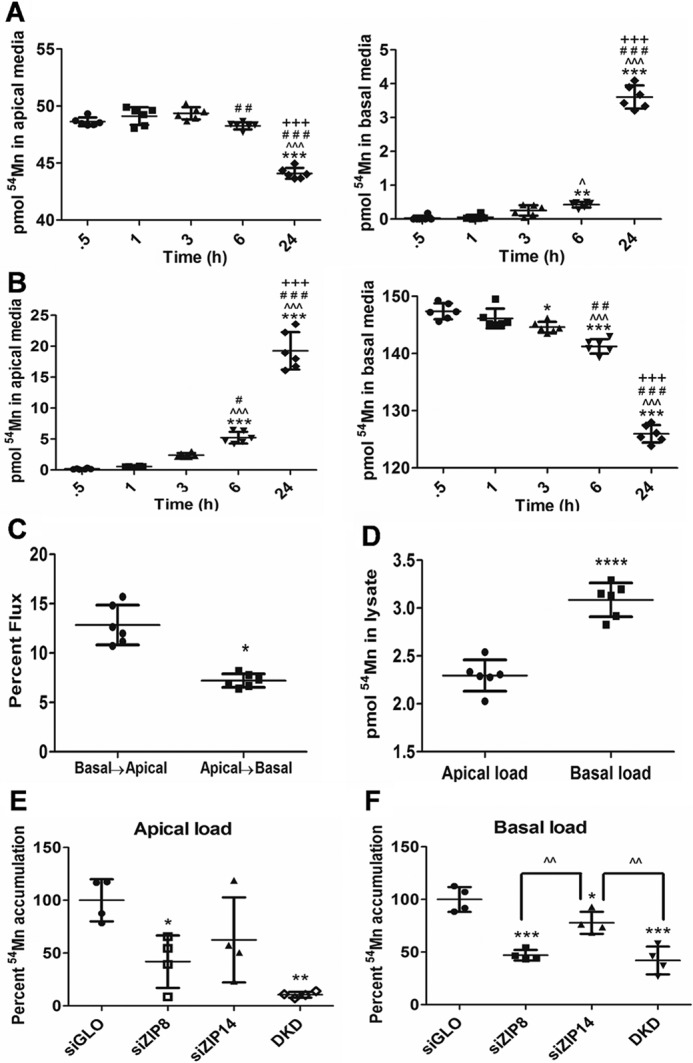
ZIP8 and ZIP14 support 54Mn2+ accumulation at both the apical and basolateral membranes of hBMVECs. hBMVECs grown in the apical chamber of Transwell ThincertsTM were loaded with 100 nm 54Mn2+ from the apical (A) or basal chamber (B), and the mass of 54Mn2+ in each chamber was quantified over time. Statistical significance of change was tested by Tukey's multiple comparison test. *, statistically significantly different from 0.5 h; *, p < 0.05; **, p < 0.01; ***, p < 0.001; ∧, difference from 1 h; ∧, p < 0.05; ∧∧∧, p < 0.001. #, difference from 3 h; #, p < 0.05; ##, p < 0.01; ###, p < 0.001. +, difference from 6 h; +++, p < 0.001. Based on these data the relative 54Mn2+ flux trajectory was calculated (C). After 24 h, the cells were lysed, and 54Mn2+ accumulation was normalized for protein concentration (D). Statistically significant difference was tested by unpaired t test. *, p < 0.05; ****, p < 0.0001. hBMVECs were electroporated with siRNAs for ZIP8 and ZIP14 and grown in the apical chamber of Transwell ThincertsTM (E and F). The cells were loaded with 100 nm 54Mn2+ for 3 h from the apical (E) or basal chamber (F). Statistically significant difference was measured using Tukey's multiple comparison test. *, statistically significantly different compared with siGLO; *, p < 0.05; **, p < 0.01; ***, p < 0.001; ∧∧, p < 0.01. n = 4 experimental replicates/condition.
The novel finding that hBMVECs accumulate Mn2+ from the abluminal space as well as from the “blood” indicate that ZIP8 and ZIP14 are localized and function as Mn2+ importers on both apical and basolateral membranes. We assessed this by using siRNA to knock down ZIP8 and/or ZIP14. hBMVECs were grown in Transwell inserts, and Mn2+ uptake was quantified from both apical and basal chambers. Knockdown of ZIP8 statistically decreased apical Mn2+ uptake by ∼50% compared with the siGLO controls (Fig. 6E). Although not significant (p = 0.147), knockdown of ZIP14 reduced apical Mn2+ uptake by ∼40% and the DKD samples reduced uptake by ∼85% compared with the control. When the cells were loaded from the basal chamber, knockdown of ZIP8 reduced Mn2+ accumulation by 50%, whereas ZIP14 knockdown diminished uptake by ∼25%, and the DKD lowered Mn2+ uptake by 60% compared with the siGLO controls (Fig. 6F). These results indicate that both ZIP8 and ZIP14 are apical and basolateral Mn2+ importers in hBMVECs.
Importantly, we confirmed that ZIP8 and ZIP14 localize to both membranes of hBMVECs. To quantify this distribution, we again used cell-surface biotinylation of cells grown in Transwells. Membrane-specific labeling is possible in this paradigm via the addition of reagent to either the apical or basal chamber. Following pulldown of biotinylated proteins and Western blotting analysis, we confirmed that ZIP8 and ZIP14 are localized to both membranes (Fig. 7, A and B, respectively). Although not statistically significant at p < 0.1, we observed the fractional distribution of surface ZIP8 to be more apically localized (58%; Fig. 7A), whereas surface ZIP14 was preferentially localized to the basolateral membrane (91%; Fig. 7B).
Figure 7.

ZIP8 and ZIP14 are localized to the apical and basal surfaces of hBMVECs. hBMVECs were grown in Transwell inserts to confluency and tight junction integrity (quantified by TEER measurement), and the apical or basolateral membrane was surface-biotinylated by the addition of reagent to one or the other Transwell chamber. Cultures were processed for Western blotting analysis of biotinylated protein. Input and bound fractions were normalized to β-actin. n = 4 replicates/condition. The fractional distribution of cell-surface apical and basolateral ZIP8 (A, bottom panel) and ZIP14 (B, bottom panel) was quantified as a percentage of the total of each protein found to be membrane-associated. Statistically significant difference was analyzed using unpaired t test. *, p < 0.05. Note that the actin control is the same in A and B because the same blot was used to probe for ZIP8 and ZIP14 in the input fractions to which the bound fractions were normalized.
Discussion
The objective of this study was to elucidate the transporter(s) responsible for Mn2+ uptake in hBMVECs. Inasmuch as these cells support the barrier that filters metabolites in the general circulation for their permeation into the abluminal space, we chose them as an appropriate model for brain manganese trafficking. Clinical presentation of patients carrying mutations in either ZIP8 or ZIP14 has implicated these two promiscuous divalent metal ion transporters in brain manganese metabolism (4, 8, 27, 41–48). Our data demonstrate at the protein and cell level that both contribute to the trafficking of Mn2+ in the endothelial cells found in the brain's capillary bed.
We examined the kinetics of manganese uptake and efflux in hBMVECs using 54Mn2+, the likely ionic species found in the circulation, and at a concentration of 100–200 nm that is within the physiological range of circulating manganese. Our data show that at steady state, Mn2+ uptake and efflux over time results in a net 54Mn2+ accumulation by hBMVECs. We considered the possibility that bulk transport (i.e. endocytosis) contributed to Mn2+ uptake. However, Dynasore, a clatherin-coated endocytosis inhibitor, induced an increase, not a decrease, in Mn2+ uptake by hBMVECs. Inhibiting caveolin-mediated endocytosis with genistein also enhanced 54Mn2+ accumulation (data not shown). These data indicate that bulk vesicular transport does not support Mn2+ accumulation but are consistent with the model that inhibition of protein turnover/recycling at the plasma membrane amplifies Mn2+ uptake.
The candidates for Mn2+ import are ZIP8, ZIP14, and DMT1; we show here and in previous work from this lab (19) that all three divalent metal ion transporters are expressed by hBMVECs. To determine which of the three is/are involved in Mn2+ uptake by hBMVECs, we investigated the influence of varying pH in a 54Mn2+ accumulation assay. Mn2+ uptake in hBMVECs was strongly responsive to increasing pH, indicating that ZIP8 and/or ZIP14 and not DMT1 are the primary divalent metal ion transporters in hBMVECs. Previous work from this lab showed that non–transferrin-bound iron uptake in hBMVECs also utilized a DMT1-independent uptake mechanism (19). We demonstrated here also that LPS and HCO3− increased Mn2+ accumulation in hBMVECs, consistent with the known effects of LPS and HCO3− on ZIP8 and ZIP14 expression and activity (24, 25, 35).
As noted, we concluded that Dynasore enhances Mn2+ accumulation by blocking surface protein internalization. Within the L2 cytosolic loop of ZIP14, there is a YSDI motif suggested to be a tyrosine-based endocytosis signal (49, 50). The YTRF sequence in the transferrin receptor is an example of such a motif (51). In addition, Zhao et al. (52) reported that ZIP14 surface residence was increased in HepG2 cells when treated with Dynasore. Our results in hBMVECs parallel this behavior as treatment with Dynasore increased the membrane expression of ZIP14; in our work, an added finding was that such treatment had no effect on ZIP8 localization. In addition, knockdown of ZIP14 treated with Dynasore resulted in reduced 54Mn2+ uptake compared with siGLO and siZIP8 Dynasore-treated cells, consistent with the model that Mn2+ uptake correlates in part with the membrane presentation of ZIP14, specifically (Fig. S5).
Fe2+, Mn2+, and LPS have been reported to modulate expression of ZIP8 and ZIP14 (4, 5, 30, 35, 36). We were interested in how these treatments affected ZIP8 and ZIP14 expression and plasma membrane residence in hBMVECs. The results show that Fe2+, Mn2+, and LPS treatments do not alter the abundance of ZIP8 or ZIP14, whereas Mn2+ and LPS promote increased ZIP14 surface occupancy 2-fold. No significant change in surface expression of ZIP8 was observed following either of these treatments. These results suggest also the model that cycling of ZIP14 to and from the plasma membrane is a contributor to the regulation of Mn2+ accumulation by hBMVECs.
Knockdown of ZIP8 and ZIP14 mRNA was robust but did not result in a complete knockdown of either protein. Consequently, we did not observe a complete inhibition of Mn2+ uptake under any knockdown condition. ZIP8 knockdown resulted in a 25% reduction of the protein, whereas the ZIP14 knockdown reduced protein expression by 50%. Despite this dissimilar knockdown efficiency, there was no statistically significant difference in the loss of 54Mn2+ accumulation efficiency. Interestingly, whereas knockdown of SLC39A14 up-regulated SLC39A8 transcript, there was no difference in SLC39A14 expression following knockdown of SLC39A8 (Fig. S6). Other data have shown that SLC39A8 was able to compensate for the lack of SLC39A14 (23, 53, 54), results that are similar to those we report here for hBMVECs. However, the importance of both proteins in Mn2+ accumulation is indicated by the fact that the knockdown of both transporters reduces 54Mn2+ uptake more than the single knockdowns. On the other hand, when challenged with nonphysiologic [Mn2+], the knockdown of both transporters had a more limited effect, suggesting that additional uptake mechanisms obtain under conditions of systemic manganese overload.
The restrictive nature of the BBB is due to the tight junctions between BMVECs caused by expression of claudins and occludins, which inhibit paracellular metabolite trafficking (39). Under normal conditions, nutrients and solutes enter the brain solely via transcellular transport. To delineate the mechanism of Mn2+ handling at this barrier in vitro, we grew hBMVECs in Transwell inserts, allowed the cells to polarize, and compared apical versus basolateral Mn2+ accumulation. Our Transwell model allowed us to determine whether ZIP8 and ZIP14 were localized to both the apical and basolateral membranes. Our surface biotinylation protocol demonstrated the expression of both proteins in both membranes; furthermore, we demonstrated that ZIP14 was the predominant transporter at the basal surface. Our knockdown of the expression of the two transporters in hBMVECs grown in Transwells and subsequent quantification of 54Mn2+ uptake was consistent with this differential distribution in that ZIP14 knockdown had a more robust effect on basal compared with apical Mn2+ uptake.
The work here in the barrier cells of the brain is consistent with the recent report that in the intestinal epithelial Caco2 cell line grown in Transwells, ZIP14 is expressed on the basal (blood) membrane and supports a basolateral-to-apical (secretory) manganese transport (55). The pattern that appears to be developing is that at such barriers, Mn2+ transport is bidirectional. This transcellular trafficking has not been considered as part of the systemic handling of this transition metal including at the BBB.
With this model in mind, the effects on manganese distribution in KO mouse lines are instructive. Inducible ZIP8 knockout mice display decreased blood and brain manganese levels compared with control mice (27). Our cell-surface biotinylation and functional ZIP8 knockdown studies directly correlate with the decrease in manganese accumulation in the brains of these mice. In contrast, whole-body ZIP14 knockout mice have elevated blood and brain manganese levels (23, 26, 54). Patients with genetic mutations in SLC39A14 also exhibit brain manganese overload (8, 43). The elevated blood manganese-level in the KO mice is fully consistent with the basal-to-apical, secretory manganese trafficking in Caco2 cells recently reported (55). Our data provide a cellular mechanism for the brain manganese accumulation quantified in the mouse model and associated with SLC39A14-linked genetic disorders. Our quantitative cell-surface biotinylation assay in Transwells showed that ZIP14 mainly resides in the basolateral membrane. This is in agreement with studies reporting basolateral localization of ZIP14 in hepatocytes, enterocytes, and Caco-2 cells, as noted (28, 56–58). Thus, with this view of ZIP14 function, whereas ZIP8 continues to support hBMVEC Mn2+ uptake and brain manganese accumulation, the secretory flow of Mn2+ out of the brain normally supported by ZIP14 is absent. The result is brain Mn2+ accumulation. Clearly, our simple in vitro model does not reflect the complexity inherent in examination of whole-body manganese distribution, but it does replicate the characteristics of the in vivo clinical and mouse model outcomes.
In summary, we leveraged the biochemical behaviors of the putative mammalian Mn2+ transporters and siRNA knockdown to demonstrate that ZIP8 and ZIP14 are the dominant proteins associated with manganese uptake in hBMVECs. Additionally, we show that Mn2+ and LPS modulate ZIP14 but not ZIP8 membrane recycling. Importantly, we provide evidence for ZIP8- and ZIP14-dependent Mn2+ uptake by hBMVECs at both the apical and basolateral membranes of these cells. This novel finding indicates that these two transporters support a bidirectional, transcellular flux of Mn2+ at the blood–brain barrier. This flux, of course, requires a corresponding efflux pathway whose characteristics are under current delineation.
Materials and methods
Cell culture
hBMVECs were a generous gift from Dr. Supriya Mahajan (University at Buffalo); the generation and characteristics of this cell line have been described in detail (59, 60) and have been validated as an hBMVEC cell line (59). hBMVECs were cultured as previously described (19), reaching ∼90–95% confluency at the time of the experiment. The experiments were performed in 3-cm, 6-cm, or 24-well tissue culture dishes or Greiner Bio-one Transwells (1.0-μm pore size), as specified. For hBMVECs grown in Transwells, barrier integrity was measured by TEER quantified using a Millicell ERS-2 Epithelial Volt-Ohm meter according to the manufacturer's instructions (EMD Millipore, Billerica, MA).
54Mn2+ accumulation and efflux assays
For 54Mn2+ accumulation assays, hBMVEC monolayers were loaded with physiological concentrations (100 nm) of 54MnCl2 (PerkinElmer), in RPMI 1640 plus serum growth medium, unless otherwise indicated. hBMVECs grown in Transwell inserts were loaded with 100 nm (or 200 nm for the flux assay) 54Mn2+ in the apical chamber (RPMI 1640 plus serum growth medium) or in the basal chamber (RPMI 1640 minus serum, plus 5 μg/ml human insulin and 30 nm sodium selenite growth medium). The reactions were terminated with ice-cold quench buffer as previously described (61) and then lysed with RIPA buffer (25 mm Tris, 150 mm NaCl, 1% Nonidet P-40, 1% sodium deoxycholate, 0.1% SDS).
For 54Mn2+ efflux assays, hBMVEC monolayers were loaded with 100 nm 54Mn2+ for 24 h. The cells were washed once with RPMI 1640 (minus serum, 5 μg/ml human insulin, 30 nm sodium selenite) and twice with 250 μm sodium citrate. 54Mn2+ efflux was monitored in RPMI 1640 plus serum growth medium for up to 3 h. Efflux was quenched as above, and the cells lysed with RIPA buffer. The lysates were analyzed for 54Mn2+ and protein content. Cell-associated 54Mn2+ counts (LKB Wallac CompuGamma) were normalized to protein concentration. Protein was quantified by BCA assay (Thermo Scientific).
siRNA delivery by electroporation
SLC39A8 and SLC39A14 expression was knocked down in hBMVECs using siGENOMETM human SLC39A8 siRNA SMARTpool and siGENOMETM human SLC39A14 siRNA SMARTpool, respectively (Dharmacon). RISC-independent siGLO transfection indicator (Dharmacon) was used as a negative control to infer transfection efficiency. The siGLO control contains a fluorescein amidite-labeled reporter to confirm appropriate nuclear localization of the siRNAs. The siRNAs were delivered via electroporation using the NEON® transfection system (Life Technologies). Electroporation was conducted with two pulses of 1150 V for 30 ms. hBMVECs were electroporated with 125 nm siRNAs (final concentration in the culture dish) in RPMI 1640 growth medium with 10% FBS (no antibiotics). The medium was changed 24 h after electroporation, and cell growth, viability, and transfection efficiency (siGLO) were noted. All assays using siRNA knockdown samples were performed 48 h postelectroporation.
RT-qPCR
Total RNA was extracted from hBMVEC cells using the TRIzol® reagent (Invitrogen) as per the manufacturer's instructions. After DNase treatment and purification with Direct-zol RNA kit (Zymo Research), 400 ng of RNA was reverse-transcribed using the iScriptTM cDNA synthesis kit (Bio-Rad) to generate cDNA. Real-time quantitative PCR was performed using SsoAdvancedTM Universal SYBR® Green Supermix and analyzed using CFX96 TouchTM real-time PCR detection system (Bio-Rad). Relative expression of the target gene was normalized to β-actin and calculated using the ΔΔCt method. End point qPCRs were separated on a 1.7% agarose gel to confirm product size. The primer sequences used to amplify for each transcript were as follows: human SLC39A8 forward, 5′-ATGCTACCCAAATAACCAGC-3′; human SLC39A8 reverse, 5′-CAGGAATCCATATCCCCAAAC-3′; human SLC39A14 forward, 5′-TAAGCAGAAAAATGAGCATC-3′; human SLC39A14 reverse, 5′-ACCTTTCAGCCAGTAGCAAG-3′; β-actin forward, 5′-GGGTCAGAAGGACTCCTACG-3′; and β-actin reverse, 5′-GGTCTCAAACATGATCTGGG-3′.
Cell-surface biotinylation
Membrane proteins were separated from hBMVECs as previously described (62). Briefly, cells grown in 6-well plates or 6-well Transwell inserts were washed twice with PBS containing 1 mm CaCl2 and 0.5 mm MgCl2 (used for entire biotinylation protocol) and then treated with 0.5 mg/ml EZ-LinkTM Sulfo-NHS-SS-Biotin (Thermo Fisher) for 30 min (or 2 h for Transwells) at 4 °C. Then the cells were washed twice with PBS (+Ca2+, Mg2+) containing 0.1% BSA and twice with PBS (+Ca2+, Mg2+). The cells were lysed by scraping in ice-cold RIPA buffer (25 mm Tris, 150 mm NaCl, 1% Nonidet P-40, 1% sodium deoxycholate, 0.1% SDS, pH 7.4) supplemented with 4× Halt protease inhibitor mixture (Thermo Fisher) and incubation on ice for 15 min. The cell suspension was then centrifuged at 10,000 × g for 10 min at 4 °C, and the supernatant (input fraction) was collected and loaded onto a NeutrAvidin–agarose column overnight at 4 °C. Following collection of the flow-through (unbound fraction), the columns were washed with RIPA buffer containing 4× protease inhibitors and eluted at 50 °C in 6× SDS-loading buffer, 150 mm DTT (bound fraction). The input and unbound fraction protein content was quantified, and equal amounts of protein were loaded for Western blotting. All of the elution from the bound fraction was used for SDS-PAGE followed by Western blotting.
Western blotting
Lysate samples (see RIPA + 4× protease inhibitor recipe above) were denatured at 37 °C for 30 min (20 μg total protein/lane) and fractionated on 4–15% SDS-polyacrylamide gradient gels, followed by transfer to a polyvinylidene difluoride membrane. Membranes were blocked in TBST (TBS with 0.05% Tween 20) containing 5% milk at room temperature for 1 h. Primary antibodies were diluted in 1% milk-TBST as follows: 1:2000–2500 rabbit anti-ZIP8 antibody (SAB3500598; Sigma-Aldrich) and 1:2500 rabbit anti-ZIP14 antibody (SAB3500603; Sigma-Aldrich). The specificity of these antibodies was tested using blocking peptides (SBP3500598 for anti-ZIP8 and SAB3500603 for anti-ZIP14; Sigma-Aldrich) that bind the hZIP8 and hZIP14 epitopes that the antibodies were raised against (Fig. S7) (31, 41, 63–65). In addition, the bands indicated to represent ZIP8 and ZIP14 (by open arrows and asterisks) were reduced when knocked down with specific siRNAs (Fig. S4). The blots with primary antibody were incubated at 4 °C overnight. After washing, the membranes were incubated at room temperature for 1 h with secondary goat anti-rabbit horseradish peroxidase–conjugated antibodies (NBP2-30348H; Novus Biologicals) diluted 1:7500 in TBST containing 3% milk. Immunocomplexes were visualized using SuperSignal West Dura extended duration substrate (Thermo Scientific) on a ChemiDocTM Imager (Bio-Rad).
Indirect immunofluorescence
hBMVECs grown on coverslips were fixed for 10 min with 3.7% paraformaldehyde and 4% sucrose in PBS (+Ca2+, Mg2+), washed twice with PBS, and incubated for 1 h in 1% BSA, 0.3 m glycine, 0.1% Tween 20. The cells were incubated overnight at 4 °C with anti-ZIP8 or anti-ZIP14 antibodies (1:1000 dilution) in 1% BSA. The cells were washed at room temperature for 5 min three times and then probed with 1:1000 secondary donkey anti-rabbit Alexa 488-conjugated goat anti-rabbit (A21206; Invitrogen) in PBS 1% BSA for 1 h at room temperature followed by three 5-min washes (all washes were with PBS containing Ca2+ and Mg2+ as above). The cells were stained with 0.7 μg/ml Hoechst 33342 (Thermo Fisher Scientific) for 10 min at room temperature, followed by three 5-min washes. The coverslips were mounted onto glass microscope slides using ProlongTM glass mounting medium (Invitrogen). Images were obtained using a Leica TCS SP8 confocal microscope and were analyzed by Vaa3D software. As noted in the figure legend, the images were collected at 63- magnification.
Statistical data analysis
All statistical analyses were performed using Prism 5.0 or 8.0 (GraphPad Software, San Diego, CA). The data are presented as means ± S.D. Unpaired t tests were used when comparisons were made between two conditions (one variable) from the same time point. Comparisons of multiple samples were made using one-way analysis of variance statistical analyses in conjunction with Tukey's multiple comparison tests. In the text, “n” refers to the number of technical replicates used to derive the stated quantity.
Author contributions
B. L. S. conceptualization; B. L. S., F. M. S., and D. J. K. data curation; B. L. S. and F. M. S. formal analysis; B. L. S. and F. M. S. validation; B. L. S. and F. M. S. investigation; B. L. S. and F. M. S. methodology; B. L. S. and D. J. K. writing-original draft; B. L. S., F. M. S., and D. J. K. writing-review and editing; D. J. K. resources; D. J. K. supervision; D. J. K. funding acquisition; D. J. K. project administration.
Supplementary Material
Acknowledgments
We thank Dr. Mitchell Knutson for generously sharing unpublished data and providing valuable suggestions about this project. We thank also our colleague Danielle Bailey, who shared the ZIP8 and ZIP14 qPCR efficiency data presented in Fig. S1.
This work was supported by Grants RO3NS095063 and RO1NS102337 from the NINDS, National Institutes of Health, Department of Health and Human Services (to D. J. K.). The authors declare that they have no conflicts of interest with the contents of this article. The content is solely the responsibility of the authors and does not necessarily represent the official views of the National Institutes of Health.
This article contains Figs. S1–S7.
- hBMVEC
- human brain microvascular endothelial cell
- BBB
- blood–brain barrier
- DMT1
- divalent metal transporter 1
- LPS
- lipopolysaccharide
- HBSS
- Hanks' balanced salt solution
- TEER
- trans-endothelial electrical resistance
- DKD
- double knockdown
- RIPA
- radioimmune precipitation assay
- qPCR
- quantitative PCR.
References
- 1. Szpetnar M., Luchowska-Kocot D., Boguszewska-Czubara A., and Kurzepa J. (2016) The influence of manganese and glutamine intake on antioxidants and neurotransmitter amino acids levels in rats' brain. Neurochem. Res. 41, 2129–2139 10.1007/s11064-016-1928-7 [DOI] [PMC free article] [PubMed] [Google Scholar]
- 2. Rose C., Butterworth R. F., Zayed J., Normandin L., Todd K., Michalak A., Spahr L., Huet P. M., and Pomier-Layrargues G. (1999) Manganese deposition in basal ganglia structures results from both portal-systemic shunting and liver dysfunction. Gastroenterology 117, 640–644 10.1016/S0016-5085(99)70457-9 [DOI] [PubMed] [Google Scholar]
- 3. Chtourou Y., Trabelsi K., Fetoui H., Mkannez G., Kallel H., and Zeghal N. (2011) Manganese induces oxidative stress, redox state unbalance and disrupts membrane bound ATPases on murine neuroblastoma cells in vitro: protective role of silymarin. Neurochem. Res. 36, 1546–1557 10.1007/s11064-011-0483-5 [DOI] [PMC free article] [PubMed] [Google Scholar]
- 4. Choi E. K., Nguyen T. T., Gupta N., Iwase S., and Seo Y. A. (2018) Functional analysis of SLC39A8 mutations and their implications for manganese deficiency and mitochondrial disorders. Sci. Rep. 8, 3163 10.1038/s41598-018-21464-0 [DOI] [PMC free article] [PubMed] [Google Scholar]
- 5. Choi E. K., Nguyen T. T., Iwase S., and Seo Y. A. (2019) Ferroportin disease mutations influence manganese accumulation and cytotoxicity. FASEB J. 33, 2228–2240 10.1096/fj.201800831R [DOI] [PMC free article] [PubMed] [Google Scholar]
- 6. Quadri M., Federico A., Zhao T., Breedveld G. J., Battisti C., Delnooz C., Severijnen L. A., Di Toro Mammarella L., Mignarri A., Monti L., Sanna A., Lu P., Punzo F., Cossu G., Willemsen R., et al. (2012) Mutations in SLC30A10 cause parkinsonism and dystonia with hypermanganesemia, polycythemia, and chronic liver disease. Am. J. Hum. Genet. 90, 467–477 10.1016/j.ajhg.2012.01.017 [DOI] [PMC free article] [PubMed] [Google Scholar]
- 7. Quadri M., Kamate M., Sharma S., Olgiati S., Graafland J., Breedveld G. J., Kori I., Hattiholi V., Jain P., Aneja S., Kumar A., Gulati P., Goel M., Talukdar B., and Bonifati V. (2015) Manganese transport disorder: novel SLC30A10 mutations and early phenotypes. Mov. Disord. 30, 996–1001 10.1002/mds.26202 [DOI] [PubMed] [Google Scholar]
- 8. Tuschl K., Meyer E., Valdivia L. E., Zhao N., Dadswell C., Abdul-Sada A., Hung C. Y., Simpson M. A., Chong W. K., Jacques T. S., Woltjer R. L., Eaton S., Gregory A., Sanford L., Kara E., et al. (2016) Mutations in SLC39A14 disrupt manganese homeostasis and cause childhood-onset parkinsonism-dystonia. Nat. Commun. 7, 11601 10.1038/ncomms11601 [DOI] [PMC free article] [PubMed] [Google Scholar]
- 9. Crossgrove J. S., Allen D. D., Bukaveckas B. L., Rhineheimer S. S., and Yokel R. A. (2003) Manganese distribution across the blood–brain barrier. I. Evidence for carrier-mediated influx of managanese citrate as well as manganese and manganese transferrin. Neurotoxicology 24, 3–13 10.1016/S0161-813X(02)00089-X [DOI] [PubMed] [Google Scholar]
- 10. Crossgrove J. S., and Yokel R. A. (2005) Manganese distribution across the blood–brain barrier. IV. Evidence for brain influx through store-operated calcium channels. Neurotoxicology 26, 297–307 10.1016/j.neuro.2004.09.004 [DOI] [PubMed] [Google Scholar]
- 11. Fitsanakis V. A., Piccola G., Aschner J. L., and Aschner M. (2005) Manganese transport by rat brain endothelial (RBE4) cell-based Transwell model in the presence of astrocyte conditioned media. J. Neurosci. Res. 81, 235–243 10.1002/jnr.20560 [DOI] [PubMed] [Google Scholar]
- 12. Ulluwishewa D., Anderson R. C., McNabb W. C., Moughan P. J., Wells J. M., and Roy N. C. (2011) Regulation of tight junction permeability by intestinal bacteria and dietary components. J. Nutr. 141, 769–776 10.3945/jn.110.135657 [DOI] [PubMed] [Google Scholar]
- 13. Barar J., Rafi M. A., Pourseif M. M., and Omidi Y. (2016) Blood–brain barrier transport machineries and targeted therapy of brain diseases. Bioimpacts 6, 225–248 10.15171/bi.2016.30 [DOI] [PMC free article] [PubMed] [Google Scholar]
- 14. Barceloux D. G. (1999) Manganese. J. Toxicol. Clin. Toxicol. 37, 293–307 [DOI] [PubMed] [Google Scholar]
- 15. FloraFlora S. J. S. (2014) Metals. in Biomarkers in Toxicology, (Gupta R. ed) pp. 485–519, Academic Press, Orlando, FL [Google Scholar]
- 16. Gunter T. E., Gerstner B., Gunter K. K., Malecki J., Gelein R., Valentine W. M., Aschner M., and Yule D. I. (2013) Manganese transport via the transferrin mechanism. Neurotoxicology 34, 118–127 10.1016/j.neuro.2012.10.018 [DOI] [PMC free article] [PubMed] [Google Scholar]
- 17. Suarez N., Walum E., and Eriksson H. (1995) Cellular neurotoxicity of trivalent manganese bound to transferrin or pyrophosphate studied in human neuroblastoma (SH-SY5Y) cell cultures. Toxicol. In Vitro 9, 717–721 10.1016/0887-2333(95)00062-D [DOI] [PubMed] [Google Scholar]
- 18. Tuschl K., Mills P. B., and Clayton P. T. (2013) Manganese and the brain. Int. Rev. Neurobiol. 110, 277–312 10.1016/B978-0-12-410502-7.00013-2 [DOI] [PubMed] [Google Scholar]
- 19. McCarthy R. C., and Kosman D. J. (2012) Mechanistic analysis of iron accumulation by endothelial cells of the BBB. Biometals 25, 665–675 10.1007/s10534-012-9538-6 [DOI] [PMC free article] [PubMed] [Google Scholar]
- 20. Mackenzie B., Takanaga H., Hubert N., Rolfs A., and Hediger M. A. (2007) Functional properties of multiple isoforms of human divalent metal-ion transporter 1 (DMT1). Biochem. J. 403, 59–69 10.1042/BJ20061290 [DOI] [PMC free article] [PubMed] [Google Scholar]
- 21. Mackenzie B., Ujwal M. L., Chang M. H., Romero M. F., and Hediger M. A. (2006) Divalent metal-ion transporter DMT1 mediates both H+-coupled Fe2+ transport and uncoupled fluxes. Pflugers Arch. 451, 544–558 10.1007/s00424-005-1494-3 [DOI] [PubMed] [Google Scholar]
- 22. Tandy S., Williams M., Leggett A., Lopez-Jimenez M., Dedes M., Ramesh B., Srai S. K., and Sharp P. (2000) Nramp2 expression is associated with pH-dependent iron uptake across the apical membrane of human intestinal Caco-2 cells. J. Biol. Chem. 275, 1023–1029 10.1074/jbc.275.2.1023 [DOI] [PubMed] [Google Scholar]
- 23. Aydemir T. B., Kim M. H., Kim J., Colon-Perez L. M., Banan G., Mareci T. H., Febo M., and Cousins R. J. (2017) Metal transporter Zip14 (Slc39a14) deletion in mice increases manganese deposition and produces neurotoxic signatures and diminished motor activity. J. Neurosci. 37, 5996–6006 10.1523/JNEUROSCI.0285-17.2017 [DOI] [PMC free article] [PubMed] [Google Scholar]
- 24. Girijashanker K., He L., Soleimani M., Reed J. M., Li H., Liu Z., Wang B., Dalton T. P., and Nebert D. W. (2008) Slc39a14 gene encodes ZIP14, a metal/bicarbonate symporter: similarities to the ZIP8 transporter. Mol. Pharmacol. 73, 1413–1423 10.1124/mol.107.043588 [DOI] [PMC free article] [PubMed] [Google Scholar]
- 25. He L., Girijashanker K., Dalton T. P., Reed J., Li H., Soleimani M., and Nebert D. W. (2006) ZIP8, member of the solute-carrier-39 (SLC39) metal-transporter family: characterization of transporter properties. Mol. Pharmacol. 70, 171–180 10.1124/mol.106.024521 [DOI] [PubMed] [Google Scholar]
- 26. Jenkitkasemwong S., Akinyode A., Paulus E., Weiskirchen R., Hojyo S., Fukada T., Giraldo G., Schrier J., Garcia A., Janus C., Giasson B., and Knutson M. D. (2018) SLC39A14 deficiency alters manganese homeostasis and excretion resulting in brain manganese accumulation and motor deficits in mice. Proc. Natl. Acad. Sci. U.S.A. 115, E1769–E1778 10.1073/pnas.1720739115 [DOI] [PMC free article] [PubMed] [Google Scholar]
- 27. Lin W., Vann D. R., Doulias P. T., Wang T., Landesberg G., Li X., Ricciotti E., Scalia R., He M., Hand N. J., and Rader D. J. (2017) Hepatic metal ion transporter ZIP8 regulates manganese homeostasis and manganese-dependent enzyme activity. J. Clin. Invest. 127, 2407–2417 10.1172/JCI90896 [DOI] [PMC free article] [PubMed] [Google Scholar]
- 28. Liu C., Hutchens S., Jursa T., Shawlot W., Polishchuk E. V., Polishchuk R. S., Dray B. K., Gore A. C., Aschner M., Smith D. R., and Mukhopadhyay S. (2017) Hypothyroidism induced by loss of the manganese efflux transporter SLC30A10 may be explained by reduced thyroxine production. J. Biol. Chem. 292, 16605–16615 10.1074/jbc.M117.804989 [DOI] [PMC free article] [PubMed] [Google Scholar]
- 29. Pinilla-Tenas J. J., Sparkman B. K., Shawki A., Illing A. C., Mitchell C. J., Zhao N., Liuzzi J. P., Cousins R. J., Knutson M. D., and Mackenzie B. (2011) Zip14 is a complex broad-scope metal-ion transporter whose functional properties support roles in the cellular uptake of zinc and nontransferrin-bound iron. Am. J. Physiol. Cell Physiol. 301, C862–C871 10.1152/ajpcell.00479.2010 [DOI] [PMC free article] [PubMed] [Google Scholar]
- 30. Wang C. Y., Jenkitkasemwong S., Duarte S., Sparkman B. K., Shawki A., Mackenzie B., and Knutson M. D. (2012) ZIP8 is an iron and zinc transporter whose cell-surface expression is up-regulated by cellular iron loading. J. Biol. Chem. 287, 34032–34043 10.1074/jbc.M112.367284 [DOI] [PMC free article] [PubMed] [Google Scholar]
- 31. Ji C., and Kosman D. J. (2015) Molecular mechanisms of non-transferrin-bound and transferring-bound iron uptake in primary hippocampal neurons. J. Neurochem. 133, 668–683 10.1111/jnc.13040 [DOI] [PMC free article] [PubMed] [Google Scholar]
- 32. Macia E., Ehrlich M., Massol R., Boucrot E., Brunner C., and Kirchhausen T. (2006) Dynasore, a cell-permeable inhibitor of dynamin. Dev. Cell 10, 839–850 10.1016/j.devcel.2006.04.002 [DOI] [PubMed] [Google Scholar]
- 33. Yokel R. A., and Crossgrove J. S. (2004) Manganese toxicokinetics at the blood–brain barrier. Res. Rep. Health Eff. Inst. 7–73 [PubMed] [Google Scholar]
- 34. Mayor S., and Pagano R. E. (2007) Pathways of clathrin-independent endocytosis. Nat. Rev. Mol. Cell Biol. 8, 603–612 10.1038/nrm2216 [DOI] [PMC free article] [PubMed] [Google Scholar]
- 35. Aydemir T. B., Chang S. M., Guthrie G. J., Maki A. B., Ryu M. S., Karabiyik A., and Cousins R. J. (2012) Zinc transporter ZIP14 functions in hepatic zinc, iron and glucose homeostasis during the innate immune response (endotoxemia). PLoS One 7, e48679 10.1371/journal.pone.0048679 [DOI] [PMC free article] [PubMed] [Google Scholar]
- 36. Pyle C. J., Akhter S., Bao S., Dodd C. E., Schlesinger L. S., and Knoell D. L. (2017) Zinc modulates endotoxin-induced human macrophage inflammation through ZIP8 induction and C/EBPβ inhibition. PLoS One 12, e0169531 10.1371/journal.pone.0169531 [DOI] [PMC free article] [PubMed] [Google Scholar]
- 37. Nolan T., Hands R. E., and Bustin S. A. (2006) Quantification of mRNA using real-time RT-PCR. Nat. Protoc. 1, 1559–1582 10.1038/nprot.2006.236 [DOI] [PubMed] [Google Scholar]
- 38. Taylor S. C., Nadeau K., Abbasi M., Lachance C., Nguyen M., and Fenrich J. (2019) The ultimate qPCR experiment: producing publication quality, reproducible data the first time. Trends Biotechnol. 37, 761–774 10.1016/j.tibtech.2018.12.002 [DOI] [PubMed] [Google Scholar]
- 39. Worzfeld T., and Schwaninger M. (2016) Apicobasal polarity of brain endothelial cells. J. Cereb. Blood Flow Metab. 36, 340–362 10.1177/0271678X15608644 [DOI] [PMC free article] [PubMed] [Google Scholar]
- 40. Stamatovic S. M., Keep R. F., and Andjelkovic A. V. (2008) Brain endothelial cell-cell junctions: how to “open” the blood brain barrier. Curr. Neuropharmacol. 6, 179–192 10.2174/157015908785777210 [DOI] [PMC free article] [PubMed] [Google Scholar]
- 41. Boycott K. M., Beaulieu C. L., Kernohan K. D., Gebril O. H., Mhanni A., Chudley A. E., Redl D., Qin W., Hampson S., Küry S., Tetreault M., Puffenberger E. G., Scott J. N., Bezieau S., Reis A., et al. (2015) Autosomal-recessive intellectual disability with cerebellar atrophy syndrome caused by mutation of the manganese and zinc transporter gene SLC39A8. Am. J. Hum. Genet. 97, 886–893 10.1016/j.ajhg.2015.11.002 [DOI] [PMC free article] [PubMed] [Google Scholar]
- 42. Haller G., McCall K., Jenkitkasemwong S., Sadler B., Antunes L., Nikolov M., Whittle J., Upshaw Z., Shin J., Baschal E., Cruchaga C., Harms M., Raggio C., Morcuende J. A., Giampietro P., et al. (2018) A missense variant in SLC39A8 is associated with severe idiopathic scoliosis. Nat. Commun. 9, 4171 10.1038/s41467-018-06705-0 [DOI] [PMC free article] [PubMed] [Google Scholar]
- 43. Marti-Sanchez L., Ortigoza-Escobar J. D., Darling A., Villaronga M., Baide H., Molero-Luis M., Batllori M., Vanegas M. I., Muchart J., Aquino L., Artuch R., Macaya A., Kurian M. A., and Dueñas P. (2018) Hypermanganesemia due to mutations in SLC39A14: further insights into Mn deposition in the central nervous system. Orphanet J. Rare Dis. 13, 28 10.1186/s13023-018-0758-x [DOI] [PMC free article] [PubMed] [Google Scholar]
- 44. Park J. H., Hogrebe M., Fobker M., Brackmann R., Fiedler B., Reunert J., Rust S., Tsiakas K., Santer R., Grüneberg M., and Marquardt T. (2018) SLC39A8 deficiency: biochemical correction and major clinical improvement by manganese therapy. Genet. Med. 20, 259–268 10.1038/gim.2017.106 [DOI] [PubMed] [Google Scholar]
- 45. Park J. H., Hogrebe M., Grüneberg M., DuChesne I., von der Heiden A. L., Reunert J., Schlingmann K. P., Boycott K. M., Beaulieu C. L., Mhanni A. A., Innes A. M., Hörtnagel K., Biskup S., Gleixner E. M., Kurlemann G., et al. (2015) SLC39A8 deficiency: a disorder of manganese transport and glycosylation. Am. J. Hum. Genet. 97, 894–903 10.1016/j.ajhg.2015.11.003 [DOI] [PMC free article] [PubMed] [Google Scholar]
- 46. Riley L. G., Cowley M. J., Gayevskiy V., Roscioli T., Thorburn D. R., Prelog K., Bahlo M., Sue C. M., Balasubramaniam S., and Christodoulou J. (2017) A SLC39A8 variant causes manganese deficiency, and glycosylation and mitochondrial disorders. J. Inherit. Metab. Dis. 40, 261–269 10.1007/s10545-016-0010-6 [DOI] [PubMed] [Google Scholar]
- 47. Wahlberg K., Arora M., Curtin A., Curtin P., Wright R. O., Smith D. R., Lucchini R. G., Broberg K., and Austin C. (2018) Polymorphisms in manganese transporters show developmental stage and sex specific associations with manganese concentrations in primary teeth. Neurotoxicology 64, 103–109 10.1016/j.neuro.2017.09.003 [DOI] [PMC free article] [PubMed] [Google Scholar]
- 48. Wahlberg K. E., Guazzetti S., Pineda D., Larsson S. C., Fedrighi C., Cagna G., Zoni S., Placidi D., Wright R. O., Smith D. R., Lucchini R. G., and Broberg K. (2018) Polymorphisms in manganese transporters SLC30A10 and SLC39A8 are associated with children's neurodevelopment by influencing manganese homeostasis. Front. Genet. 9, 664 10.3389/fgene.2018.00664 [DOI] [PMC free article] [PubMed] [Google Scholar]
- 49. Bowers K., and Srai S. K. S. (2018) The trafficking of metal ion transporters of the Zrt- and Irt-like protein family. Traffic 19, 813–822 10.1111/tra.12602 [DOI] [PubMed] [Google Scholar]
- 50. Pandey K. N. (2009) Functional roles of short sequence motifs in the endocytosis of membrane receptors. Front. Biosci. (Landmark Ed.) 14, 5339–5360 10.2741/3599 [DOI] [PMC free article] [PubMed] [Google Scholar]
- 51. Collawn J. F., Lai A., Domingo D., Fitch M., Hatton S., and Trowbridge I. S. (1993) YTRF is the conserved internalization signal of the transferrin receptor, and a second YTRF signal at position 31–34 enhances endocytosis. J. Biol. Chem. 268, 21686–21692 [PubMed] [Google Scholar]
- 52. Zhao N., Zhang A. S., Worthen C., Knutson M. D., and Enns C. A. (2014) An iron-regulated and glycosylation-dependent proteasomal degradation pathway for the plasma membrane metal transporter ZIP14. Proc. Natl. Acad. Sci. U.S.A. 111, 9175–9180 10.1073/pnas.1405355111 [DOI] [PMC free article] [PubMed] [Google Scholar]
- 53. Troche C., Aydemir T. B., and Cousins R. J. (2016) Zinc transporter Slc39a14 regulates inflammatory signaling associated with hypertrophic adiposity. Am. J. Physiol. Endocrinol. Metab. 310, E258–E268 10.1152/ajpendo.00421.2015 [DOI] [PMC free article] [PubMed] [Google Scholar]
- 54. Xin Y., Gao H., Wang J., Qiang Y., Imam M. U., Li Y., Wang J., Zhang R., Zhang H., Yu Y., Wang H., Luo H., Shi C., Xu Y., Hojyo S., et al. (2017) Manganese transporter Slc39a14 deficiency revealed its key role in maintaining manganese homeostasis in mice. Cell Discov. 3, 17025 10.1038/celldisc.2017.25 [DOI] [PMC free article] [PubMed] [Google Scholar]
- 55. Scheiber I. F., Wu Y., Morgan S. E., and Zhao N. (2019) The intestinal metal transporter ZIP14 maintains systemic manganese homeostasis. J. Biol. Chem. 294, 9147–9160 10.1074/jbc.RA119.008762 [DOI] [PMC free article] [PubMed] [Google Scholar]
- 56. Guthrie G. J., Aydemir T. B., Troche C., Martin A. B., Chang S. M., and Cousins R. J. (2015) Influence of ZIP14 (slc39A14) on intestinal zinc processing and barrier function. Am. J. Physiol. Gastrointest. Liver Physiol. 308, G171–G178 10.1152/ajpgi.00021.2014 [DOI] [PMC free article] [PubMed] [Google Scholar]
- 57. Nam H., Wang C. Y., Zhang L., Zhang W., Hojyo S., Fukada T., and Knutson M. D. (2013) ZIP14 and DMT1 in the liver, pancreas, and heart are differentially regulated by iron deficiency and overload: implications for tissue iron uptake in iron-related disorders. Haematologica 98, 1049–1057 10.3324/haematol.2012.072314 [DOI] [PMC free article] [PubMed] [Google Scholar]
- 58. Thompson K. J., Hein J., Baez A., Sosa J. C., and Wessling-Resnick M. (2018) Manganese transport and toxicity in polarized WIF-B hepatocytes. Am. J. Physiol. Gastrointest. Liver Physiol. 315, G351–G363 10.1152/ajpgi.00103.2018 [DOI] [PMC free article] [PubMed] [Google Scholar]
- 59. Eigenmann D. E., Xue G., Kim K. S., Moses A. V., Hamburger M., and Oufir M. (2013) Comparative study of four immortalized human brain capillary endothelial cell lines, hCMEC/D3, hBMEC, TY10, and BB19, and optimization of culture conditions, for an in vitro blood–brain barrier model for drug permeability studies. Fluids Barriers CNS 10, 33 10.1186/2045-8118-10-33 [DOI] [PMC free article] [PubMed] [Google Scholar]
- 60. Stins M. F., Badger J., and Sik Kim K. (2001) Bacterial invasion and transcytosis in transfected human brain microvascular endothelial cells. Microb Pathog. 30, 19–28 10.1006/mpat.2000.0406 [DOI] [PubMed] [Google Scholar]
- 61. McCarthy R. C., and Kosman D. J. (2013) Ferroportin and exocytoplasmic ferroxidase activity are required for brain microvascular endothelial cell iron efflux. J. Biol. Chem. 288, 17932–17940 10.1074/jbc.M113.455428 [DOI] [PMC free article] [PubMed] [Google Scholar]
- 62. Dlouhy A. C., Bailey D. K., Steimle B. L., Parker H. V., and Kosman D. J. (2019) Fluorescence resonance energy transfer links membrane ferroportin, hephaestin but not ferroportin, amyloid precursor protein complex with iron efflux. J. Biol. Chem. 294, 4202–4214 10.1074/jbc.RA118.005142 [DOI] [PMC free article] [PubMed] [Google Scholar]
- 63. Coffey R., and Knutson M. D. (2017) The plasma membrane metal-ion transporter ZIP14 contributes to nontransferrin-bound iron uptake by human β-cells. Am. J. Physiol. Cell Physiol. 312, C169–C175 10.1152/ajpcell.00116.2016 [DOI] [PMC free article] [PubMed] [Google Scholar]
- 64. Ding D., Salvi R., and Roth J. A. (2014) Cellular localization and developmental changes of Zip8, Zip14 and transferrin receptor 1 in the inner ear of rats. Biometals 27, 731–744 10.1007/s10534-014-9765-0 [DOI] [PubMed] [Google Scholar]
- 65. Zhang R., Witkowska K., Afonso Guerra-Assunção J., Ren M., Ng F. L., Mauro C., Tucker A. T., Caulfield M. J., and Ye S. (2016) A blood pressure-associated variant of the SLC39A8 gene influences cellular cadmium accumulation and toxicity. Hum. Mol. Genet. 25, 4117–4126 10.1093/hmg/ddw236 [DOI] [PMC free article] [PubMed] [Google Scholar]
Associated Data
This section collects any data citations, data availability statements, or supplementary materials included in this article.