

Abstract
Obesity is a complex disorder of excessive adiposity, and is associated with adverse health effects such as cardiometabolic complications, which are to a large extent attributable to dysfunctional white adipose tissue. Adipose tissue dysfunction is characterized by adipocyte hypertrophy, impaired adipokine secretion, a chronic low‐grade inflammatory status, hormonal resistance and altered metabolic responses, together contributing to insulin resistance and related chronic diseases. Adipose tissue hypoxia, defined as a relative oxygen deficit, in obesity has been proposed as a potential contributor to adipose tissue dysfunction, but studies in humans have yielded conflicting results. Here, we will review the role of adipose tissue oxygenation in the pathophysiology of obesity‐related complications, with a specific focus on human studies. We will provide an overview of the determinants of adipose tissue oxygenation, as well as the role of adipose tissue oxygenation in glucose homeostasis, lipid metabolism and inflammation. Finally, we will discuss the putative effects of physiological and experimental hypoxia on adipose tissue biology and whole‐body metabolism in humans. We conclude that several lines of evidence suggest that alteration of adipose tissue oxygenation may impact metabolic homeostasis, thereby providing a novel strategy to combat chronic metabolic diseases in obese humans.
Keywords: adipose tissue, hypoxia, inflammation, metabolism, obesity, oxygen
1. INTRODUCTION
Obesity is defined as a body mass index (BMI) of 30 kg/m2 or above, and is characterized by excessive expansion of white adipose tissue (WAT) mass. The global trend in the prevalence of obesity represents a major public health problem, with more than 700 million children and adults affected worldwide.1, 2, 3 Obesity predisposes to multiple comorbidities, like insulin resistance and type 2 diabetes mellitus (T2DM), cardiovascular disease (CVD) and various types of cancer,2, 4, 5, 6, 7, 8 although 10%‐30% of the obese individuals will not be present with a pathological metabolic profile.9 Nevertheless, this phenotype, often referred to as metabolically healthy obesity,9, 10, 11, 12 carries an increased risk to develop CVD and T2DM later in life as compared to normal weight individuals.13, 14, 15, 16 This has led to the view that the pathophysiology of obesity and its complications is driven by WAT dysfunction rather than an increase in WAT mass only.10, 17, 18, 19
Dysfunctional WAT is characterized by adipocyte hypertrophy, impairments in lipid metabolism (including a reduced capacity to buffer the daily influx of dietary lipids, thereby contributing to ectopic fat accumulation), decreased adipose tissue blood flow and a state of chronic low‐grade inflammation (Figure 1).18, 20, 21 The presence of adipose tissue (AT) inflammation in obesity is well established, and several factors that contribute to the sequence of events leading to a pro‐inflammatory phenotype of obese AT have been identified, as extensively reviewed elsewhere.10, 22, 23, 24 Interestingly, more recent findings have provided evidence that the amount of oxygen in the adipose tissue microenvironment may also impact AT metabolism and inflammation, and WAT oxygenation may, therefore, be a key factor in the pathophysiology of AT dysfunction and related chronic diseases.18, 25, 26
Figure 1.
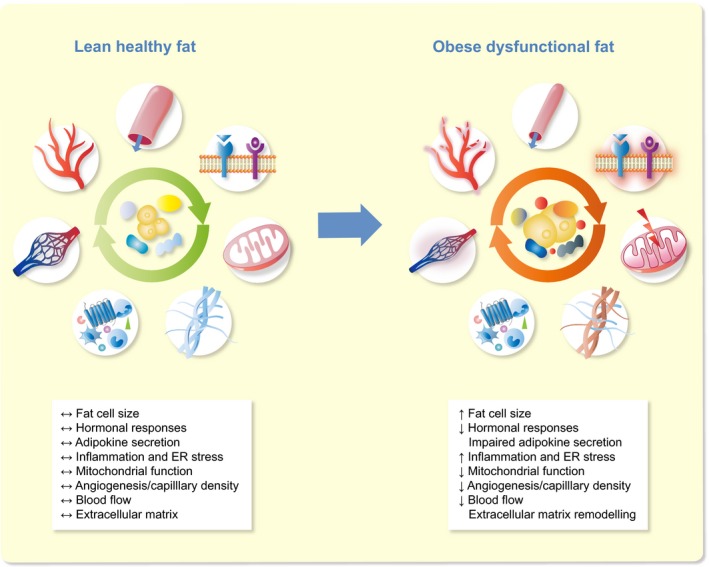
Characteristics of lean healthy and obese dysfunctional white adipose tissue. Adipose tissue dysfunction is characterized by adipocyte hypertrophy, impaired adipokine secretion, a chronic low‐grade inflammation, apoptosis, extracellular matrix remodelling, hormonal resistance, vascular rarefaction, decreased adipose tissue blood flow and altered metabolic responses, together contributing to insulin resistance and related chronic diseases. ER, endoplasmic reticulum
In this review article, we will consider the role of WAT oxygenation in WAT dysfunction and its putative impact on the pathophysiology of obesity‐related metabolic and inflammatory diseases, with a focus on human studies. First, we will present a brief overview of the different aspects of WAT dysfunction in obesity. Thereafter, the oxygenation of WAT in obesity as well as the determinants of WAT oxygenation will be discussed. Next, the effects of WAT oxygenation on tissue (dys)function will be described, particularly in relation to inflammation and substrate metabolism. Finally, we will explore the effects of moderate hypoxia exposure on whole‐body physiology in humans.
2. ADIPOSE TISSUE DYSFUNCTION IN OBESITY
One of the main functions of WAT is the preservation of energy in the form of triacylglycerol (TAG) in response to a chronic‐positive energy balance.27 Adipose tissue has the capacity to expand at the cellular level by recruiting stem cells/pre‐adipocytes from the stroma‐vascular fraction (SVF) resulting in more adipocytes (hyperplasia), or by enlargement of existing adipocytes (hypertrophy).28, 29 However, it has been suggested that there is a set number of pre‐adipocytes that can be recruited, which seems to be genetically determined.30 Adipocytes can substantially increase in size but do have a certain expansion limit, implying that these cells have a maximum capacity of storing TAG.23, 25, 31, 32 What seems to be even more important than the maximal storage capacity is the ability to dynamically store lipids in the postprandial phase, the so‐called lipid buffering capacity, and to release fatty acids under fasting conditions.33 Hypertrophic WAT has been shown to have an impaired capacity to store meal‐derived fatty acids.34 As a consequence, more dietary lipids are diverted through the circulation to be stored in other tissues, which results in ectopic fat accumulation when lipid uptake exceeds lipid oxidation.35 The storage of excess lipids in non‐adipose tissues in obesity has important metabolic consequences, since this is closely associated with insulin resistance.17, 23, 31 Furthermore, hypertrophic adipocytes are characterized by a pro‐inflammatory phenotype, which may further aggravate insulin resistance.24, 36 Importantly, however, adipocyte inflammation also seems essential for healthy adipose tissue expansion and remodelling,37 suggesting that inflammation is not solely a pathological phenomenon. Noteworthy, medication used to treat type 2 diabetes may alleviate inflammation by reducing hyperglycaemia. However, the anti‐inflammatory effects of these agents are inconsistent, and it remains to be established whether their beneficial metabolic effects are mediated via modulation of chronic low‐grade inflammation.38
WAT inflammation is not only caused by secretion of pro‐inflammatory factors by adipocytes, but is also determined by infiltration of various populations of specialized, pro‐inflammatory immune cells 39, 40 such as macrophages.27, 41, 42, 43, 44 In rodents, macrophages can be divided into two major phenotypes, the pro‐inflammatory M1 and anti‐inflammatory M2 macrophages.45 M1 macrophages are activated by damage‐associated molecular patterns (DAMPs), cytokines such as IFN‐γ, and free fatty acids (FFA), acting as a major source of pro‐inflammatory cytokines, including tumour necrosis factor (TNF)‐α, interleukin (IL)‐1β, IL‐6, IL‐12 and IL‐23.44, 46, 47, 48, 49 In contrast, M2 macrophages play a role in tissue remodelling, and it seems that the M1/M2 ratio in WAT is critical in the pathophysiology of obesity, since M2 macrophages act as regulators and suppressors of inflammation, counterbalancing the pro‐inflammatory effects of M1 macrophages.23, 50, 51, 52, 53 Noteworthy, the macrophage phenotypes seem more complex, especially in humans where no clear division in M1/M2 macrophages is apparent.54, 55
In obesity, changes occur not only in the inflammatory cell population, but also in the extracellular matrix (ECM) of adipose tissue. The ECM consists of collagens, glycoproteins and proteoglycans, providing mechanical support and protection.27, 56 At the same time, the ECM interacts directly with the adipocytes’ signalling pathways in a dynamic way, affecting differentiation and expansion of the tissue.22, 57 The latter requires remodelling and alterations in the ECM composition, which has been associated with fibrosis and adipose tissue dysfunction in individuals with insulin resistance.57, 58
More recently, evidence has emerged that the oxygenation of WAT is altered in obesity, which may impact several aspects of WAT function and whole‐body physiology.
3. ALTERED ADIPOSE TISSUE OXYGEN PARTIAL PRESSURE IN OBESITY
Since alterations in the oxygenation of WAT may contribute to WAT dysfunction, as will be discussed later in this review, adipose tissue oxygen partial pressure (AT pO2) has been assessed in both rodents and humans. In addition to direct measurements of pO2, indirect methods to estimate WAT oxygenation have been applied (Table 1). The direct studies on WAT oxygenation have yielded conflicting findings, which are summarized in Table 2..25, 34, 59, 60, 61, 62, 63, 64, 65, 66
Table 1.
Direct methods and surrogate markers used to determine adipose tissue oxygenation
| Methods applied to assess adipose tissue oxygenation |
|---|
| Direct |
| Silastic tonometer69, 70, 71, 72 |
| Polarographic micro clark‐type electrode60 |
| Optochemical, continuous monitoring via microdialysis59, 73, 74, 116 |
| Combined oxygen and temperature probe57 |
| Needle‐type fibre‐optic oxygen sensor (rodents)64, 65, 85 |
| Indirect |
| Arterio‐venous difference technique34 |
| Gene expression of hypoxia‐responsive genes/proteins63 |
| Pimonidazole hydrochloride63, 66 |
Table 2.
Summary of studies in which adipose tissue oxygenation has been directly measured in humans
| Study | Site of sWAT | Technique used | Participants' characteristics | AT pO2 (mmHg) |
|---|---|---|---|---|
| Kabon et al69 a | Upper arm | Silastic tonometer | Non‐obese: n = 23 (12 M, 11 F); Age: 44 ± 9 y; BMI: 24 ± 4 kg/m2 | Right arm: 54 (47, 64)b |
| Left arm/wound: 62 (49, 68)b | ||||
| Obese: n = 23 (3 M, 20 F); Age: 44 ± 13 y; BMI: 51 ± 15 kg/m2 | Right arm: 43 (37, 54)b | |||
| Left arm/wound: 42 (36, 60)b | ||||
| Fleischmann et al70 | Upper arm | Silastic tonometer | Non‐obese: n = 15 (10 M, 5 F); Age: 43 y (13) c; BMI: 24 (3) kg/m2 c | 57 (15)c |
| Morbidly obese: n = 20 (4 M, 16 F); Age: 40 y (11) c; BMI: 46 (7) kg/m2 c | 41 (10)c | |||
| Hiltebrand et al71 | Upper arm | Silastic tonometer | Lean: n = 7 (2 M, 5 F); Age: 31 ± 6 y; BMI: 22 ± 2 kg/m2 | 52 ± 10 |
| Obese: n = 7 F; Age: 37 ± 6 y; BMI: 46 ± 4 kg/m2 | 58 ± 8 | |||
| Pasarica et al60 | Abdominal | Polarographic micro clark‐type electrode | Lean: n = 9 (5 M, 4 F); Age: 22.6 ± 3.3 y; BMI: 22.1 ± 1.0 kg/m2 | 55.4 ± 9.1 |
| Overweight/obese: n = 12 (6 M, 6F); Age: 38.9 ± 15.8 y; BMI: 31.7 ± 1.9 kg/m2 | 46.8 ± 10.6 | |||
| Goossens et al59 | Abdominal | Optochemical, measurement system | Lean: n = 10 M; Age: 55.8 ± 4.1 y; BMI: 23.4 ± 0.3 kg/m2 | 44.7 ± 5.8 |
| Obese: n = 10 M; Age: 59.6 ± 3.1 y; BMI: 34.2 ± 1.3 kg/m2 | 67.4 ± 3.7 | |||
| Lawler et al57 | Abdominal | combined oxygen and temperature probe | Obese insulin sensitive: n = 6 (4F/2M); Age: 36 ± 4; BMI: 32 ± 1 kg/m2 | 41.1 ± 1.2 |
| Obese insulin resistant: n = 6 (6F); Age: 37 ± 3; BMI: 34 ± 2 kg/m2 | 37.7 ± 2.4 | |||
| Both obese groups: n = 12 (10F/2M) | 39.3 ± 1.5 | |||
| Lean: n = 4 (3F/1M); Age: 31 ± 3 y; BMI: 23 ± 1 kg/m2 | 53 ± 1.9 | |||
| Kaiser et al72 | Right upper arm | Silastic tonometer | Morbidly obese: n = 7; Age: 51 (35‐55); BMI: 67 (57‐71) kg/m2 | Baseline (kPa): 6.8 (6.2‐7.6 [4.4]) |
| Non‐obese: n = 7; Age: 62 (53‐67); BMI: 26.5 (26‐29) kg/m2 | Baseline (kPa): 6.5 (6.1‐7.5 [3.0]) | |||
| Vink et al74 | Abdominal | Optochemical, continuous monitoring via microdialysis | Obese/overweight: n = 15 (9F/6M); Age: 50.9 ± 2.1 y; BMI: Baseline: 31.1 ± 0.6 kg/m2 | Baseline: 51.0 ± 1.6 |
| End of WS: 27.9 ± 0.5 kg/m2 | End of WS: 41.3 ± 3.1 | |||
| Goossens et al73 | Abdominal | Optochemical, continuous monitoring via microdialysis | Lean insulin sensitive: men n = 7; Age: 58.6 ± 2.6 y; BMI 23.0 ± 0.3 kg/m2 | 40.4 ± 6.6 |
| Obese insulin sensitive: men n = 7; Age: 55.6 ± 2.8; BMI: 31.7 ± 0.8 kg/m2 | 56.1 ± 3.2 | |||
| Obese insulin resistant: men n = 7; Age: 56.9 ± 4.0; BMI: 33.1 ± 1.3 kg/m2 | 68.5 ± 4.4 | |||
| Obese insulin sensitive: women n = 7; Age: 50.6 ± 3.0; BMI: 30.5 ± 0.8 kg/m2 | 50.8 ± 2.5 | |||
| Obese insulin resistant: women n = 7; Age: 51.0 ± 2.3; BMI: 32.9 ± 1.8 kg/m2 | 62.3 ± 5.3 | |||
| Vogel et al116 | Abdominal & Femoral | Optochemical, continuous monitoring via microdialysis | Obese/overweight: n = 8 (F); Age:52.5 ± 1.8 y; BMI 34.4 ± 1.6 kg/m2 | Abdominal: 62.7 ± 6.6 |
| Femoral: 50.0 ± 4.5 |
Abbreviations: AT, adipose tissue; BMI, body mass index; pO2, oxygen partial pressure (mmHg, if not indicated otherwise); kPa: kilopascal; sWAT, subcutaneous white adipose tissue; WS, weight stable period after diet‐induced weight loss.
Measurements were taken on the morning the day after surgery.
Median with 25th‐75th percentile.
Results presented as means (SDs).
The presence of hypoxia in obese adipose tissue was originally shown in murine models of obesity.18, 25 Direct measurements of pO2 using needle‐type O2 electrodes showed that WAT oxygenation is lower in ob/ob, KKAy and diet‐induced obese mice as compared to lean controls.18, 63, 64, 65, 66, 67 In line, gene expression of several hypoxia‐related genes, including hypoxia‐inducible factor‐1 alpha (HIF‐1α), were also increased. Moreover, using pimonidazole hydrochloride, which stains hypoxic areas, it has been demonstrated that hypoxic areas were more prevalent in WAT of obese rodents.18, 63, 64, 65, 66, 67 However, it is worth mentioning that these rodent models of obesity are characterized by a rapid and massive gain in adipose tissue mass because of genotype and/or the diet that these animals received, which is not comparable to the more gradual development of obesity in most humans.63, 64, 65, 66, 68
So far, not many human studies examining WAT pO2 have been performed, and the results on WAT oxygenation are somewhat contradictory.18, 59 The first direct measurements of WAT pO2 in humans were made in individuals undergoing surgery.69, 70 It was found that morbidly obese individuals had lower pO2 levels in subcutaneous WAT (sWAT) of the upper arm as compared to lean subjects, determined the morning after surgery.69, 70 However, other studies in which sWAT oxygenation has been measured both during and after surgery showed opposite results, with increased or no significant difference in WAT pO2 between obese and lean individuals.71, 72 Notably, these initial studies assessed oxygenation in WAT of the upper arm, which is not of crucial importance for whole‐body metabolism. Moreover, the O2 levels measured in these studies could have been affected by the applied anaesthesia, and other factors related to morbid obesity.
Pasarica and colleagues 60 were the first to measure abdominal sWAT pO2 in humans, using a polarographic micro Clark‐type electrode. Overweight and obese participants, including patients with T2DM, had a lower AT pO2 compared to lean controls, which is in line with findings in rodents.25 Furthermore, it has been found that abdominal sWAT pO2 was higher in obese insulin sensitive and obese insulin resistant as compared to lean subjects, with no significant differences between the obese groups.57 Noteworthy, only four lean individuals were included in the latter study.
The presence of hypoxia in sWAT in obesity has been challenged by recent studies in humans. We have demonstrated a higher rather than lower pO2 in obese subjects with impaired glucose metabolism as compared to lean healthy, age‐matched individuals, despite lower adipose tissue blood flow (oxygen supply) in obesity.59 These findings of higher abdominal sWAT pO2 in obesity have been confirmed by very recent studies.73, 74 Abdominal sWAT pO2 was found to be higher in obese insulin resistant as compared to lean and obese insulin‐sensitive men, with no significant differences in WAT oxygenation between obese insulin‐sensitive and lean insulin‐sensitive men.73 Furthermore, this study demonstrated that AT oxygenation was positively associated with insulin resistance, even after adjustment for age, sex and body fat percentage, suggesting that AT pO2 may be more closely related to insulin sensitivity than obesity per se.73 To date, only one study investigated the effects of weight loss on sWAT pO2 in humans. In this study, overweight and obese individuals underwent a dietary intervention, consisting of a 5‐week very low calorie diet (VLCD, 500 kcal/d) and a subsequent 4‐week weight stable diet. It was found that VLCD‐induced weight loss markedly decreased abdominal sWAT pO2, which was paralleled by improved whole‐body insulin sensitivity.74
The striking differences in findings on sWAT pO2 between studies may be attributed to differences between study populations in terms of the onset and physical history (eg, weight cycling) of obesity and other subjects’ characteristics (eg, age, sex, ethnicity, presence of type 2 diabetes), the sWAT depot studied, and variation in the methodology used.25, 59, 60
In addition to direct measurements of sWAT pO2 in humans, several studies have used alternative approaches to indirectly estimate tissue oxygenation, including metabolic profiling of sWAT in vivo and the assessment of hypoxia‐responsive WAT gene expression. Hodson and co‐workers34 have measured metabolic fluxes across abdominal sWAT in vivo in lean, overweight and obese humans, and their findings strongly argue against any functional consequences of WAT hypoxia in obesity; in fact, the opposite might be true. More specifically, these authors demonstrated that the fasting lactate‐to‐pyruvate ratio, which is a potential metabolic signature of “hypoxia,” in arterial blood, was inversely correlated with adiposity. Using arteriovenous difference methodology with selective venous catheterization of abdominal sWAT, no significant association was found between WAT‐specific changes in lactate‐to‐pyruvate ratio and BMI. However, the proportion of glucose released as lactate and pyruvate in sWAT was strongly negatively correlated with BMI.34 Observational human studies examining hypoxia‐related genes as surrogate markers of WAT oxygenation have shown increased HIF‐1α expression in sWAT in humans with morbid obesity.57, 75, 76 Interestingly, HIF‐1α expression was higher in the SVF than in adipocytes, which might imply that the SVF is more sensitive to changes in oxygenation.77 Importantly, however, HIF‐1α mRNA expression seems not an appropriate marker for hypoxia.78 Also, upregulated genes in subcutaneous and visceral WAT of severely obese subjects that are under control of HIF were not responsive to hypoxia in adipocytes,79 which raises the question what pO2 threshold is required for activation of the HIF pathway in adipose tissue.60 Furthermore, genome‐wide association studies have shown a correlation between epigenetic methylation of the HIF3α gene in sWAT and BMI and WAT dysfunction markers.80, 81, 82, 83 Following bariatric surgery, there was a reduction in HIF‐1α mRNA expression in WAT.84 On the contrary, HIF‐1α gene expression was upregulated during weight loss induced by a low caloric diet.74
It is important to emphasize that a stronger mechanistic link exists between hypoxia and the spatial presence of HIF‐1α protein rather than its mRNA expression.85, 86 Further, HIF‐1α is not only regulated by oxygen levels, but also by growth factors including insulin.87 Therefore, metabolic disturbances such as insulin resistance and/or hyperglycaemia may also have marked effects on HIF‐1α protein stability,87 and may affect epigenetic modifications. This implies that one should be cautious when drawing conclusions about WAT oxygenation based on gene expression of classical hypoxia‐responsive genes such as HIF‐1α, GLUT1 and VEGF.25
Taken together, recent cross‐sectional and intervention studies that we have performed in our laboratory demonstrate higher rather than lower WAT pO2 in obese insulin resistant individuals, but findings on sWAT oxygenation (markers) in humans with obesity are conflicting. Thus, further investigation of determinants of sWAT oxygenation may help to better understand these discrepant findings.
3.1. Determinants of adipose tissue oxygenation in humans
WAT pO2 is the result of a delicate balance between O2 supply and consumption, which both seem to be altered in obesity. More specifically, differences in angiogenesis, capillary density and vascular function, together determining adipose tissue blood flow (ATBF), and the cellular demands affecting O2 consumption contribute to changes in WAT pO2.18, 25, 68
3.1.1. Adipose tissue oxygen supply
Both structural (ie, capillary density) and functional (ie, vascular tone) aspects of the vasculature determine ATBF and, therefore, oxygen supply to WAT. There is substantial evidence that there is insufficient angiogenesis in WAT depots in obesity. Obese individuals show decreased adipose tissue mRNA expression of VEGF, the master regulator of angiogenesis and a HIF‐1α target protein.59, 60, 88 Pasarica and colleagues60 showed that capillary density was lower in overweight/obese humans, and found a positive correlation between VEGF expression and capillary density. The lower capillary density in WAT of obese individuals has been confirmed by our laboratory.59 Furthermore, it has been shown that obese insulin resistant subjects had fewer capillaries and a greater number of large vessels in WAT as compared to lean individuals.89 Together, these findings are indicative of vascular rarefaction and decreased vascular remodelling in WAT in obese humans. Thus, the lower capillary density may reflect higher WAT oxygenation in obesity. Alternatively, if WAT oxygenation would be lower in obesity, the pro‐angiogenic response is not effectively propagated.90
In addition to a lower capillary density in WAT of obese individuals, an increased vascular tone may impair ATBF, which ultimately determines tissue oxygen delivery. It is well established that ATBF is impaired in human obesity. Fasting ATBF is lower in obese compared to lean individuals and has been linked to insulin resistance.59, 91, 92, 93, 94, 95 Furthermore, in the postprandial period as well as during insulin stimulation (ie, hyperinsulinemic‐euglycemic clamp), the increase in ATBF is blunted in obese vs lean subjects.59, 95, 96 These impairments seem to be related to impaired beta‐adrenergic responsiveness and increased activity of the renin‐angiotensin system in obesity.68, 94, 97, 98 We have previously shown that both pharmacological and physiological manipulation of ATBF induced concomitant alterations in WAT pO2 in humans,59 suggesting that decreased ATBF in obesity indeed reduces AT oxygen supply. Importantly, however, WAT pO2 is not only determined by oxygen supply to the tissue but is also dependent on WAT oxygen consumption, as discussed in more detail below.
3.1.2. Adipose tissue oxygen consumption and mitochondrial function
In normal weight individuals, WAT oxygen consumption is relatively low as compared to other tissues, accounting for approximately 5% of whole‐body oxygen consumption.34, 62, 99 It has been estimated that mitochondrial oxygen consumption accounts for up to 85%, while non‐mitochondrial oxygen consumption may be responsible for 10%‐15% of total oxygen consumption in WAT under steady‐state conditions.100, 101 Both mitochondrial and non‐mitochondrial oxygen consumption may change during the marked WAT remodelling occurring in obesity and may induce alterations in WAT oxygenation.
It is well established that mitochondrial morphology, mass and function are impaired in multiple adipose tissue depots in obese rodents.102, 103, 104, 105, 106 Interestingly, it has been reported that early in the development of obesity, enhanced mitochondrial metabolism, biogenesis and reactive oxygen species (ROS) production seem critical to initiate and promote adipocyte differentiation.107, 108 In line with findings in animals, several human studies have reported impaired mitochondrial capacity and reduced expression of genes/proteins related to mitochondrial metabolism (eg, peroxisome proliferator‐activated receptor gamma coactivator 1‐alpha and nuclear respiratory factor 1) in WAT in states of obesity, insulin resistance and T2DM.34, 59, 109, 110, 111, 112 Furthermore, it has been shown that mitochondrial proteins are downregulated not only at whole WAT level, but also in adipocytes from obese individuals.113, 114 In line, mitochondrial density and oxygen consumption rates are lower in adipocytes derived from obese vs lean subjects, independent of adipocyte size.113, 114, 115 Of note, there also appear to be sWAT depot‐specific differences in oxygen consumption rates in obesity, since basal respiration was lower in abdominal as compared to femoral differentiated human multipotent adipose‐derived stem cells.116 The latter finding may underlie the higher AT pO2 in abdominal than femoral subcutaneous adipose tissue.116
In accordance with impaired mitochondrial density and oxygen consumption in obese WAT in humans, there are indications that weight loss may evoke beneficial changes in WAT mitochondrial function. Following bariatric surgery, both mitochondrial respiratory capacity and biogenesis were increased in WAT.117, 118 We have recently shown that diet‐induced weight loss increased WAT gene expression of mitochondrial biogenesis markers and non‐mitochondrial oxygen consumption pathways in humans, which may have contributed to the reduction in WAT pO2 following weight loss.74 In contrast, instead of improving WAT mitochondrial abnormalities, weight loss downregulated mitochondrial gene expression and density, and had neither effects on mitochondrial DNA transcripts nor OXPHOS proteins.119 Interestingly, the latter study showed that a higher initial mitochondrial number and gene expression was related to more successful weight loss after 12‐month follow‐up. Importantly, however, changes in gene expression do not necessarily translate into functional alterations. Taken together, it appears that oxygen consumption is impaired in obese WAT in humans, which may contribute to increased WAT pO2 in human obesity.
4. ALTERED ADIPOSE TISSUE OXYGENATION MAY CONTRIBUTE TO TISSUE DYSFUNCTION AND METABOLIC IMPAIRMENTS
In cell culture experiments investigating the molecular and cellular responses to hypoxia, cells are usually exposed to a substantially reduced level of oxygen (1% O2 is frequently employed) as compared to “normoxia” (ambient air, 21% O2). The normal physiological range of AT pO2 in human WAT is ~3%‐11% O2 or ~23‐84 mmHg.57, 59, 60, 73 Therefore, the outcomes of experiments comparing the effects of pO2 below and well‐above these physiological levels should be interpreted with caution, since results may not directly translate to the human in vivo situation. Moreover, it is important to distinguish between acute (<24 h) and more prolonged exposure to different pO2 levels, since this seems to have a major impact on the metabolic and inflammatory responses, as will be discussed later in this section.
4.1. The cellular response to low oxygen levels
As any other cell type, adipocytes must maintain and adjust their metabolic and physiological regulation in response to fluctuations in the local microenvironment, including variation in oxygen levels.25, 120 The main regulators of oxygen sensing are the oxygen sensitive HIFs. HIFs are transcription factors, binding to the DNA and changing gene expression in response to alterations in oxygen levels.121 HIFs consist of two subunits, α and β, with the former being the oxygen sensitive molecule and HIF‐1β being constitutively expressed by cells.67 The HIF family consists of three members based on the three α‐subunits, HIF‐1α, HIF‐2α and HIF‐3α, with the predominant members being HIF‐1α and HIF‐2α.27, 120, 122 HIF‐1α has received the most attention, and this transcription factor has been described as the master regulator of oxygen homeostasis. HIF‐1α is continuously synthesized and rapidly degraded in the presence of oxygen but is stabilized when oxygen levels are low, and the functional HIF‐1α transcription factor is then recruited. More specific, during sufficient oxygenation of the cells, HIF‐1α is enzymatically degraded by prolyl‐4‐hydroxylases through the proteasome.121 During “hypoxic” conditions, which are tissue‐dependent, but usually defined as <1% of oxygen in most in vitro studies, the prolyl hydroxylase domain enzymes are inactivated, and HIF‐1α is not subject to rapid degradation. Instead, HIF‐1α then forms a heterodimer with the β subunit, acting on DNA binding areas called hypoxia‐responsive elements, thus regulating gene expression of many different genes.10, 22, 25, 121, 123 These genes encode proteins involved in a multiplicity of cellular processes, including glucose and lipid metabolism, inflammation, ECM metabolism and apoptosis.25 Thus, changes in tissue oxygenation seem to affect many physiological processes in WAT, and the metabolic and inflammatory effects will be discussed in more detail below (Figure 2).
Figure 2.
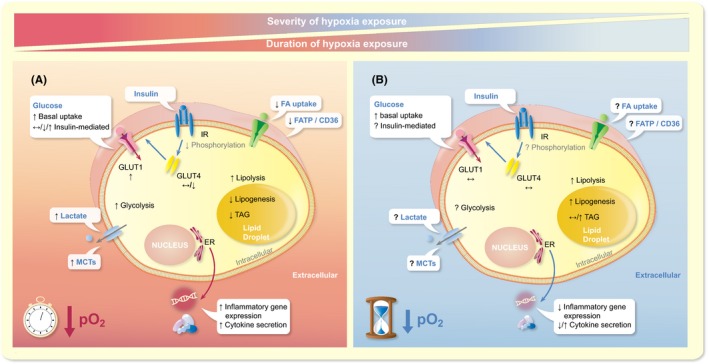
Adipocyte substrate metabolism, adipocyte gene expression and adipokine secretion are affected by alteration of oxygen partial pressure (pO2). Both the severity and the duration of hypoxia exposure seem to impact cellular processes, as explained in more detail in the text. Panel A shows the effects of acute exposure to severe hypoxia (usually 1% O2 for <24 h), while panel B illustrates the putative effects of prolonged, mild hypoxia exposure (usually 5%‐10% O2 for 7‐14 d) on adipocyte biology. ER, endoplasmic reticulum; FA, fatty acids; FATP/CD36, fatty acid transporters; GLUT, glucose transporter; IR, insulin receptor; MCTs, monocarboxylate transporters; pO2, oxygen partial pressure; TAG, triacylglycerol. ↑, increase; ↓, decrease; ↔, unchanged; ?, not determined
4.2. Metabolic effects of altered adipose tissue oxygenation
4.2.1. Glucose metabolism
Under hypoxic conditions, a shift from aerobic to anaerobic metabolism occurs, with glucose becoming the major substrate for ATP generation.25, 67, 68, 121 In vitro studies have demonstrated an increase in basal glucose uptake in human and rodent adipocytes treated acutely, up to 24 hours, with 1% vs 21% O2.65, 124, 125 Furthermore, it has been shown that glucose uptake in human adipocytes is inversely related to O2 levels (1, 3, 5, 10, 15% vs 21% O2), peaking at 1% O2.126 In accordance with these findings, prolonged exposure (14 d) to low (5% O2) but not high (10% O2) physiological pO2 levels tended to increase basal glucose uptake in differentiated human multipotent adipose‐derived stem cells.116
Conflicting findings, however, have been reported regarding the effects of pO2 on insulin‐mediated glucose uptake. Acute exposure to 1% O2 (up to 24 h) reduced insulin‐mediated glucose uptake in human adipocytes,125 indicative of impaired insulin signalling, an effect that was reversible.125 This was further illustrated by decreased phosphorylation of the insulin receptor, IRβ and IRS‐1 proteins as well as protein kinase B.65, 125 In contrast, another study found that acute 1% O2 exposure increased insulin‐dependent and insulin‐independent glucose uptake in 3T3‐L1 adipocytes.127 Interestingly, it was shown that multiple exposures of differentiating 3T3‐L1 adipocytes to transient hypoxia (1% O2, 4 h/d, 4‐8 d) enhanced insulin signalling, illustrated by increased phosphorylation of Akt (T308 and S473 residues) and GSK3β.127
Alterations in glucose uptake are because of changes in the expression and localization of the glucose transporters (GLUTs). GLUT‐1 mRNA levels were increased following exposure to acute, severe hypoxia (1%‐2% pO2, up to 24 h) in both murine (3T3‐L1) and human (pre)adipocytes.67, 126, 128, 129, 130, 131, 132, 133 In contrast, insulin‐dependent GLUT‐4 mRNA expression in human adipocytes remained unchanged 124 or was significantly reduced by acute exposure to 1% O2.124, 126, 129, 132 In line with improved insulin‐stimulated glucose uptake, GLUT‐4 but not GLUT‐1 expression was elevated in murine adipocytes exposed to transient hypoxia.127 During and after differentiation of human preadipocytes under low (5% O2) and high (10% O2) physiological pO2 levels, basal GLUT‐1 expression was not changed 134 or decreased,116 while GLUT‐4 mRNA expression remained unchanged.116, 134
Acute hypoxia exposure to 1% O2 for 24 hours also increased gene and protein expression of enzymes involved in glycolytic metabolism in human adipocytes, including glucose phosphate isomerase, pyruvate kinase and 6‐phosphofructo‐2‐kinase/fructose‐2,6‐biphosphatase.128, 133, 135, 136, 137 In accordance with these findings, the end‐product of the glycolytic pathway, lactate and the expression of genes encoding monocarboxylate transporters (MCT) mediating lactate transport were found to be increased in rodent and human adipocytes under hypoxic conditions.67, 138, 139
In conclusion, in vitro findings indicate that exposure to severe hypoxia (1%‐2% O2), and likely also low physiological pO2 (5% O2), increases basal glucose uptake and induces a switch towards glycolytic metabolism in rodent and human adipocytes, while effects on insulin‐mediated glucose uptake are conflicting (Figure 2).
4.2.2. Lipid metabolism
Few studies examined whether and how pO2 influences lipid metabolism in WAT, yielding conflicting results. FFA uptake and oxidation were significantly reduced by acute, severe hypoxia exposure (1% O2, 24 h) in 3T3‐L1 adipocytes.65, 127 Reduced uptake may be explained by reduced expression of fatty acid transport proteins, as illustrated by decreased expression of FATP and CD36 in these cells.65 Lipid storage, assessed by TAG accumulation, was reduced both by chemically induced hypoxia with CoCl2 and prolonged severe hypoxia exposure in 3T3‐L1 adipocytes (1% O2 for 14 d).140, 141 In accordance with these observations, 1% O2 exposure for 14 days decreased lipogenesis in 3T3‐L1 adipocytes.140, 141 However, 14 days of exposure to mild hypoxia exposure (4% O2), which reflects low physiological pO2, markedly increased lipogenesis and the formation of large lipid droplets in 3T3‐L1 adipocytes.140 Furthermore, another study has shown that exposure of differentiating human adipocytes to high (10% O2) but not low (5% O2) physiological pO2 for 14 days increased TAG accumulation.134 Taken together, it seems that exposure of adipocytes to severe hypoxia may reduce lipogenesis, while prolonged exposure to physiological pO2 may increase lipogenesis, but these effects need to be studied in more detail to better understand the opposing results (Figure 2).
The amount of oxygen in the microenvironment also seems to impact adipocyte lipolysis. Several studies have shown that acute exposure to severe hypoxia (1% O2) increased basal lipolysis in 3T3‐L1 adipocytes.65, 68, 125 Moreover, prolonged exposure (14 d) to severe hypoxia modestly increased basal lipolysis, while low physiological pO2 (4% O2, 14 d) exposure increased lipolysis to a much greater extent in 3T3‐L1 adipocytes. 140 In theory, insulin resistance in adipocytes might explain the increased basal lipolytic rate because of reduced insulin‐mediated suppression of lipolysis. However, since improved insulin sensitivity has also been found following hypoxia exposure, as discussed in the previous section, alternative mechanisms are likely involved in the pO2‐induced effects on basal adipocyte lipolysis. Furthermore, isoproterenol‐induced lipolysis was also significantly elevated in human adipocytes differentiated at high (10% O2) and low (5% O2) physiological pO2 as compared to exposure to ambient air (21% O2), which was accompanied by increased protein expression of the lipolytic enzyme HSL and the lipid droplet‐coating protein perilipin.134 In conclusion, hypoxia seems to increase lipolysis in rodent and human adipocytes, with more pronounced effects found under physiological pO2 (Figure 2). Clearly, more studies are required before strong conclusions can be drawn regarding the effects of oxygenation on lipid metabolism in human WAT, and to unravel underlying mechanisms.
4.3. Adipokines and inflammatory factors
Several studies have demonstrated that the expression and secretion of many adipokines are sensitive to pO2 levels. Most in vitro studies have shown that acute exposure to severe hypoxia (1% O2, up to 24 h) induces a pro‐inflammatory expression and secretion profile in (pre)adipocytes, with increased levels of TNF‐α, IL‐1, IL‐6, monocyte chemoattractant protein‐1 (MCP‐1), plasminogen activator inhibitor (PAI)‐1, macrophage‐migration‐inhibition factor and inducible‐nitric oxide synthase, in both adipocytes and SVF cells derived from human adipose tissue, as well as in murine adipose tissue resident macrophages.25, 41, 64, 142 Furthermore, several studies found that acute exposure to severe hypoxia decreased adiponectin and increased leptin expression and secretion in human and murine (pre)adipocytes.25, 63, 64, 65, 66, 129, 132, 133, 143 Adiponectin, which is often reduced in individuals with obesity, is an important adipokine that has beneficial metabolic and anti‐atherogenic properties.144, 145 Leptin, the concentrations of which are strongly positively correlated to adipose tissue mass, is an important regulator of food intake and energy expenditure, providing important feedback in relation to energy storage in the body.146
As with other in vitro studies applying acute and severe hypoxia over 1‐24 hours,25, 64, 66, 129, 132, 133 these findings should be interpreted with some caution, underlining the importance of applying more physiological conditions in cell culture experiments. Few in vitro studies have tried to better mimic physiological conditions in vivo in terms of oxygen partial pressure as well as the duration of exposure to altered pO2.116, 134 The effects of modest, rather than severe, hypoxia have also been investigated, showing a concentration‐dependent change in adipokine expression and secretion in human adipocytes.126 Interestingly, prolonged exposure of human adipose tissue‐derived mesenchymal stem cells to physiological pO2 levels (ie, 5% and 10% O2) during differentiation towards mature adipocytes appears to elicit a different expression and secretion profile as observed following acute (severe) exposure to hypoxia. More specific, we have recently demonstrated that low physiological pO2 decreased pro‐inflammatory gene expression (ie, IL‐6, PAI‐I, TNFα, MCP‐1 and dipeptidyl‐peptidase‐4 [DPP‐4]) in differentiated human adipocytes as compared to 21% and/or 10% O2, whereas more heterogeneous effects on adipokine secretion were found.116 Exposure of these cells to low physiological pO2 (5% O2) for 14 days resulted in a reduced secretion of leptin and increased adiponectin and IL‐6 secretion in these adipocytes, while no significant effects on DPP‐4 and MCP‐1 secretion were found.116 In contrast, exposure to high physiological pO2 (10% O2) increased leptin and DPP‐4, but reduced IL‐6 and MCP‐1 secretion.116 Famulla and colleagues 134 have shown increased DPP‐4, adiponectin and IL‐6 following prolonged exposure to high physiological pO2 (10% O2), while low physiological pO2 (5% O2) tended to reduce the secretion of adiponectin. These differences between studies suggest that donor characteristics may also influence the effects of pO2 on the adipocyte secretory profile.
Taken together, oxygen levels and pattern of exposure seem to have a significant impact on adipocytokine expression and secretion (Figure 2). However, many aspects of exposure have not been examined in human cells, which is important to elucidate in future experiments.
5. ALTERED TISSUE OXYGENATION IMPACTS WHOLE‐BODY PHYSIOLOGY IN HUMANS
As indicated in the previous section, the cellular response to altered oxygen levels seems to depend to a large extent on the severity and duration of exposure. Not surprisingly, the effects of changes in oxygenation on whole‐body homeostasis also seems to be determined by these factors, next to the oxygenation pattern.147 The clinical consequences of severe chronic hypoxia, as observed in patients with severe chronic obstructive pulmonary disease (COPD), and severe intermittent hypoxia as seen in patients with obstructive sleep apnoea syndrome (OSAS) are outside the scope of this review and have been discussed elsewhere.148, 149, 150, 151, 152 In this section, we will provide a brief overview of findings on the effects of altered (adipose) tissue oxygenation through physiological or experimental conditions on body weight and parameters related to cardiometabolic health.
Living at high‐altitude represents a condition of hypobaric hypoxic exposure (ie, around 15% O2 at ~3000 m) as oxygen partial pressure is relatively lower compared to sea level.147 The impact of high‐altitude habitation on chronic diseases is dependent on several factors such as ethnicity, environmental and behavioural factors that may vary across mountain dwellers.147, 153 It has been suggested that living at high‐altitude is associated with improved cardiovascular and pulmonary function.154 Many studies have demonstrated a lower prevalence of obesity, cardiovascular diseases, T2DM and cancer in populations living at high altitude.147, 153, 155, 156, 157 For example, a cross‐sectional study including 422,603 adults has shown an inverse relationship between elevation and obesity prevalence, after adjusting for temperature, diet, physical activity, smoking and demographic factors, in both males and females,158 which is in line with other studies demonstrating an inverse association between altitude and the prevalence of obesity.159, 160, 161 Interestingly, a lower prevalence of the metabolic syndrome, lower reduced fasting glucose levels and diabetes incidence have been found among highlanders.156, 162, 163, 164, 165 Noteworthy, from most of these observational studies, it cannot be concluded that exposure to lower pO2 levels has beneficial health effects, since many potential confounders such as the diet and physical activity level may have affected these findings.
Several intervention studies have been performed to elucidate the impact of exposure to altered pO2 on body weight and metabolic homeostasis (Figure 3). We have previously demonstrated that chronic exposure to hypoxia (8% vs 21% O2, 21 d) improved the WAT phenotype in C57Bl/6J mice, evidenced by decreased adipocyte size, decreased macrophage infiltration and inflammatory markers and increased expression of mitochondrial function and biogenesis markers in visceral and subcutaneous AT.166 More recently, the same concept has been applied to humans. Exposure to moderate hypoxia (15% O2) for 10 subsequent nights increased whole‐body insulin sensitivity in eight obese men.167 Since moderate hypoxia exposure also tended to reduce AT pO2 167, these findings may imply that lowering of AT pO2 by moderate hypoxia exposure may have contributed to improved insulin sensitivity.168 Furthermore, exposure to hypoxia under resting conditions increased energy expenditure and lipid metabolism, and reduced appetite and food intake.169, 170 Based on a recent systematic review, it was concluded that normobaric hypoxic conditioning, lasting from 5 days up to 8 months, may have beneficial effects on insulin levels, energy expenditure, body weight and blood pressure in rodents and humans, which may contribute to improved cardiometabolic health and body weight management in obesity.155 The putative effects of (severe) hypoxia exposure on orexigenic (ie, ghrelin) and anorexigenic (ie, leptin) peptides affecting appetite and food intake may, at least partially, underlie the effects on body weight and metabolic outcomes, as reviewed elsewhere.171, 172
Figure 3.
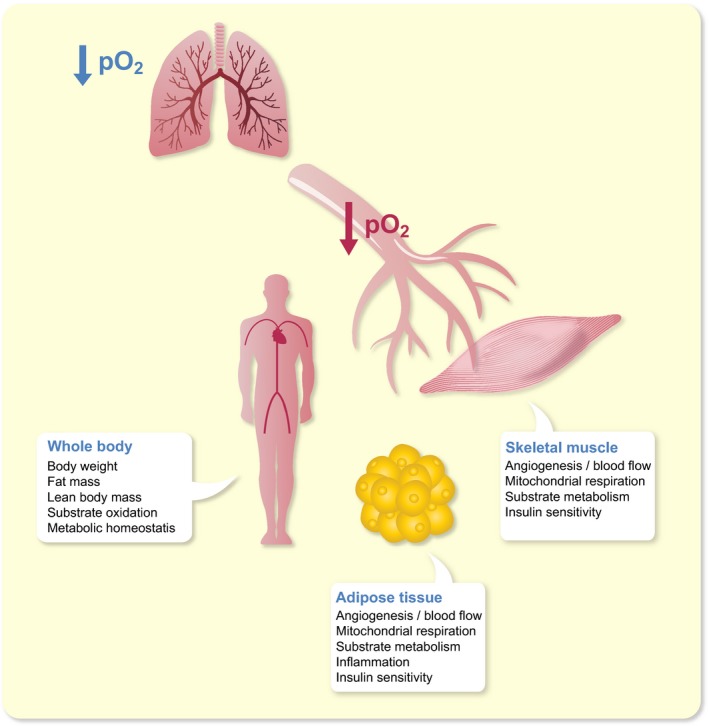
Putative impact of (moderate) hypoxia exposure on whole‐body, skeletal muscle and adipose tissue physiology. O2, oxygen; pO2, oxygen partial pressure
Interestingly, the combination of hypoxia exposure and exercise may have additive beneficial health effects in humans.147, 173 A greater decrease in total body weight, body fat mass and waist/hip ratio was found when exercise was performed under hypoxia compared to normoxia,170, 174, 175, 176 and appeared to be maintained following the intervention.177 Interestingly, hypoxia exposure also seems to exert effects on substrate oxidation but findings are conflicting, with some studies showing increased fat oxidation,178, 179 while others demonstrating increased carbohydrate oxidation both during and post‐exercise.180, 181 Furthermore, exercise training under hypoxic conditions induced a more pronounced increase in adiponectin levels compared to normoxic exercise.182 Moreover, hypoxic exercise decreased insulin levels in obese individuals, and acutely improved insulin sensitivity in T2DM patients compared to normoxic exercise.175, 183, 184 The mechanisms underlying improvements in glucose homeostasis following hypoxia exposure remain to be elucidated, but may involve insulin‐independent mechanisms. Importantly, the impact of hypoxia on cardiometabolic health may also be because of effects of altered pO2 on other organs than adipose tissue, especially during exercise.
The beneficial effects of hypoxic exercise may be mediated to a large extent by alterations at the level of skeletal muscle. During contraction, glucose uptake in skeletal muscle is increased in an insulin‐independent manner, likely involving independent effects of 5' AMP‐activated protein kinase (AMPK), mechanical stress and Ca2+/calmodulin‐dependent protein kinase kinases (CaMKKs).185 Interestingly, it has been demonstrated that hypoxia exposure increased glucose uptake in skeletal muscle cells through AMPK signalling. Therefore, hypoxia exposure during exercise might have additive or synergistic effects on peripheral glucose uptake. Indeed, exposing human myotubes to 7% O2 in combination with electrical pulse stimulation (EPS), to mimic exercise, increased glucose uptake to a higher extent than EPS under 21% O2, which seems at least partly because of an insulin‐sensitizing effect of hypoxia.186 Taken together, hypoxia exposure may improve glucose homeostasis via insulin‐dependent and insulin‐independent effects, but more studies in humans on putative underlying mechanisms are needed.
6. CONCLUSIONS AND FUTURE PERSPECTIVES
The obesity epidemic presents a major public health challenge. Novel preventive measures and treatment alternatives are urgently needed to combat obesity and its complications. Adipose tissue dysfunction in obesity is related to a plethora of metabolic and endocrine disturbances, contributing to impairments in lipid and glucose metabolism as well as immune homeostasis. It is well established that adipose tissue dysfunction has a central role in the aetiology of obesity‐related comorbidities and chronic diseases, including T2DM and cardiovascular diseases. A reduced lipid buffering capacity of hypertrophic adipose tissue in obesity results in lipid accumulation in key metabolic organs such as the liver and skeletal muscle (ie, ectopic fat storage), which is strongly associated with insulin resistance. Moreover, adipose tissue in obesity is characterized by a pro‐inflammatory phenotype. This is reflected by a phenotypic shift towards a higher abundance of pro‐inflammatory macrophages and other adaptive and innate immune cells in obese adipose tissue, leading to the production and secretion of a multitude of pro‐inflammatory cytokines, which in turn may induce insulin resistance. Besides inflammation, a disproportionate deposition of ECM components during the development of obesity may contribute to adipose tissue fibrosis and insulin resistance (Figure 1).
Adipose tissue oxygen partial pressure, determined by the balance between oxygen supply and consumption, may have a key role in the metabolic and inflammatory perturbations seen in most obese individuals. Animal models have shown lower pO2 in obese WAT (“hypoxia”). Findings in humans are conflicting, which may be because of differences between study populations in terms of the onset and physical history (eg, weight cycling) of obesity and other subjects’ characteristics (eg, age, sex, ethnicity, presence of type 2 diabetes), the WAT depot studied, and the methodology used. Nevertheless, several studies performed in our laboratory indicate that AT pO2 is higher in obese insulin resistant individuals, is positively related to insulin resistance (independently of adiposity), and is reduced after diet‐induced weight loss, which is paralleled by improved insulin sensitivity. Adipose tissue mitochondrial dysfunction (ie, reduced O2 consumption) may contribute to higher AT pO2 in obesity. There is no strong evidence to suggest that differences in pO2 within the human physiological range (ie, because of impaired blood flow) have marked effects on mitochondrial respiration. Interestingly, many in vitro experiments have demonstrated that changes in oxygen levels impact the functionality of (pre)adipocytes and immune cells, leading to alterations in glucose and lipid metabolism, as well as inflammation in adipose tissue (Figure 2). Clearly, altered pO2 may not only affect adipose tissue physiology but also whole‐body metabolic homeostasis (Figure 3). In this respect, it remains to be elucidated whether AT pO2 exerts a crucial role in the development and progression of obesity‐related complications in humans. Although several lines of evidence suggest that exposure to lower levels of oxygen may enhance whole‐body metabolic homeostasis and body weight regulation, intervention studies in humans are warranted to further investigate whether changes in tissue oxygenation may improve cardiometabolic health, thereby providing a novel strategy to combat chronic cardiometabolic diseases in obese humans.
CONFLICT OF INTEREST
The authors have declared that no conflict of interest exists.
Lempesis IG, van Meijel RLJ, Manolopoulos KN, Goossens GH. Oxygenation of adipose tissue: A human perspective. Acta Physiol. 2020;228:e13298 10.1111/apha.13298
Konstantinos N. Manolopoulos and Gijs H. Goossens contributed equally to this work.
REFERENCES
- 1. Collaborators TGO . Health effects of overweight and obesity in 195 countries over 25 years. N Engl J Med. 2017;377(1):13‐27. [DOI] [PMC free article] [PubMed] [Google Scholar]
- 2. Heymsfield SB, Wadden TA. Mechanisms, pathophysiology, and management of obesity. N Engl J Med. 2017;376(3):254‐266. [DOI] [PubMed] [Google Scholar]
- 3. González‐Muniesa P, Mártinez‐González M‐A, Hu FB, et al. Obesity. Nat Rev Dis Primers. 2017;3:17034. [DOI] [PubMed] [Google Scholar]
- 4. Zheng Y, Ley SH, Hu FB. Global aetiology and epidemiology of type 2 diabetes mellitus and its complications. Nat Rev Endocrinol. 2018;14(2):88‐98. [DOI] [PubMed] [Google Scholar]
- 5. Bray GA, Heisel WE, Afshin A, et al. The science of obesity management: an endocrine society scientific statement. Endocr Rev. 2018;39(2):79‐132. [DOI] [PMC free article] [PubMed] [Google Scholar]
- 6. Renehan AG, Tyson M, Egger M, Heller RF, Zwahlen M. Body‐mass index and incidence of cancer: a systematic review and meta‐analysis of prospective observational studies. Lancet. 2008;371(9612):569‐578. [DOI] [PubMed] [Google Scholar]
- 7. Sheree DM, Sean LM. Metabolic reprogramming in type 2 diabetes and the development of breast cancer. J Endocrinol. 2018;237(2):R35‐R46. [DOI] [PubMed] [Google Scholar]
- 8. Renehan AG, Zwahlen M, Egger M. Adiposity and cancer risk: new mechanistic insights from epidemiology. Nat Rev Cancer. 2015;15(8):484‐498. [DOI] [PubMed] [Google Scholar]
- 9. van Vliet‐Ostaptchouk JV, Nuotio M‐L, Slagter SN, et al. The prevalence of metabolic syndrome and metabolically healthy obesity in Europe: a collaborative analysis of ten large cohort studies. BMC Endocr Disord. 2014;14(1):9. [DOI] [PMC free article] [PubMed] [Google Scholar]
- 10. Blüher M. Adipose tissue dysfunction contributes to obesity related metabolic diseases. Best Pract Res Clin Endocrinol Metab. 2013;27(2):163‐177. [DOI] [PubMed] [Google Scholar]
- 11. Blüher M. Are metabolically healthy obese individuals really healthy? Eur J Endocrinol. 2014;171(6):R209‐R219. [DOI] [PubMed] [Google Scholar]
- 12. Stefan N, Häring H‐U, Hu FB, Schulze MB. Metabolically healthy obesity: epidemiology, mechanisms, and clinical implications. Lancet Diabetes Endocrinol. 2013;1(2):152‐162. [DOI] [PubMed] [Google Scholar]
- 13. Bell JA, Kivimaki M, Hamer M. Metabolically healthy obesity and risk of incident type 2 diabetes: a meta‐analysis of prospective cohort studies. Obes Rev. 2014;15(6):504‐515. [DOI] [PMC free article] [PubMed] [Google Scholar]
- 14. Eckel N, Meidtner K, Kalle‐Uhlmann T, Stefan N, Schulze MB. Metabolically healthy obesity and cardiovascular events: a systematic review and meta‐analysis. Eur J Prev Cardiol. 2016;23(9):956‐966. [DOI] [PubMed] [Google Scholar]
- 15. Kramer CK, Zinman B, Retnakaran R. Are metabolically healthy overweight and obesity benign conditions?: a systematic review and meta‐analysis. Ann Intern Med. 2013;159(11):758‐769. [DOI] [PubMed] [Google Scholar]
- 16. Appleton SL, Seaborn CJ, Visvanathan R, et al. Diabetes and cardiovascular disease outcomes in the metabolically healthy obese phenotype. Diabetes Care. 2013;36(8):2388. [DOI] [PMC free article] [PubMed] [Google Scholar]
- 17. Goossens GH. The role of adipose tissue dysfunction in the pathogenesis of obesity‐related insulin resistance. Physiol Behav. 2008;94(2):206‐218. [DOI] [PubMed] [Google Scholar]
- 18. Goossens GH, Blaak EE. Adipose tissue dysfunction and impaired metabolic health in human obesity: a matter of oxygen? Front Endocrinol. 2015;6:55. [DOI] [PMC free article] [PubMed] [Google Scholar]
- 19. Goossens GH. The metabolic phenotype in obesity: fat mass, body fat distribution, and adipose tissue function. Obes Facts. 2017;10(3):207‐215. [DOI] [PMC free article] [PubMed] [Google Scholar]
- 20. Shulman GI. Ectopic fat in insulin resistance, dyslipidemia, and cardiometabolic disease. N Engl J Med. 2014;371(12):1131‐1141. [DOI] [PubMed] [Google Scholar]
- 21. Frayn KN, Karpe F. Regulation of human subcutaneous adipose tissue blood flow. Int J Obes. 2014;38(8):1019‐1026. [DOI] [PubMed] [Google Scholar]
- 22. Reilly SM, Saltiel AR. Adapting to obesity with adipose tissue inflammation. Nat Rev Endocrinol. 2017;13:633. [DOI] [PubMed] [Google Scholar]
- 23. Rosen ED, Spiegelman BM. What we talk about when we talk about fat. Cell. 2014;156(1‐2):20‐44. [DOI] [PMC free article] [PubMed] [Google Scholar]
- 24. Sun S, Ji Y, Kersten S, Qi L. Mechanisms of inflammatory responses in obese adipose tissue. Annu Rev Nutr. 2012;32(1):261‐286. [DOI] [PMC free article] [PubMed] [Google Scholar]
- 25. Trayhurn P. Hypoxia and adipose tissue function and dysfunction in obesity. Physiol Rev. 2013;93(1):1‐21. [DOI] [PubMed] [Google Scholar]
- 26. Trayhurn P, Wood IS. Adipokines: inflammation and the pleiotropic role of white adipose tissue. Br J Nutr. 2004;92(3):347‐355. [DOI] [PubMed] [Google Scholar]
- 27. Crewe C, An YA, Scherer PE. The ominous triad of adipose tissue dysfunction: inflammation, fibrosis, and impaired angiogenesis. J Clin Investig. 2017;127(1):74‐82. [DOI] [PMC free article] [PubMed] [Google Scholar]
- 28. Jo J, Gavrilova O, Pack S, et al. Hypertrophy and/or hyperplasia: dynamics of adipose tissue growth. PLoS Comput Biol. 2009;5(3):e1000324. [DOI] [PMC free article] [PubMed] [Google Scholar]
- 29. White U, Ravussin E. Dynamics of adipose tissue turnover in human metabolic health and disease. Diabetologia. 2019;62(1):17‐23. [DOI] [PMC free article] [PubMed] [Google Scholar]
- 30. Spalding KL, Arner E, Westermark PO, et al. Dynamics of fat cell turnover in humans. Nature. 2008; 453(7196):783‐787. [DOI] [PubMed] [Google Scholar]
- 31. Haczeyni F, Bell‐Anderson KS, Farrell GC. Causes and mechanisms of adipocyte enlargement and adipose expansion. Obes Rev. 2018;19(3):406‐420. [DOI] [PubMed] [Google Scholar]
- 32. Unger RH. Lipid overload and overflow: metabolic trauma and the metabolic syndrome. Trends Endocrinol Metab. 2003;14(9):398‐403. [DOI] [PubMed] [Google Scholar]
- 33. Frayn K. Adipose tissue as a buffer for daily lipid flux. Diabetologia. 2002;45(9):1201‐1210. [DOI] [PubMed] [Google Scholar]
- 34. Hodson L, Humphreys SM, Karpe F, Frayn KN. Metabolic signatures of human adipose tissue hypoxia in obesity. Diabetes. 2013;62(5):1417‐1425. [DOI] [PMC free article] [PubMed] [Google Scholar]
- 35. Trouwborst I, Bowser SM, Goossens GH, Blaak EE. Ectopic Fat Accumulation in distinct insulin resistant phenotypes; targets for personalized nutritional interventions. Front Nutr. 2018;5:77. [DOI] [PMC free article] [PubMed] [Google Scholar]
- 36. Skurk T, Alberti‐Huber C, Herder C, Hauner H. Relationship between adipocyte size and adipokine expression and secretion. J Clin Endocrinol Metab. 2007;92(3):1023‐1033. [DOI] [PubMed] [Google Scholar]
- 37. Wernstedt Asterholm I, Tao C, Morley T, et al. Adipocyte inflammation is essential for healthy adipose tissue expansion and remodeling. Cell Metab. 2014;20(1):103‐118. [DOI] [PMC free article] [PubMed] [Google Scholar]
- 38. Pollack RM, Donath MY, LeRoith D, Leibowitz G. Anti‐inflammatory agents in the treatment of diabetes and its vascular complications. Diabetes Care. 2016;39(Suppl 2):S244‐S252. [DOI] [PubMed] [Google Scholar]
- 39. Lee B‐C, Lee J. Cellular and molecular players in adipose tissue inflammation in the development of obesity‐induced insulin resistance. Biochim Biophys Acta. 2014;1842(3):446‐462. [DOI] [PMC free article] [PubMed] [Google Scholar]
- 40. Medzhitov R. Origin and physiological roles of inflammation. Nature. 2008; 454(7203):428‐435. [DOI] [PubMed] [Google Scholar]
- 41. O'Rourke RW, White AE, Metcalf MD, et al. Hypoxia‐induced inflammatory cytokine secretion in human adipose tissue stromovascular cells. Diabetologia. 2011;54(6):1480‐1490. [DOI] [PMC free article] [PubMed] [Google Scholar]
- 42. McLaughlin T, Ackerman SE, Shen L, Engleman E. Role of innate and adaptive immunity in obesity‐associated metabolic disease. J Clin Investig. 2017;127(1):5‐13. [DOI] [PMC free article] [PubMed] [Google Scholar]
- 43. McNelis Joanne C, Olefsky JM. Macrophages, immunity, and metabolic disease. Immunity. 2014;41(1):36‐48. [DOI] [PubMed] [Google Scholar]
- 44. Weisberg SP, McCann D, Desai M, Rosenbaum M, Leibel RL, Ferrante AW, Jr . Obesity is associated with macrophage accumulation in adipose tissue. J Clin Investig. 2003;112(12):1796‐1808. [DOI] [PMC free article] [PubMed] [Google Scholar]
- 45. Kumari M, Heeren J, Scheja L. Regulation of immunometabolism in adipose tissue. Semin Immunopathol. 2018;40(2):189‐202. [DOI] [PubMed] [Google Scholar]
- 46. Martinez FO, Gordon S. The M1 and M2 paradigm of macrophage activation: time for reassessment. F1000Prime Rep. 2014;6:13. [DOI] [PMC free article] [PubMed] [Google Scholar]
- 47. Arango Duque G, Descoteaux A. Macrophage cytokines: involvement in immunity and infectious diseases. Front Immunol. 2014;5:491. [DOI] [PMC free article] [PubMed] [Google Scholar]
- 48. Caricilli AM, Nascimento PH, Pauli JR, et al. Inhibition of toll‐like receptor 2 expression improves insulin sensitivity and signaling in muscle and white adipose tissue of mice fed a high‐fat diet. J Endocrinol. 2008;199(3):399‐406. [DOI] [PubMed] [Google Scholar]
- 49. Saberi M, Woods N‐B, de Luca C, et al. Hematopoietic cell‐specific deletion of toll‐like receptor 4 ameliorates hepatic and adipose tissue insulin resistance in high‐fat‐fed mice. Cell Metab. 2009;10(5):419‐429. [DOI] [PMC free article] [PubMed] [Google Scholar]
- 50. Lumeng CN, Bodzin JL, Saltiel AR. Obesity induces a phenotypic switch in adipose tissue macrophage polarization. J Clin Investig. 2007;117(1):175‐184. [DOI] [PMC free article] [PubMed] [Google Scholar]
- 51. Koh TJ, DiPietro LA. Inflammation and wound healing: the role of the macrophage. Expert Rev Mol Med. 2011;13:e23. [DOI] [PMC free article] [PubMed] [Google Scholar]
- 52. Mills C. M1 and M2 macrophages: oracles of health and disease. Crit Rev Immunol. 2012;32(6):463‐488. [DOI] [PubMed] [Google Scholar]
- 53. Fujisaka S, Usui I, Bukhari A, et al. Regulatory mechanisms for adipose tissue M1 and M2 macrophages in diet‐induced obese mice. Diabetes. 2009;58(11):2574‐2582. [DOI] [PMC free article] [PubMed] [Google Scholar]
- 54. Appari M, Channon KM, McNeill E. Metabolic regulation of adipose tissue macrophage function in obesity and diabetes. Antioxid Redox Signal. 2018;29(3):297‐312. [DOI] [PMC free article] [PubMed] [Google Scholar]
- 55. Tarique AA, Logan J, Thomas E, Holt PG, Sly PD, Fantino E. Phenotypic, functional, and plasticity features of classical and alternatively activated human macrophages. Am J Respir Cell Mol Biol. 2015;53(5):676‐688. [DOI] [PubMed] [Google Scholar]
- 56. Mariman E, Wang P. Adipocyte extracellular matrix composition, dynamics and role in obesity. Cell Mol Life Sci. 2010;67(8):1277‐1292. [DOI] [PMC free article] [PubMed] [Google Scholar]
- 57. Lawler HM, Underkofler CM, Kern PA, Erickson C, Bredbeck B, Rasouli N. Adipose tissue hypoxia, inflammation, and fibrosis in obese insulin‐sensitive and obese insulin‐resistant subjects. J Clin Endocrinol Metab. 2016;101(4):1422‐1428. [DOI] [PMC free article] [PubMed] [Google Scholar]
- 58. Khan T, Muise ES, Iyengar P, et al. Metabolic dysregulation and adipose tissue fibrosis: role of collagen VI. Mol Cell Biol. 2009;29(6):1575‐1591. [DOI] [PMC free article] [PubMed] [Google Scholar]
- 59. Goossens GH, Bizzarri A, Venteclef N, et al. Increased adipose tissue oxygen tension in obese compared with lean men is accompanied by insulin resistance, impaired adipose tissue capillarization, and inflammation. Circulation. 2011;124(1):67‐76. [DOI] [PubMed] [Google Scholar]
- 60. Pasarica M, Sereda OR, Redman LM, et al. Reduced adipose tissue oxygenation in human obesity: evidence for rarefaction, macrophage chemotaxis, and inflammation without an angiogenic response. Diabetes. 2009;58(3):718‐725. [DOI] [PMC free article] [PubMed] [Google Scholar]
- 61. Lefere S, Van Steenkiste C, Verhelst X, Van Vlierberghe H, Devisscher L, Geerts A. Hypoxia‐regulated mechanisms in the pathogenesis of obesity and non‐alcoholic fatty liver disease. Cell Mol Life Sci. 2016;73(18):3419‐3431. [DOI] [PMC free article] [PubMed] [Google Scholar]
- 62. Hodson L. Adipose tissue oxygenation. Adipocyte. 2014;3(1):75‐80. [DOI] [PMC free article] [PubMed] [Google Scholar]
- 63. Rausch ME, Weisberg S, Vardhana P, Tortoriello DV. Obesity in C57BL/6J mice is characterized by adipose tissue hypoxia and cytotoxic T‐cell infiltration. Int J Obes. 2007;32:451. [DOI] [PubMed] [Google Scholar]
- 64. Ye J, Gao Z, Yin J, He Q. Hypoxia is a potential risk factor for chronic inflammation and adiponectin reduction in adipose tissue of ob/ob and dietary obese mice. Am J Physiol Endocrinol Metab. 2007;293(4):E1118‐E1128. [DOI] [PubMed] [Google Scholar]
- 65. Yin J, Gao Z, He Q, Zhou D, Guo Z, Ye J. Role of hypoxia in obesity‐induced disorders of glucose and lipid metabolism in adipose tissue. Am J Physiol Endocrinol Metab. 2009;296(2):E333‐E342. [DOI] [PMC free article] [PubMed] [Google Scholar]
- 66. Hosogai N, Fukuhara A, Oshima K, Miyata Y, Tanaka S, Segawa K. Adipose tissue hypoxia in obesity and its impact on adipocytokine dysregulation. Diabetes. 2007;56. [DOI] [PubMed] [Google Scholar]
- 67. Trayhurn P. Hypoxia and adipocyte physiology: implications for adipose tissue dysfunction in obesity. Annu Rev Nutr. 2014;34(1):207‐236. [DOI] [PubMed] [Google Scholar]
- 68. Goossens GH, Blaak EE. Adipose tissue oxygen tension: implications for chronic metabolic and inflammatory diseases. Curr Opin Clin Nutr Metab Care. 2012;15(6):539‐546. [DOI] [PubMed] [Google Scholar]
- 69. Kabon M, Nagele R, Reddy M, et al. Obesity decreases perioperative tissue oxygenation. Anesthesiology. 2004;100(2):274‐280. [DOI] [PMC free article] [PubMed] [Google Scholar]
- 70. Fleischmann E, Kurz A, Niedermayr M, et al. Tissue oxygenation in obese and non‐obese patients during laparoscopy. Obes Surg. 2005;15(6):813‐819. [DOI] [PMC free article] [PubMed] [Google Scholar]
- 71. Hiltebrand LB, Kaiser HA, Niedhart DJ, Pestel G, Kurz A. Subcutaneous oxygen pressure in spontaneously breathing lean and obese volunteers: a pilot study. Obes Surg. 2008;18(1):77‐83. [DOI] [PubMed] [Google Scholar]
- 72. Kaiser HA, Kaiser DJ, Krejci V, Saager L, Erdoes G, Hiltebrand LB. Subcutaneous perfusion before and during surgery in obese and nonobese patients. Wound Repair Regen. 2016;24(1):175‐180. [DOI] [PubMed] [Google Scholar]
- 73. Goossens GH, Vogel M, Vink RG, Mariman EC, van Baak MA, Blaak EE. Adipose tissue oxygenation is associated with insulin sensitivity independently of adiposity in obese men and women. Diabetes Obes Metab. 2018;20(9):2286‐2290. [DOI] [PubMed] [Google Scholar]
- 74. Vink RG, Roumans NJ, Čajlaković M, et al. Diet‐induced weight loss decreases adipose tissue oxygen tension with parallel changes in adipose tissue phenotype and insulin sensitivity in overweight humans. Int J Obes. 2017;41:722. [DOI] [PubMed] [Google Scholar]
- 75. Ozmen F, Ozmen MM, Gelecek S, Bilgic I, Moran M, Sahin TT. STEAP4 and HIF‐1alpha gene expressions in visceral and subcutaneous adipose tissue of the morbidly obese patients. Mol Immunol. 2016;73:53‐59. [DOI] [PubMed] [Google Scholar]
- 76. Kotze‐Horstmann LM, Keswell D, Adams K, Dlamini T, Goedecke JH. Hypoxia and extra‐cellular matrix gene expression in adipose tissue associates with reduced insulin sensitivity in black South African women. Endocrine. 2017;55(1):144‐152. [DOI] [PubMed] [Google Scholar]
- 77. Frasca D, Diaz A, Romero M, Thaller S, Blomberg BB. Secretion of autoimmune antibodies in the human subcutaneous adipose tissue. PLoS ONE. 2018;13(5):e0197472. [DOI] [PMC free article] [PubMed] [Google Scholar]
- 78. Trayhurn P, Wang B, Wood IS. HIF‐1α protein rather than mRNA as a marker of hypoxia in adipose tissue in obesity: focus on “Inflammation is associated with a decrease of lipogenic factors in omental fat in women,” by Poulain‐Godefroy et al. Am J Physiol Regul Integr Comp Physiol. 2008;295(4):R1097. [DOI] [PubMed] [Google Scholar]
- 79. Vendrell J, Maymó‐Masip E, Tinahones F, et al. Tumor necrosis‐like weak inducer of apoptosis as a proinflammatory cytokine in human adipocyte cells: up‐regulation in severe obesity is mediated by inflammation but not hypoxia. J Clin Endocrinol Metab. 2010;95(6):2983‐2992. [DOI] [PubMed] [Google Scholar]
- 80. Pfeiffer S, Kruger J, Maierhofer A, et al. Hypoxia‐inducible factor 3A gene expression and methylation in adipose tissue is related to adipose tissue dysfunction. Sci Rep. 2016;6:27969. [DOI] [PMC free article] [PubMed] [Google Scholar]
- 81. Demerath EW, Guan W, Grove ML, et al. Epigenome‐wide association study (EWAS) of BMI, BMI change and waist circumference in African American adults identifies multiple replicated loci. Hum Mol Genet. 2015;24(15):4464‐4479. [DOI] [PMC free article] [PubMed] [Google Scholar]
- 82. Ronn T, Volkov P, Gillberg L, et al. Impact of age, BMI and HbA1c levels on the genome‐wide DNA methylation and mRNA expression patterns in human adipose tissue and identification of epigenetic biomarkers in blood. Hum Mol Genet. 2015;24(13):3792‐3813. [DOI] [PubMed] [Google Scholar]
- 83. Dick KJ, Nelson CP, Tsaprouni L, et al. DNA methylation and body‐mass index: a genome‐wide analysis. Lancet. 2014;383(9933):1990‐1998. [DOI] [PubMed] [Google Scholar]
- 84. Cancello R, Henegar C, Viguerie N, et al. Reduction of macrophage infiltration and chemoattractant gene expression changes in white adipose tissue of morbidly obese subjects after surgery‐induced weight loss. Diabetes. 2005;54(8):2277‐2286. [DOI] [PubMed] [Google Scholar]
- 85. He Q, Gao Z, Yin J, Zhang J, Yun Z, Ye J. Regulation of HIF‐1α activity in adipose tissue by obesity‐associated factors: adipogenesis, insulin, and hypoxia. Am J Physiol Endocrinol Metab. 2011;300(5):E877‐E885. [DOI] [PMC free article] [PubMed] [Google Scholar]
- 86. VanPelt DW, Guth LM, Horowitz JF. Aerobic exercise elevates markers of angiogenesis and macrophage IL‐6 gene expression in the subcutaneous adipose tissue of overweight‐to‐obese adults. J Appl Physiol. 2017;123(5):1150‐1159. [DOI] [PMC free article] [PubMed] [Google Scholar]
- 87. Girgis CM, Cheng K, Scott CH, Gunton JE. Novel links between HIFs, type 2 diabetes, and metabolic syndrome. Trends Endocrinol Metab. 2012;23(8):372‐380. [DOI] [PubMed] [Google Scholar]
- 88. Miranda M, Escoté X, Ceperuelo‐Mallafré V, et al. Relation between human LPIN1, hypoxia and endoplasmic reticulum stress genes in subcutaneous and visceral adipose tissue. Int J Obes. 2010;34:679. [DOI] [PubMed] [Google Scholar]
- 89. Spencer M, Unal R, Zhu B, et al. Adipose tissue extracellular matrix and vascular abnormalities in obesity and insulin resistance. J Clin Endocrinol Metab. 2011;96(12):E1990‐E1998. [DOI] [PMC free article] [PubMed] [Google Scholar]
- 90. Sun K, Tordjman J, Clément K, Scherer PE. Fibrosis and adipose tissue dysfunction. Cell Metab. 2013;18(4):470‐477. [DOI] [PMC free article] [PubMed] [Google Scholar]
- 91. Dimitriadis G, Lambadiari V, Mitrou P, et al. Impaired postprandial blood flow in adipose tissue may be an early marker of insulin resistance in type 2 diabetes. Diabetes Care. 2007;30(12):3128‐3130. [DOI] [PubMed] [Google Scholar]
- 92. Emanuel AL, Meijer RI, Muskiet M, van Raalte DH, Eringa EC, Serné EH. Role of insulin‐stimulated adipose tissue perfusion in the development of whole‐body insulin resistance. Arterioscler Thromb Vasc Biol. 2017;37(3):411‐418. [DOI] [PubMed] [Google Scholar]
- 93. Blaak EE, van Baak MA, Kemerink GJ, Pakbiers M, Heidendal G, Saris W. β‐adrenergic stimulation and abdominal subcutaneous fat blood flow in lean, obese, and reduced‐obese subjects. Metabolism. 1995;44(2):183‐187. [DOI] [PubMed] [Google Scholar]
- 94. Goossens Gijs H, Jocken Johan WE, Blaak Ellen E, Schiffers Paul M, Saris Wim HM, van Baak MA. Endocrine role of the renin‐angiotensin system in human adipose tissue and muscle. Hypertension. 2007;49(3):542‐547. [DOI] [PubMed] [Google Scholar]
- 95. Virtanen KA, Lönnroth P, Parkkola R, et al. Glucose uptake and perfusion in subcutaneous and visceral adipose tissue during insulin stimulation in nonobese and obese humans. J Clin Endocrinol Metab. 2002;87(8):3902‐3910. [DOI] [PubMed] [Google Scholar]
- 96. Karpe F, Fielding BA, Ilic V, Macdonald IA, Summers L, Frayn KN. Impaired postprandial adipose tissue blood flow response is related to aspects of insulin sensitivity. Diabetes. 2002;51(8):2467‐2473. [DOI] [PubMed] [Google Scholar]
- 97. Manolopoulos KN, Karpe F, Frayn KN. Marked resistance of femoral adipose tissue blood flow and lipolysis to adrenaline in vivo. Diabetologia. 2012;55(11):3029‐3037. [DOI] [PubMed] [Google Scholar]
- 98. Goossens GH, Blaak EE, Van Baak MA. Possible involvement of the adipose tissue renin‐angiotensin system in the pathophysiology of obesity and obesity‐related disorders. Obes Rev. 2003;4(1):43‐55. [DOI] [PubMed] [Google Scholar]
- 99. Elia M. Organ and tissue contribution to metabolic rate In: Kinney JM, ed. Energy Metabolism, Tissue Determinants and Cellular Corollaries. New York, NY: Raven Press; 1992:61‐80. [Google Scholar]
- 100. Ames BN, Shigenaga MK, Hagen TM. Mitochondrial decay in aging. Biochim Biophys Acta. 1995;1271(1):165‐170. [DOI] [PubMed] [Google Scholar]
- 101. Rolfe DF, Brown GC. Cellular energy utilization and molecular origin of standard metabolic rate in mammals. Physiol Rev. 1997;77(3):731‐758. [DOI] [PubMed] [Google Scholar]
- 102. Levin BE, Finnegan MB, Marquet E, Sullivan AC. Defective brown adipose oxygen consumption in obese Zucker rats. Am J Physiol Endocrinol Metab. 1984;247(1):E94‐E100. [DOI] [PubMed] [Google Scholar]
- 103. Wilson‐Fritch L, Nicoloro S, Chouinard M, et al. Mitochondrial remodeling in adipose tissue associated with obesity and treatment with rosiglitazone. J Clin Investig. 2004;114(9):1281‐1289. [DOI] [PMC free article] [PubMed] [Google Scholar]
- 104. Rong JX, Qiu Y, Hansen MK, et al. Adipose mitochondrial biogenesis is suppressed in db/db and high‐fat diet‐fed mice and improved by rosiglitazone. Diabetes. 2007;56(7):1751‐1760. [DOI] [PubMed] [Google Scholar]
- 105. Choo H‐J, Kim J‐H, Kwon O‐B, et al. Mitochondria are impaired in the adipocytes of type 2 diabetic mice. Diabetologia. 2006;49(4):784‐791. [DOI] [PubMed] [Google Scholar]
- 106. Kusminski CM, Scherer PE. Mitochondrial dysfunction in white adipose tissue. Trends Endocrinol Metab. 2012;23(9):435‐443. [DOI] [PMC free article] [PubMed] [Google Scholar]
- 107. Lee YS, Kim JW, Osborne O, et al. Increased adipocyte O2 consumption triggers HIF‐1alpha, causing inflammation and insulin resistance in obesity. Cell. 2014;157(6):1339‐1352. [DOI] [PMC free article] [PubMed] [Google Scholar]
- 108. Tormos Kathryn V, Anso E, Hamanaka Robert B, et al. Mitochondrial complex III ROS regulate adipocyte differentiation. Cell Metab. 2011;14(4):537‐544. [DOI] [PMC free article] [PubMed] [Google Scholar]
- 109. Klimčáková E, Roussel B, Márquez‐Quiñones A, et al. Worsening of obesity and metabolic status yields similar molecular adaptations in human subcutaneous and visceral adipose tissue: decreased metabolism and increased immune response. J Clin Endocrinol Metab. 2011;96(1):E73‐E82. [DOI] [PubMed] [Google Scholar]
- 110. Ruegsegger GN, Creo AL, Cortes TM, Dasari S, Nair KS. Altered mitochondrial function in insulin‐deficient and insulin‐resistant states. J Clin Investig. 2018;128(9):3671‐3681. [DOI] [PMC free article] [PubMed] [Google Scholar]
- 111. Fischer B, Schöttl T, Schempp C, et al. Inverse relationship between body mass index and mitochondrial oxidative phosphorylation capacity in human subcutaneous adipocytes. Am J Physiol Endocrinol Metab. 2015;309(4):E380‐E387. [DOI] [PubMed] [Google Scholar]
- 112. Lindinger PW, Christe M, Eberle AN, et al. Important mitochondrial proteins in human omental adipose tissue show reduced expression in obesity. J Proteomics. 2015;124:79‐87. [DOI] [PubMed] [Google Scholar]
- 113. Heinonen S, Muniandy M, Buzkova J, et al. Mitochondria‐related transcriptional signature is downregulated in adipocytes in obesity: a study of young healthy MZ twins. Diabetologia. 2017;60(1):169‐181. [DOI] [PubMed] [Google Scholar]
- 114. Heinonen S, Buzkova J, Muniandy M, et al. Impaired mitochondrial biogenesis in adipose tissue in acquired obesity. Diabetes. 2015;64(9):3135‐3145. [DOI] [PubMed] [Google Scholar]
- 115. Yin X, Lanza IR, Swain JM, Sarr MG, Nair KS, Jensen MD. Adipocyte mitochondrial function is reduced in human obesity independent of fat cell size. J Clin Endocrinol Metab. 2014;99(2):E209‐E216. [DOI] [PMC free article] [PubMed] [Google Scholar]
- 116. Vogel M, Jocken J, Sell H, et al. Differences in upper and lower‐body adipose tissue oxygen tension contribute to the adipose tissue phenotype in humans. J Clin Endocrinol Metab. 2018;103(10):3688‐3697. [DOI] [PubMed] [Google Scholar]
- 117. Jahansouz C, Serrot FJ, Frohnert BI, et al. Roux‐en‐Y gastric bypass acutely decreases protein carbonylation and increases expression of mitochondrial biogenesis genes in subcutaneous adipose tissue. Obes Surg. 2015;25(12):2376‐2385. [DOI] [PMC free article] [PubMed] [Google Scholar]
- 118. Hansen M, Lund MT, Gregers E, et al. Adipose tissue mitochondrial respiration and lipolysis before and after a weight loss by diet and RYGB. Obesity. 2015;23(10):2022‐2029. [DOI] [PubMed] [Google Scholar]
- 119. Jokinen R, Rinnankoski‐Tuikka R, Kaye S, et al. Adipose tissue mitochondrial capacity associates with long‐term weight loss success. Int J Obes. 2017; 42(4):817‐825. [DOI] [PubMed] [Google Scholar]
- 120. Palmer BF, Clegg DJ. Oxygen sensing and metabolic homeostasis. Mol Cell Endocrinol. 2014;397(1):51‐58. [DOI] [PubMed] [Google Scholar]
- 121. Schito L, Rey S. Cell‐Autonomous metabolic reprogramming in hypoxia. Trends Cell Biol. 2018;28(2):128‐142. [DOI] [PubMed] [Google Scholar]
- 122. Keith B, Johnson RS, Simon MC. HIF1α and HIF2α: sibling rivalry in hypoxic tumour growth and progression. Nat Rev Cancer. 2011;12:9. [DOI] [PMC free article] [PubMed] [Google Scholar]
- 123. Eltzschig HK, Carmeliet P. Hypoxia and Inflammation. N Engl J Med. 2011;364(7):656‐665. [DOI] [PMC free article] [PubMed] [Google Scholar]
- 124. Wood IS, Wang B, Lorente‐Cebrian S, Trayhurn P. Hypoxia increases expression of selective facilitative glucose transporters (GLUT) and 2‐deoxy‐D‐glucose uptake in human adipocytes. Biochem Biophys Res Commun. 2007;361(2):468‐473. [DOI] [PMC free article] [PubMed] [Google Scholar]
- 125. Regazzetti C, Peraldi P, Grémeaux T, Najem‐Lendom R, Ben‐Sahra I, Cormont M. Hypoxia decreases insulin signaling pathways in adipocytes. Diabetes. 2009;58. [DOI] [PMC free article] [PubMed] [Google Scholar]
- 126. Wood IS, Stezhka T, Trayhurn P. Modulation of adipokine production, glucose uptake and lactate release in human adipocytes by small changes in oxygen tension. Pflugers Arch. 2011;462(3):469‐477. [DOI] [PubMed] [Google Scholar]
- 127. Lu H, Gao Z, Zhao Z, Weng J, Ye J. Transient hypoxia reprograms differentiating adipocytes for enhanced insulin sensitivity and triglyceride accumulation. Int J Obes. 2015;40:121. [DOI] [PMC free article] [PubMed] [Google Scholar]
- 128. Geiger K, Leiherer A, Muendlein A, et al. Identification of Hypoxia‐Induced Genes in Human SGBS Adipocytes by Microarray Analysis. PLoS ONE. 2011;6(10):e26465. [DOI] [PMC free article] [PubMed] [Google Scholar]
- 129. Wang B, Wood IS, Trayhurn P. Dysregulation of the expression and secretion of inflammation‐related adipokines by hypoxia in human adipocytes. Pflugers Arch. 2007;455(3):479‐492. [DOI] [PMC free article] [PubMed] [Google Scholar]
- 130. Wang B, Wood IS, Trayhurn P. Hypoxia induces leptin gene expression and secretion in human preadipocytes: differential effects of hypoxia on adipokine expression by preadipocytes. J Endocrinol. 2008;198(1):127‐134. [DOI] [PubMed] [Google Scholar]
- 131. Yu J, Shi L, Wang H, et al. Conditioned medium from hypoxia‐treated adipocytes renders muscle cells insulin resistant. Eur J Cell Biol. 2011;90(12):1000‐1015. [DOI] [PubMed] [Google Scholar]
- 132. Famulla S, Horrighs A, Cramer A, Sell H, Eckel J. Hypoxia reduces the response of human adipocytes towards TNFalpha resulting in reduced NF‐kappaB signaling and MCP‐1 secretion. Int J Obes. 2012;36(7):986‐992. [DOI] [PubMed] [Google Scholar]
- 133. Wang B, Wood IS, Trayhurn P. PCR arrays identify metallothionein‐3 as a highly hypoxia‐inducible gene in human adipocytes. Biochem Biophys Res Commun. 2008;368(1):88‐93. [DOI] [PMC free article] [PubMed] [Google Scholar]
- 134. Famulla S, Schlich R, Sell H, Eckel J. Differentiation of human adipocytes at physiological oxygen levels results in increased adiponectin secretion and isoproterenol‐stimulated lipolysis. Adipocyte. 2012;1(3):132‐181. [DOI] [PMC free article] [PubMed] [Google Scholar]
- 135. Mazzatti D, Lim FL, O'Hara A, Wood IS, Trayhurn P. A microarray analysis of the hypoxia‐induced modulation of gene expression in human adipocytes. Arch Physiol Biochem. 2012;118(3):112‐120. [DOI] [PubMed] [Google Scholar]
- 136. Choi S, Cho K, Kim J, et al. Comparative proteome analysis using amine‐reactive isobaric tagging reagents coupled with 2D LC/MS/MS in 3T3‐L1 adipocytes following hypoxia or normoxia. Biochem Biophys Res Commun. 2009;383(1):135‐140. [DOI] [PubMed] [Google Scholar]
- 137. Okar DA, Wu C, Lange AJ. Regulation of the regulatory enzyme, 6‐phosphofructo‐2‐kinase/fructose‐2,6‐bisphosphatase. Adv Enzyme Regul. 2004;44(1):123‐154. [DOI] [PubMed] [Google Scholar]
- 138. Lolmède K, Durand de Saint Front V, Galitzky J, Lafontan M, Bouloumié A. Effects of hypoxia on the expression of proangiogenic factors in differentiated 3T3‐F442A adipocytes. Int J Obes. 2003;27:1187. [DOI] [PubMed] [Google Scholar]
- 139. Perez de Heredia F, Wood IS, Trayhurn P. Hypoxia stimulates lactate release and modulates monocarboxylate transporter (MCT1, MCT2, and MCT4) expression in human adipocytes. Pflugers Arch. 2010;459(3):509‐518. [DOI] [PubMed] [Google Scholar]
- 140. Weiszenstein M, Musutova M, Plihalova A, et al. Adipogenesis, lipogenesis and lipolysis is stimulated by mild but not severe hypoxia in 3T3‐L1 cells. Biochem Biophys Res Comm. 2016;478(2):727‐732. [DOI] [PubMed] [Google Scholar]
- 141. Wree A, Mayer A, Westphal S, et al. Adipokine expression in brown and white adipocytes in response to hypoxia. J Endocrinol Invest. 2012;35(5):522‐527. [DOI] [PubMed] [Google Scholar]
- 142. Gonzalez‐Muniesa P, Garcia‐Gerique L, Quintero P, Arriaza S, Lopez‐Pascual A, Martinez JA. Effects of hyperoxia on oxygen‐related inflammation with a focus on obesity. Oxid Med Cell Longev. 2016;2016:8957827. [DOI] [PMC free article] [PubMed] [Google Scholar]
- 143. Grosfeld A, Zilberfarb V, Turban S, André J, Guerre‐Millo M, Issad T. Hypoxia increases leptin expression in human PAZ6 adipose cells. Diabetologia. 2002;45(4):527‐530. [DOI] [PubMed] [Google Scholar]
- 144. Yamauchi T, Kamon J, Ito Y, et al. Cloning of adiponectin receptors that mediate antidiabetic metabolic effects. Nature. 2003;423:762. [DOI] [PubMed] [Google Scholar]
- 145. Lara‐Castro C, Luo N, Wallace P, Klein RL, Garvey WT. Adiponectin multimeric complexes and the metabolic syndrome trait cluster. Diabetes. 2006;55(1):249‐259. [PubMed] [Google Scholar]
- 146. Dardeno TA, Chou SH, Moon H‐S, Chamberland JP, Fiorenza CG, Mantzoros CS. Leptin in human physiology and therapeutics. Front Neuroendocrinol. 2010;31(3):377‐393. [DOI] [PMC free article] [PubMed] [Google Scholar]
- 147. Vogel M, Blaak E, Goossens G. Moderate hypoxia exposure: a novel strategy to improve glucose metabolism in humans. EMJ Diabet. 2015;3(1):73‐79. [Google Scholar]
- 148. Gileles‐Hillel A, Kheirandish‐Gozal L, Gozal D. Biological plausibility linking sleep apnoea and metabolic dysfunction. Nat Rev Endocrinol. 2016;12(5):290‐298. [DOI] [PubMed] [Google Scholar]
- 149. Barros D, Garcia‐Rio F. Obstructive sleep apnea and dyslipidemia. From animal models to clinical evidence. Sleep. 2018;42(3):zsy236. [DOI] [PubMed] [Google Scholar]
- 150. Wouters E. Obesity and metabolic abnormalities in chronic obstructive pulmonary disease. Ann Am Thorac Soc. 2017;14(Suppl 5):S389‐S394. [DOI] [PubMed] [Google Scholar]
- 151. Franssen F, O'Donnell DE, Goossens GH, Blaak EE, Schols A. Obesity and the lung: 5 obesity and COPD. Thorax. 2008;63(12):1110‐1117. [DOI] [PubMed] [Google Scholar]
- 152. van Meijel R, Blaak EE, Goossens GH. Chapter 1 ‐ Adipose tissue metabolism and inflammation in obesity In: Johnston RA, Suratt BT, eds. Mechanisms and Manifestations of Obesity in Lung Disease. Cambridge, MA: Academic Press; 2019:1‐22. https://www.elsevier.com/books/mechanisms-and-manifestations-of-obesity-in-lung-disease/johnston/978-0-12-813553-2 [Google Scholar]
- 153. Burtscher M. Effects of living at higher altitudes on mortality: a narrative review. Aging Dis. 2013;5(4):274‐280. [DOI] [PMC free article] [PubMed] [Google Scholar]
- 154. Anderson JD, Honigman B. The effect of altitude‐induced hypoxia on heart disease: do acute, intermittent, and chronic exposures provide cardioprotection? High Alt Med Biol. 2011;12(1):45‐55. [DOI] [PubMed] [Google Scholar]
- 155. Hobbins L, Hunter S, Gaoua N, Girard O. Normobaric hypoxic conditioning to maximize weight loss and ameliorate cardio‐metabolic health in obese populations: a systematic review. Am J Physiol Regul Integr Comp Physiol. 2017;313(3):R251‐R264. [DOI] [PubMed] [Google Scholar]
- 156. Santos JL, Pérez‐Bravo F, Carrasco E, Calvillán M, Albala C. Low prevalence of type 2 diabetes despite a high average body mass index in the Aymara natives from Chile. Nutrition. 2001;17(4):305‐309. [DOI] [PubMed] [Google Scholar]
- 157. Baibas N, Trichopoulou A, Voridis E, Trichopoulos D. Residence in mountainous compared with lowland areas in relation to total and coronary mortality. A study in rural Greece. J Epidemiol Community Health. 2005;59(4):274‐278. [DOI] [PMC free article] [PubMed] [Google Scholar]
- 158. Voss JD, Masuoka P, Webber BJ, Scher AI, Atkinson RL. Association of elevation, urbanization and ambient temperature with obesity prevalence in the United States. Int J Obes. 2013; 37(10):1407‐1412. [DOI] [PubMed] [Google Scholar]
- 159. Woolcott OO, Gutierrez C, Castillo OA, Elashoff RM, Stefanovski D, Bergman RN. Inverse association between altitude and obesity: A prevalence study among andean and low‐altitude adult individuals of Peru. Obesity. 2016;24(4):929‐937. [DOI] [PMC free article] [PubMed] [Google Scholar]
- 160. Voss JD, Allison DB, Webber BJ, Otto JL, Clark LL. Lower obesity rate during residence at high altitude among a military population with frequent migration: a Quasi experimental model for investigating spatial causation. PLoS ONE. 2014;9(4):e93493. [DOI] [PMC free article] [PubMed] [Google Scholar]
- 161. Díaz‐Gutiérrez J, Martínez‐González MÁ, Pons Izquierdo JJ, González‐Muniesa P, Martínez JA, Bes‐Rastrollo M. Living at higher altitude and incidence of overweight/obesity: prospective analysis of the SUN cohort. PLoS ONE. 2016;11(11):e0164483. [DOI] [PMC free article] [PubMed] [Google Scholar]
- 162. Woolcott OO, Castillo OA, Gutierrez C, Elashoff RM, Stefanovski D, Bergman RN. Inverse association between diabetes and altitude: a cross‐sectional study in the adult population of the United States. Obesity. 2014;22(9):2080‐2090. [DOI] [PMC free article] [PubMed] [Google Scholar]
- 163. Castillo O, Woolcott OO, Gonzales E, et al. Residents at high altitude show a lower glucose profile than sea‐level residents throughout 12‐hour blood continuous monitoring. High Alt Med Biol. 2007;8(4):307‐311. [DOI] [PubMed] [Google Scholar]
- 164. Lopez‐Pascual A, Arévalo J, Martínez JA, González‐Muniesa P. Inverse association between metabolic syndrome and altitude: a cross‐sectional study in an adult population of ecuador. Front Endocrinol. 2018;9:658. [DOI] [PMC free article] [PubMed] [Google Scholar]
- 165. Lopez‐Pascual A, Bes‐Rastrollo M, Sayón‐Orea C, et al. at a Geographically higher elevation is associated with lower risk of metabolic syndrome: prospective analysis of the SUN cohort. Front Physiol. 2017;7:658. [DOI] [PMC free article] [PubMed] [Google Scholar]
- 166. van denBorst B, Schols AM, deTheije C, et al. Characterization of the inflammatory and metabolic profile of adipose tissue in a mouse model of chronic hypoxia. J Appl Physiol. 2013;114(11):1619‐1628. [DOI] [PubMed] [Google Scholar]
- 167. Lecoultre V, Peterson CM, Covington JD, et al. Ten nights of moderate hypoxia improves insulin sensitivity in obese humans. Diabetes Care. 2013;36(12):e197‐e198. [DOI] [PMC free article] [PubMed] [Google Scholar]
- 168. Goossens GH. Comment on Lecoultre et al. Ten nights of moderate hypoxia improves insulin sensitivity in obese humans. Diabetes Care 2013;36:e197‐e198. Diabetes Care. 2014;37(6):e155‐e156. [DOI] [PubMed] [Google Scholar]
- 169. Workman C, Basset FA. Post‐metabolic response to passive normobaric hypoxic exposure in sedendary overweight males: a pilot study. Nutr Metab. 2012;9(1):103. [DOI] [PMC free article] [PubMed] [Google Scholar]
- 170. Lippl FJ, Neubauer S, Schipfer S, et al. Hypobaric hypoxia causes body weight reduction in obese subjects. Obesity. 2010;18(4):675‐681. [DOI] [PubMed] [Google Scholar]
- 171. Debevec T. Hypoxia‐related hormonal appetite modulation in humans during rest and exercise: mini review. Front Physiol. 2017;8:366. [DOI] [PMC free article] [PubMed] [Google Scholar]
- 172. Kayser B, Verges S. Hypoxia, energy balance and obesity: from pathophysiological mechanisms to new treatment strategies. Obes Rev. 2013;14(7):579‐592. [DOI] [PubMed] [Google Scholar]
- 173. Haufe S, Wiesner S, Engeli S, Luft FC, Jordan J. Influences of normobaric hypoxia training on metabolic risk markers in human subjects. Med Sci Sports Exerc. 2008;40(11):1939‐1944. [DOI] [PubMed] [Google Scholar]
- 174. Netzer NC, Chytra R, Küpper T. Low intense physical exercise in normobaric hypoxia leads to more weight loss in obese people than low intense physical exercise in normobaric sham hypoxia. Sleep Breath. 2008;12(2):129‐134. [DOI] [PMC free article] [PubMed] [Google Scholar]
- 175. Wiesner S, Haufe S, Engeli S, et al. Influences of normobaric hypoxia training on physical fitness and metabolic risk markers in overweight to obese subjects. Obesity. 2010;18(1):116‐120. [DOI] [PubMed] [Google Scholar]
- 176. Kong Z, Zang Y, Hu Y. Normobaric hypoxia training causes more weight loss than normoxia training after a 4‐week residential camp for obese young adults. Sleep Breath. 2014;18(3):591‐597. [DOI] [PubMed] [Google Scholar]
- 177. Gatterer H, Haacke S, Burtscher M, et al. Normobaric intermittent hypoxia over 8 months does not reduce body weight and metabolic risk factors–a randomized, single blind, placebo‐controlled study in normobaric hypoxia and normobaric sham hypoxia. Obesity facts. 2015;8(3):200‐209. [DOI] [PMC free article] [PubMed] [Google Scholar]
- 178. Camacho‐Cardenosa A, Camacho‐Cardenosa M, Burtscher M, et al. High‐intensity interval training in normobaric hypoxia leads to greater body fat loss in overweight/obese women than high‐intensity interval training in normoxia. Front Physiol. 2018;9:60. [DOI] [PMC free article] [PubMed] [Google Scholar]
- 179. Kelly LP, Basset FA. Acute normobaric hypoxia increases post‐exercise lipid oxidation in healthy males. Front Physiol. 2017;8:293. [DOI] [PMC free article] [PubMed] [Google Scholar]
- 180. Morishima T, Mori A, Sasaki H, Goto K. Impact of exercise and moderate hypoxia on glycemic regulation and substrate oxidation pattern. PLoS ONE. 2014;9(10):e108629. [DOI] [PMC free article] [PubMed] [Google Scholar]
- 181. Goto K, Morishima T, Kurobe K, Huang Z, Ogita F. Augmented carbohydrate oxidation under moderate hypobaric hypoxia equivalent to simulated altitude of 2500 m. Tohoku J Exp Med. 2015;236(3):163‐168. [DOI] [PubMed] [Google Scholar]
- 182. Nishiwaki M, Kawakami R, Saito K, Tamaki H, Ogita F. The effects of exercise training under mild hypoxic conditions on body composition and circulating adiponectin in postmenopausal women. Clin Physiol Funct Imaging. 2016;36(6):468‐475. [DOI] [PubMed] [Google Scholar]
- 183. Morishima T, Kurihara T, Hamaoka T, Goto K. Whole body, regional fat accumulation, and appetite‐related hormonal response after hypoxic training. Clin Physiol Funct Imaging. 2014;34(2):90‐97. [DOI] [PubMed] [Google Scholar]
- 184. Mackenzie R, Maxwell N, Castle P, Brickley G, Watt P. Acute hypoxia and exercise improve insulin sensitivity (SI2*) in individuals with type 2 diabetes. Diabetes Metab Res Rev. 2011;27(1):94‐101. [DOI] [PubMed] [Google Scholar]
- 185. Jensen TE, Sylow L, Rose AJ, et al. Contraction‐stimulated glucose transport in muscle is controlled by AMPK and mechanical stress but not sarcoplasmatic reticulum Ca2+ release. Mol Metab. 2014;3(7):742‐753. [DOI] [PMC free article] [PubMed] [Google Scholar]
- 186. Gorgens SW, Benninghoff T, Eckardt K, et al. Hypoxia in combination with muscle contraction improves insulin action and glucose metabolism in human skeletal muscle via the HIF‐1alpha pathway. Diabetes. 2017;66(11):2800‐2807. [DOI] [PubMed] [Google Scholar]