Abstract
Detailed insight into the internal structure of drug‐loaded polymeric micelles is scarce, but important for developing optimized delivery systems. We observed that an increase in the curcumin loading of triblock copolymers based on poly(2‐oxazolines) and poly(2‐oxazines) results in poorer dissolution properties. Using solid‐state NMR spectroscopy and complementary tools we propose a loading‐dependent structural model on the molecular level that provides an explanation for these pronounced differences. Changes in the chemical shifts and cross‐peaks in 2D NMR experiments give evidence for the involvement of the hydrophobic polymer block in the curcumin coordination at low loadings, while at higher loadings an increase in the interaction with the hydrophilic polymer blocks is observed. The involvement of the hydrophilic compartment may be critical for ultrahigh‐loaded polymer micelles and can help to rationalize specific polymer modifications to improve the performance of similar drug delivery systems.
Keywords: dissolution rates, micelles, polymers, short-range order, solid-state NMR spectroscopy
From bulk properties to a molecular level understanding: Solid‐state NMR spectroscopy complemented by X‐ray diffraction data and calculations gives insights into the loading‐dependent structure of micelles formed by amphiphilic triblock copolymers. As coordination sites in the core become saturated, stabilization of higher loadings requires coordination by the hydrophilic corona, which compromises dissolution.

Only when molecular level understanding of polymer–drug formulations is available is it possible to make targeted changes to the components with the aim to optimize physico‐chemical properties. Ideally, drug delivery platforms should carry large amounts of cargo, while simultaneously maintaining suitable stability and efficient release. In practice, drug formulations such as solid dispersions and soluble drug delivery systems (DDS) comprising polymeric micelles have attracted a lot of attention1 and several have made their way onto the market in the form of drug delivery platforms, health care products, and biomaterials.2 However, the large body of published reports on DDS is not mirrored by therapeutic advances and benefit to the patient.3 Complexity and reproducibility are important points to be considered for applications of polymers in nanomedicine.4 A molecular level understanding of these combined “macromolecule/small molecule” materials that would help to systematically address these points is difficult to obtain due to their complex nature and lack of long‐range order. Therefore, the prevailing picture across the literature for self‐assembled polymeric micelles encapsulating drug molecules is that of a well‐defined core–shell particle, where the hydrophobic core contains the drug molecules and the hydrophilic shell of the particle has a protection and solubilisation function.5 This image is dominated by the view from the outside. In this context, the work of Callari et al. was inspirational, because they were amongst the first to analyse how the structure of a polymer micelle might be affected by the presence of drug molecules.6 Their study shows that a higher loading reduces the cellular uptake and cytotoxicity in vitro; this is attributed to an increased packing density of the particle. In this case, a glycopolymer with discrete anchoring points for the Pt drug was used. However, the majority of DDS rely on physical encapsulation featuring less well‐defined interactions. For such physically loaded micelles, this effect—a decrease in dissolution with increasing drug loading—is also well known.7 Here, we utilize solid‐state NMR spectroscopy in combination with complementary tools to generate detailed insight into ultrahigh‐drug‐loaded polymeric micelles on the molecular level to understand the interplay between drug loading and the bulk properties, for example, dissolution behaviour, of such formulations. We envisage this structure–property relationship to serve as the basis for defined and systematic modifications aimed at extracting the best from both worlds—high loading and high release.
To build a bridge from experimental observations to a structural model, we used the amphiphilic triblock copolymer poly(2‐methyl‐2‐oxazoline)‐block‐poly(2‐n‐propyl‐2‐oxazine)‐block‐poly(2‐methyl‐2‐oxazoline) (pMeOx‐b‐pPrOzi‐b‐pMeOx=A‐pPrOzi‐A=P) (Scheme 1). Due to the weak hydrophobic character of pPrOzi, the polymer chains self‐assemble in aqueous solution only in the presence of hydrophobic guest molecules.8 These assemblies could be identified as spherical and worm‐like micellar structures in SANS and cryo‐TEM experiments.8, 9 The natural product curcumin (CUR) is encapsulated as a model compound due to its very low aqueous solubility, straightforward spectroscopic detection at very low concentrations, and the absence of signal overlap with the polymer in the NMR spectra. CUR with 77 % purity was used as received. Additionally, A‐pPrOzi‐A (P) can incorporate large quantities of curcumin (>50 wt. %) enabling the preparation of formulations with different, well‐defined loadings.10 A set of three different formulations, CUR‐2‐P, CUR‐6‐P, and CUR‐11‐P, was prepared.10, 11 This corresponds to 2, 6, and 11 g L−1 CUR per 10 g L−1 of the polymer, respectively, before freeze‐drying (Chapter S1 of the Supporting Information). At the highest loading, the number of curcumin molecules per polymer chain exceeds the number of repeating units of the inner, more hydrophobic polymer block.
Scheme 1.
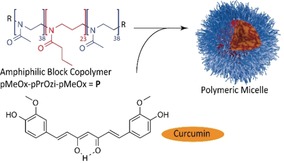
Structural formula of the components used in this study: The amphiphilic block copolymer P encapsulates curcumin by self‐assembly into polymeric micelles (schematic drawing on the right).
In standard dissolution tests using pressed tablet discs, no detectable dissolution was observed for crystalline curcumin within two hours, while amorphous CUR exhibited a low but noticeable dissolution (Table 1 and Figure S2). Formulating CUR with A‐pPrOzi‐A improved the dissolution rate up to 6000‐fold (CUR‐2‐P) with the dissolution behaviour strongly depending on the drug loading (Table 1 and Figure S3). For all formulations, required tablet discs were prepared from freeze‐dried samples.
Table 1.
Experimentally determined dissolution rates with lag times as well as results from hydrophobicity testing.
|
Sample |
Lag time [min] |
Dissolution rate [μmol min−1 cm−2][a] |
Water uptake (wt. %) at 80 % RH[b] |
|---|---|---|---|
|
CUR‐2‐P |
0 |
6.2±0.5 |
30 |
|
CUR‐6‐P |
24 |
2.6±0.8 |
16 |
|
CUR‐11‐P |
N/A |
0.025±0.008 |
15 |
|
amorphous CUR |
N/A |
0.001±0.0004 |
– |
[a] Mean ± SD (n=3). [b] n=1.
CUR‐2‐P with the lowest CUR loading began to dissolve immediately after the start of the experiment with a dissolution rate of 6.2 μmol min−1 cm−2), which was the highest among the tested samples. When the CUR loading is increased (CUR‐6‐P), the dissolution rate drops by a factor of two and a lag period of 24 min is observed. This change is even more pronounced at the highest CUR loading (CUR‐11‐P) with the dissolution rate decreasing by a factor of 100. Although this dissolution rate is still 20 times faster than that of amorphous CUR, it shows that the highest loading of a compound may not always be the most desirable formulation for (oral) administration. A two‐sided t‐test confirmed that the observed differences between CUR‐2‐P and CUR‐6‐P as well as between CUR‐11‐P and amorphous CUR are statistically significant (p ≤0.05). To explain the differences in the dissolution behaviour, crystallisation could be excluded based on a longer PXRD measurement of the swollen tablet which gave no indication of crystallisation (Figure S16). The high stirring speed (4800 rpm) used here also suffices to exclude a resident water layer as a diffusion barrier. However, the formation of a highly viscous gel layer is conceivable. The dissolution studies were supplemented by water uptake experiments at 80 % relative humidity. After 24 h, the formulations with lowest loading showed a 30 % weight gain, while weight gains of 16 % and 15 % were observed for CUR‐6‐P and CUR‐11‐P, respectively, illustrating the increasing hydrophobicity of the latter.
To derive a structural model that can explain these experimentally observed bulk properties, the freeze‐dried formulations were characterized by powder X‐ray diffraction (Figure S13). For neat CUR, a distinct pattern of clear diffraction peaks was observed in agreement with the most stable, monoclinic crystal form (CSD ref. code: BINMEQ0512). In contrast, all formulations lacked long‐range order; they were X‐ray amorphous. However, trends observed for the broad halo indicate changes in local order. NMR spectroscopy is particularly sensitive to the local environment of NMR‐active nuclei and can thus be a powerful probe of such local or short‐range‐order phenomena. Therefore, the samples were dissolved in the non‐selective solvent CDCl3 (no micelles, individual components) or selective D2O (CUR loaded micelles) and subsequently analysed by NMR spectroscopy in solution (Figures S4–S6). While CDCl3 readily dissolves both CUR and the polymer, the CUR signals could barely be observed in D2O. Only the polymer resonances were clearly distinguishable, suggesting that CUR in the micellar core behaves more solid‐like, which agrees with recent fluorescence spectroscopic analysis at very low loadings.13 This hampers the detailed analysis and shows that NMR analysis in solution is not a suitable tool to study proximities and intermolecular interactions in these polymeric micelles. Diffusion (DOSY) NMR measurements of the three formulations in solution yielded diffusion coefficients and thus approximate radii, which agree with previously determined values from dynamic light scattering (both in Table S3).10 This shows that information on the size and exterior of these micelles is readily available, while information on the molecular arrangement of and within the micellar core is more difficult to obtain.
Therefore, we turned our attention to solid‐state NMR spectroscopy, which has been shown to be a very powerful analytical technique in the pharmaceutical context for studying amorphous dosage forms in general14 and which is particularly sensitive to intermolecular interactions and subtle changes in the local arrangement. For example, Procházková et al. recently used solid‐state NMR spectroscopy complemented by calculations and PXRD for a detailed investigation of polymorphic transformations in glycopolymeric vesicles.15 Freeze‐dried formulations were subjected to 1H and 13C CP/MAS NMR experiments at 24 kHz MAS and 14.1 T. To ensure sample stability upon MAS, the 1H NMR spectrum was observed at different times and PXRD was measured after completion of the NMR experiments (Figure S14 b). For a first proof‐of‐principle, the NMR spectroscopic data from the three formulations were compared to spectra for the individual components (as‐received CUR and pure polymer), a 1:1 physical mixture, and quench‐cooled amorphous curcumin (Figure 1, scaled according to the individual number of scans). The 13C CP/MAS NMR spectra of as‐received CUR and the polymer used for sample preparation are shown in grey and blue. The resonances were assigned based on NMR spectra in solution and previously published assignments based on solid‐state NMR and calculations.16 The spectrum of the 1:1 physical mixture (green) is the simple sum of the spectra of the individual components. In contrast, the spectra of the three formulations (yellow, orange, red) clearly differ from the other spectra in peak number, position, width, and relative intensities. Increasing curcumin loading results in a corresponding increase in the relative CUR signal intensities and increasing similarity to the spectrum of quench‐cooled amorphous CUR. Together, this shows that solid‐state NMR spectroscopy provides a solid basis for the systematic analysis of these polymer–drug self‐assemblies, allowing us a detailed look at distinct, loading‐dependent changes. In the following, several regions in the spectra (Figure 1, grey highlights) will be discussed in more detail to point out specific aspects of the formulations (Figure 2 and Figure 4). For this discussion, the scaling of the spectra was adjusted for each signal area to show signals with practically equal heights. This facilitates the identification of changes in chemical shifts and the respective line widths. For an overview of all extracted spectral parameters, the reader is referred to the Supporting Information (Table S4). As a general trend, the signals in the formulations attributed to the polymer are all broader than those observed for the pure compound (no micelles present), while those resulting from CUR are narrower than the signals of fully amorphous CUR. This corroborates the concept of an X‐ray amorphous material with different degrees of short‐range order.
Figure 1.
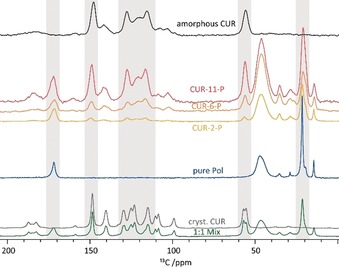
13C CP/MAS NMR spectra of amorphous CUR (black), the three formulations (yellow, orange, red with increasing CUR concentration), pure polymer (blue), as‐received CUR (grey), and a 1:1 mixture of the two components (green). All spectra were recorded at 14.1 T and 24 kHz and scaled according to the number of scans of the individual datasets.
Figure 2.
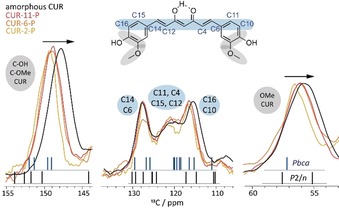
Enlarged sections from the overlay of the 13C CP/MAS NMR spectra of CUR‐2‐P (yellow), CUR‐6‐P (orange), and CUR‐11‐P (red) compared to the spectrum of amorphous CUR (black) from Figure 1. Here, the signal intensities were scaled to approximately equal height for each individual signal area to facilitate direct comparison. Calculated chemical shifts are represented by vertical lines.
Figure 4.
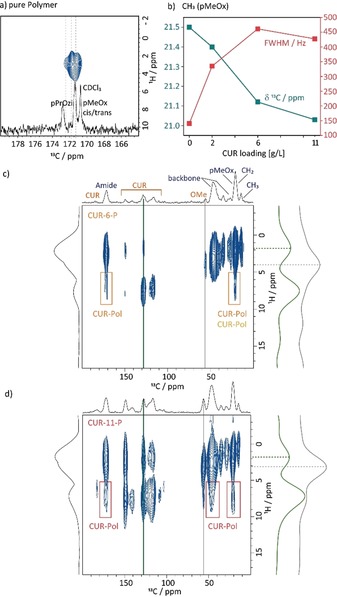
a) Amide region of the 1H‐13C FSLG HETCOR spectrum of the pure polymer recorded with a contact time of 1.5 ms alongside the 13C NMR spectrum in CDCl3 (full 2D spectrum in the Supporting Information). b) Comparison of the chemical shift (green) and line width (red) of the CH3 group of the hydrophilic polymer block pMeOx for the pure polymer and the three formulations. c) and d) 1H‐13C FSLG HETCOR spectra of CUR‐6‐P and CUR‐11‐P recorded at 14.1 T and 20 kHz MAS with a contact time of 5 ms alongside the vertical slices extracted as highlighted by the coloured bars. Coloured boxes indicate cross‐peaks originating from CUR–Pol intermolecular contacts. The 2D dataset of CUR‐2‐P can be found in the Supporting Information.
Firstly, the signals corresponding to the quaternary C−OH/C−OMe carbon atoms at ≈150 ppm as well as the signals of the CH3 groups of curcumin (≈56 ppm) are compared as they appear to be affected most by increased loading (Figure 2, grey ellipsoids). These are the polar groups that are expected to be involved in intermolecular hydrogen bonding, while the enol moiety is mostly involved in intramolecular interactions. This was also underlined by a comparison of theoretical chemical shifts in a complete crystal and for an isolated molecule (Figures S19 and S20). Upon going from low (CUR‐2‐P) to high loading (CUR‐11‐P), the corresponding 13C chemical shifts decrease, approaching that of amorphous CUR and the line widths increase. Hence, with higher loadings, the curcumin molecules experience a less uniform molecular environment. Interestingly, the changes in absolute values are greater between CUR‐2‐P and CUR‐6‐P than between the two higher loadings (6 vs. 11). Secondly, the signals of CUR between 110 and 130 ppm give additional insights. These signals belong to the backbone of the CUR molecule (highlighted in light blue). Curcumin in its most stable crystalline form (monoclinic space group P2/n) does not show any 13C signals around 120 ppm as indicated by the calculated chemical shifts (Figure 2, black lines). In contrast, analogous calculations for the two other known polymorphs, in which CUR shows a significantly smaller torsion angle (16.1° vs. 46.0°), predict 13C resonances in this region of the spectrum (blue lines). Therefore, we can deduce that CUR inside the micelles adopts a range of conformations with little molecular twist.
For further evidence of the involvement of the hydroxy group of CUR in hydrogen bonding with the amide functionality of the polymer, 1H NMR spectra at fast MAS were recorded for CUR‐11‐P, CUR‐6‐P, as‐received CUR, and a 1:1 mixture (Figure 3). For the formulations, a broad resonance at 9–10 ppm indicated by the red dotted line can be observed, which increases from CUR‐6‐P to CUR‐11‐P and is not present for the as‐received CUR sample or the physical mixture. Resonances at such high ppm values are indicative of hydrogen‐bonding interactions and the signal can be assigned to the OH group. For CUR and the physical mixture, the OH group resonates at a lower value of 7.5 ppm. We attribute this difference to the stronger hydrogen bonds formed between the hydroxyl moieties and the carbonyl of the amide group compared those to the methoxy group of the curcumin molecule, in agreement with GIPAW (CASTEP) calculations on a set of model structures containing similar OH⋅⋅⋅O=CN interactions (Chapter S8). Here, a shift of about 5–6 ppm to higher ppm values was predicted for resonances involved in such hydrogen‐bonding arrangements, which is 1–2 ppm higher than predicted for CUR in form 1 (Chapter S7).
Figure 3.
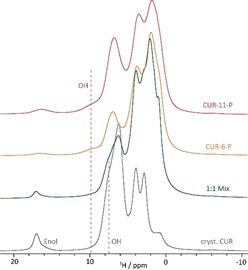
Overlay of the 1H solid‐state NMR spectra of CUR‐11‐P, CUR‐6‐P, a physical 1:1 mixture, and as‐received CUR recorded at 14.1 T and 65 kHz MAS. The enol and the hydroxy moieties of the curcumin are indicated for the respective samples.
Focussing on the polymer, the resonance of the amidic C=O group (≈172 ppm), which can serve as a hydrogen‐bond‐acceptor site, should be sensitive to the presence of CUR. For the neat polymer, only one resonance is observed in the 1D 13C CP/MAS NMR spectrum, such that pMeOx and pPrOzi cannot be distinguished. However, in the 1H‐13C HETCOR spectrum with longer contact times (1.5 ms) three distinct resonances at 172.8, 171.7, and 171.0 ppm are observed, which can be assigned to the pPrOzi carbonyl moiety and the cis/trans isomers of pMeOx by comparison with 13C NMR data in solution (Figure 4 a). The existence of cis/trans isomers is well known for tertiary amides such as poly(2‐oxazoline)s.17 For the pure polymer, the presence of the isomers is also observed in the solid state, which needs to be taken into account for the construction of a more detailed structural model. Upon CUR loading, the lines broaden and overlapping resonances can be observed. This is due to the distribution of environments and the presence of uncoordinated as well as coordinated amide moieties. To investigate the role of the different polymer blocks and their involvement in the CUR coordination more closely, changes in the chemical shift and line widths for the CH3 group of the pMeOx polymer blocks are analysed (Figure 4 b). The line width increases significantly on going from the unassembled polymer to self‐assembled CUR‐2‐P and further to the CUR‐6‐P and CUR‐11‐P formulations, which lie in the same range. The chemical shift shows only a minor change on going from the pure polymer to the formulation with low loading (0.1 ppm) as expected from the simplified image that CUR is located in the micellar core in the proximity of the more hydrophobic PrOzi residues. With increasing CUR loading, however, a more pronounced change in chemical shift is observed. This indicates that at higher loadings, the hydrophilic polymer blocks become involved in the coordination of CUR. In agreement with this picture, the chemical shift as well as the line width of the propyl‐CH3 signal do not differ between the CUR‐6‐ and CUR‐11‐P formulations, for which we hypothesize that the interactions with the hydrophobic micellar core are largely saturated (Figure S9). To confirm this hypothesis, 1H‐13C 2D HETCOR spectra with a long contact time of 5 ms were recorded to probe intermolecular interactions between CUR and the polymer. The corresponding 2D spectra of CUR‐6‐P and CUR‐11‐P are shown in Figure 4 c and 4 d, respectively. As the polymer does not contain any aromatic moieties, cross‐peaks at the 13C chemical shift of the polymer observed in this spectral area must originate form CUR–Pol contacts. Such contacts are highlighted by boxes in the colour code introduced in Figure 1. The 2D HETCOR spectrum of CUR‐2‐P can be found in the Supporting Information (Figure S11 b). For the formulation with lowest loading, mostly intramolecular cross‐peaks are observed apart from one weak cross‐peak with the CH2 unit of the propyl chain at 20.5 ppm. However, the overall intensity is low so that further contacts cannot be fully excluded. For medium loading, additional contacts between CUR and pMeOx are observed, proving the involvement of the pMeOx polymer block. Interestingly, two contacts of different intensity are observed to the carbonyl group. This could be due to cis/trans isomerism or different degrees of interaction with pMeOx and pPrOzi segments; this requires further investigation. Finally, many cross‐peaks can be observed between CUR and the polymer for CUR‐11‐P. Contacts to all carbonyl environments and the polymer backbone are observed to the already described interactions for the formulations with lower CUR loading. Cross‐peaks located at 13C CUR resonances with protons at low chemical shifts could also indicate intermolecular CUR–Pol contacts; however, the interpretation is more complex as the methoxy group of CUR is also observed around 3.5 ppm. Horizontal slices indicate that the peak centre for the cross‐peak at 128 ppm (green) is at lower ppm values than the OMe resonance (grey), but CUR–CUR contacts or intramolecular spin‐diffusion cannot be fully excluded as a source of this cross‐peak. A HETCOR spectrum with an additional spin‐diffusion block of 50 ms according to Duan et al.18 showed spin diffusion between the different components (Figure S12 a). This is an indication that no phase separation into domains takes place even at high CUR loadings, which is supported by the observation of only one glass transition for these formulations in a previous study.8 As a negative control, a HETCOR experiment for a 1:1 physical mixture did not yield cross‐peaks between CUR and the polymer (Figure S12 b).
Based on these observations, we can now assemble the puzzle pieces from the various experiments to obtain an overall loading‐dependent, molecular level structural model (Figure 5): The unimers self‐assemble into micelles only in the presence of curcumin. For the formulation with the lowest concentration of CUR (CUR‐2‐P), the poorly water‐soluble CUR molecules with only a small molecular twist are mainly located in the micellar core with a distribution of rather defined environments due to hydrogen bonding between the phenolic OH moieties and the amide moiety of the hydrophobic block (depicted in red, Figure 5). As these preferred interaction sites become saturated at increasing CUR loading (CUR‐6‐P), the local order of CUR molecules is reduced. Furthermore, CUR molecules are now envisaged to be located at the hydrophilic–hydrophobic interface (in agreement with the raspberry model fitted for SANS data of a comparable system9) and therefore interact increasingly with the repeating units of the hydrophilic block as evidenced by distinct changes in chemical shifts and corresponding cross‐peaks in the 2D HETCOR spectra. These amide functionalities of the hydrophilic blocks (Figure 5, in blue) otherwise hydrate and stabilize the micelle. Consequently, in the hydration/dissolution process, CUR molecules now block the hydrogen bond acceptor sites within the shell of the micelle. This correlates with the observed retardation of the dissolution for CUR‐6‐ and CUR‐11‐P. Finally, at the highest loading, not only the core is essentially filled with CUR molecules (smallest degree of short‐range order in the NMR spectra), also the hydrophilic amide units become saturated, essentially physically crosslinking the hydrophilic corona, significantly affecting hydration. This is in accordance with the strongly decreased dissolution rate as observed for CUR‐11‐P1 and an increased radius of the particle, because of the shell being more rigid for these ultrahigh loadings. This overall picture would suggest an increased hydrophobicity of the micelles at higher loadings in agreement with the results in Table 1 and with a different study on glycopolymers using SAXS and SANS.19
Figure 5.
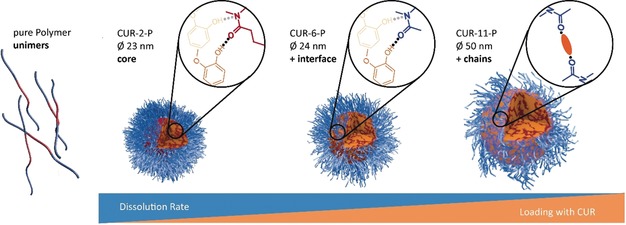
Schematic model of the structural changes of the polymeric micelles upon loading with curcumin based on the solid‐state NMR data and complementary insights. For each loading stage, the additionally occurring interaction site is depicted.
In general, structural information and understanding on the molecular level is difficult to obtain for drug‐loaded polymeric micelles. In this work, we could show that solid‐state NMR spectroscopy is a versatile toolbox, which can—complemented by other approaches—facilitate the detailed analysis of polymeric micelles, thus improving our structural understanding. NMR spectroscopic data probed changes in the interaction profile with increasing loading. At higher loadings, the hydrophilic polymer blocks were found to participate in the coordination of CUR, which is presumably of critical importance to obtain the unusually high drug loadings of approximately 50 wt. % observed with this platform. This can now serve as a starting point for the rational modification of polymers to maintain ultrahigh loadings, while not having to compromise the release behaviour. Experimental studies will now need to verify if and how optimized nanoparticles for drug delivery can be obtained through this approach. Additionally, the NMR experiments used here can be expanded including further proton‐detected experiments at fast MAS. This would allow the drawing of an even more accurate picture for this and other drug–polymer arrangements. A systematic investigation by varying both polymer and guest molecules potentially also employing isotopic labelling schemes is necessary to, for example, explain the extremely different loading efficiencies observed for structurally similar polymers.10, 20 Investigation of the samples during storage at a defined relative humidity might give insights into the dissolution mechanism. Moreover, exploration of the complementary insights from pair‐distribution functions based on PXRD or probing the internal micellar structure by SANS should also be very valuable to learn more about these interesting systems.
Conflict of interest
M.M.L. and R.L. are listed as inventors on a patent application pertinent to some of the materials discussed in this contribution. R.L. is co‐founder and has a financial interest in DelAqua Pharmaceuticals Inc. which is intent on commercializing poly(2‐oxazoline)‐based excipients.
Supporting information
As a service to our authors and readers, this journal provides supporting information supplied by the authors. Such materials are peer reviewed and may be re‐organized for online delivery, but are not copy‐edited or typeset. Technical support issues arising from supporting information (other than missing files) should be addressed to the authors.
Supplementary
Acknowledgements
We thank Prof. Roland Mitric for access to his workgroup cluster for the GIPAW (CASTEP) calculations and in particular to Matthias Wohlgemuth for helping us with the setup of the program package. We thank Dr. Matthias Grüne for helpful and stimulating discussions. We further thank Dominik Heuler for his support with the PXRD measurements and Malik Salman Haider for sharing his experience with respect to quench‐cooling of curcumin. Tessa Lühmann is acknowledged for proof reading and Thomas Lorson for help with the DLS data. Special thanks goes to the Pöppler group for their support with proof reading, discussion, and enthusiasm. Financial support from the Verband der Chemischen Industrie (VCI) in the form of a material cost allowance is acknowledged (A.‐C.P.). M.M.L. thanks the Evonik Foundation for providing a doctoral fellowship. We would like to thank all reviewers for their effort and helpful comments to improve the initial version of this manuscript. Experimental and calculated data for this study is available through the repository Zenodo.
A.-C. Pöppler, M. M. Lübtow, J. Schlauersbach, J. Wiest, L. Meinel, R. Luxenhofer, Angew. Chem. Int. Ed. 2019, 58, 18540.
A previous version of this manuscript has been deposited on a preprint server (https://doi.org/10.26434/chemrxiv.8943251.v1).
References
- 1.
- 1a. Duncan R., Nat. Rev. Drug Discovery 2003, 2, 347–360; [DOI] [PubMed] [Google Scholar]
- 1b. Huang Y., Dai W.-G., Acta Pharm. Sin. B 2014, 4, 18–25; [DOI] [PMC free article] [PubMed] [Google Scholar]
- 1c. Kwon G. S., Kataoka K., Adv. Drug Delivery Rev. 2012, 64, 237–245; [Google Scholar]
- 1d. Cabral H., Kataoka K., J. Controlled Release 2014, 190, 465–476. [DOI] [PubMed] [Google Scholar]
- 2.
- 2a. Wagner V., Dullaart A., Bock A.-K., Zweck A., Nat. Biotechnol. 2006, 24, 1211–1217; [DOI] [PubMed] [Google Scholar]
- 2b. Kamaly N., Xiao Z., Valencia P. M., Radovic-Moreno A. F., Farokhzad O. C., Chem. Soc. Rev. 2012, 41, 2971–3010. [DOI] [PMC free article] [PubMed] [Google Scholar]
- 3. Leroux J.-C., Angew. Chem. Int. Ed. 2017, 56, 15170–15171; [DOI] [PubMed] [Google Scholar]; Angew. Chem. 2017, 129, 15368–15369. [Google Scholar]
- 4. Luxenhofer R., Nanomedicine 2015, 10, 3109–3119. [DOI] [PubMed] [Google Scholar]
- 5.
- 5a. Chen H., Kim S., Li L., Wang S., Park K., Cheng J.-X., Proc. Natl. Acad. Sci. USA 2008, 105, 6596–6601; [DOI] [PMC free article] [PubMed] [Google Scholar]
- 5b. Cho H., Lai T. C., Tomoda K., Kwon G. S., AAPS PharmSciTech 2015, 16, 10–20; [DOI] [PMC free article] [PubMed] [Google Scholar]
- 5c. Tam Y. T., Gao J., Kwon G. S., J. Am. Chem. Soc. 2016, 138, 8674–8677; [DOI] [PMC free article] [PubMed] [Google Scholar]
- 5d. Cabral H., Miyata K., Osada K., Kataoka K., Chem. Rev. 2018, 118, 6844–6892. [DOI] [PubMed] [Google Scholar]
- 6. Callari M., De Souza P. L., Rawal A., Stenzel M. H., Angew. Chem. Int. Ed. 2017, 56, 8441–8445; [DOI] [PubMed] [Google Scholar]; Angew. Chem. 2017, 129, 8561–8565. [Google Scholar]
- 7.
- 7a. Gref R., Minamitake Y., Peracchia M. T., Trubetskoy V., Torchilin V., Langer R., Science 1994, 263, 1600; [DOI] [PubMed] [Google Scholar]
- 7b. Polakovič M., Görner T., Gref R., Dellacherie E., J. Controlled Release 1999, 60, 169–177. [DOI] [PubMed] [Google Scholar]
- 8. Lübtow M. M., Nelke L. C., Seifert J., Kühnemundt J., Sahay G., Dandekar G., Nietzer S. L., Luxenhofer R., J. Controlled Release 2019, 303, 162–180. [DOI] [PubMed] [Google Scholar]
- 9. Schulz A., Jaksch S., Schubel R., Wegener E., Di Z., Han Y., Meister A., Kressler J., Kabanov A. V., Luxenhofer R., Papadakis C. M., Jordan R., ACS Nano 2014, 8, 2686–2696. [DOI] [PMC free article] [PubMed] [Google Scholar]
- 10. Lübtow M. M., Hahn L., Haider M. S., Luxenhofer R., J. Am. Chem. Soc. 2017, 139, 10980–10983. [DOI] [PubMed] [Google Scholar]
- 11. Luxenhofer R., Schulz A., Roques C., Li S., Bronich T. K., Batrakova E. V., Jordan R., Kabanov A. V., Biomaterials 2010, 31, 4972–4979. [DOI] [PMC free article] [PubMed] [Google Scholar]
- 12. Sanphui P., Goud N. R., Khandavilli U. B. R., Bhanoth S., Nangia A., Chem. Commun. 2011, 47, 5013–5015. [DOI] [PubMed] [Google Scholar]
- 13. Lübtow M. M., Marciniak H., Schmiedel A., Roos M., Lambert C., Luxenhofer R., Chem. Eur. J. 2019, 25, 12601–12610. [DOI] [PMC free article] [PubMed] [Google Scholar]
- 14.
- 14a. Lefort R., De Gusseme A., Willart J. F., Danède F., Descamps M., Int. J. Pharm. 2004, 280, 209–219; [DOI] [PubMed] [Google Scholar]
- 14b. Pham T. N., Watson S. A., Edwards A. J., Chavda M., Clawson J. S., Strohmeier M., Vogt F. G., Mol. Pharm. 2010, 7, 1667–1691; [DOI] [PubMed] [Google Scholar]
- 14c. Brus J., Urbanova M., Sedenkova I., Brusova H., Int. J. Pharm. 2011, 409, 62–74. [DOI] [PubMed] [Google Scholar]
- 15. Procházková E., Cao C., Rawal A., Dračínský M., Bhattacharyya S., Císařová I., Hook J. M., Stenzel M. H., ACS Appl. Mater. Interfaces 2019, 11, 28278–28288. [DOI] [PubMed] [Google Scholar]
- 16.
- 16a. Kong X., Brinkmann A., Terskikh V., Wasylishen R. E., Bernard G. M., Duan Z., Wu Q., Wu G., J. Phys. Chem. B 2016, 120, 11692–11704; [DOI] [PubMed] [Google Scholar]
- 16b. Matlinska M. A., Wasylishen R. E., Bernard G. M., Terskikh V. V., Brinkmann A., Michaelis V. K., Cryst. Growth Des. 2018, 18, 5556–5563. [Google Scholar]
- 17.
- 17a. Sisido M., Imanishi Y., Higashimura T., Biopolymers 1972, 11, 399–408; [DOI] [PubMed] [Google Scholar]
- 17b. Sui Q., Borchardt D., Rabenstein D. L., J. Am. Chem. Soc. 2007, 129, 12042–12048; [DOI] [PubMed] [Google Scholar]
- 17c. Gorske B. C., Stringer J. R., Bastian B. L., Fowler S. A., Blackwell H. E., J. Am. Chem. Soc. 2009, 131, 16555–16567. [DOI] [PMC free article] [PubMed] [Google Scholar]
- 18. Duan P., Moreton J. C., Tavares S. R., Semino R., Maurin G., Cohen S. M., Schmidt-Rohr K., J. Am. Chem. Soc. 2019, 141, 7589–7595. [DOI] [PubMed] [Google Scholar]
- 19. Cao C., Zhao J., Chen F., Lu M., Khine Y. Y., Macmillan A., Garvey C. J., Stenzel M. H., Chem. Mater. 2018, 30, 5227–5236. [Google Scholar]
- 20. Lübtow M. M., Keßler L., Appelt-Menzel A., Lorson T., Gangloff N., Kirsch M., Dahms S., Luxenhofer R., Macromol. Biosci. 2018, 18, 1800155. [DOI] [PubMed] [Google Scholar]
Associated Data
This section collects any data citations, data availability statements, or supplementary materials included in this article.
Supplementary Materials
As a service to our authors and readers, this journal provides supporting information supplied by the authors. Such materials are peer reviewed and may be re‐organized for online delivery, but are not copy‐edited or typeset. Technical support issues arising from supporting information (other than missing files) should be addressed to the authors.
Supplementary


