Abstract
Purpose:
To examine the utility of optical coherence tomography (OCT) for studying eyes with advanced glaucoma [i.e., eyes with a 24–2 visual field (VF) mean deviation (MD) worse than −15 dB], we tested the hypothesis that if these eyes had a 10–2 total deviation (TD) map with points better than −8 dB, then the topographically corresponding regions on the circumpapillary retinal nerve fiber layer (cpRNFL) should show a preserved region.
Design:
Evaluation of technology study
Participants:
39 eyes from 33 patients (mean: 68.8 ± 9.2 years) with a diagnosis of glaucoma had a 24–2 VF with a MD ≤ −15 dB (mean: −18.94 ± 2.95 dB). All eyes additionally had a 10–2 VF and an averaged OCT circle scan.
Methods:
Each scan was inspected, and preserved cpRNFL regions of the disc associated with the macula (central ±8° were delin eated.
Main Outcome Measures:
The number of eyes with preserved cpRNFL regions and their association with preserved VF locations (i.e. better than −8 dB) shown in the 10–2 VF TD map.
Results:
38 of the 39 eyes had one or more points on the 10–2 VF with TD values that were better than −8 dB (mean: 25.7 ± 12.6 points). For all 39 eyes, there was a preserved portion of the cpRNFL on the circle scan within the disc region associated with the macula. However, for 3 of these eyes, this region was hypodense and could be a challenge for the clinician to identify.
Conclusion:
OCT scans can be used to assess and potentially follow the preserved regions of cpRNFL associated with the macula in eyes with advanced glaucoma if there is a preserved region on the 10–2 VF better than −8 dB.
Précis:
OCT scans can be used to assess, and potentially follow, the preserved regions of cpRNFL associated with the macula in eyes with advanced glaucoma.
The introduction of optical coherence tomography (OCT) in ophthalmology has revolutionized the practice of glaucoma management.1 However, it is commonly assumed that eyes with advanced glaucoma cannot be evaluated using OCT. Previous studies have highlighted the floor effect of circumpapillary retinal nerve fiber layer (cpRNFL), which precludes its use for advanced glaucoma. That is, the global cpRNFL thickness approaches an asymptote when the mean deviation (MD) of the 24–2 visual field (VF) is less than about −15 dB.2–8 For example in Medeiros et al (Fig. 6 in ref. 2), the eyes with MD worse than −15 dB had a median global thickness that reached an asymptote at about 55 μm. In any case, it is common practice for eyes with advanced glaucoma to be monitored using stereophotographs and/or VFs. However, the subjective evaluation of stereophotographs shows inadequate agreement among individuals9 and suffers from poor repeatability. VFs for eyes with MD ≤ −15 dB also show poor repeatability and thus can be unreliable in these advanced cases.10,11
Considering the clinical challenges presented in the monitoring of disease progression in advanced glaucoma, we explored the capabilities of OCT beyond those offered by the summary metrics, such as the global thickness of the cpRNFL. In Hood and De Moraes,12 we speculated that eyes with MD values worse than −15 dB will have a preserved cpRNFL region if the total deviation (TD) plot of the 24–2 and/or 10–2 has one or more locations with a TD value better than −8 dB. Further, the preserved region of the cpRNFL should topographically agree with the location of these points. To test this hypothesis, we retrospectively examined the cpRNFL scans of eyes with 24–2 MD ≤ −15 dB, on whom we had both a 10–2 VF and a circle scan. In particular, we ask if the eyes with one or more locations better than −8 dB in the central ± 8° (the macula) of the 10–2 VF had preserved RNFL thickness in the region of the cpRNFL associated with the macula.
Methods
The Institutional Review Boards of Columbia University and the New York Eye and Ear Infirmary of Mount Sinai approved this study. It followed the tenets of the Declaration of Helsinki and the Health Insurance Portability and Accountability Act. Written informed consent was obtained from all patients.
Participants
The study included 39 eyes from 33 patients with a mean age of 68.8 ± 9.2 years (range: 48 to 89 years). All eyes had a 24–2 VF with a MD ≤ −15 dB (mean ± SD: −18.94 ± 2.95, range: −27.06 to −15.01 dB). In addition, all eyes had an OCT circle scan and a 10–2 VF within 1 year (mean 0.11, range 0 to 0.83 years). Every eye was diagnosed as having glaucoma by the same glaucoma specialist (RR); 17 eyes were classified as primary open angle glaucoma-high tension (POAG-HT), 14 as POAG-normal tension (POAG-NT), 7 as secondary, and one as angle closure. Supplement A (available at http://www.ophthalmologyglaucoma.org) has this information along with other key information, including 24–2 and 10–2 MD and PSD (pattern standard deviation), and OCT global cpRNFL thickness. The VFs were obtained with the Swedish Interactive Threshold Algorithm (SITA) standard strategy on a Humphrey Field Analyzer II-i (Carl Zeiss Meditec, Inc, Dublin, CA). The OCT global thickness of these eyes ranged from 29 to 74 μm (mean: 51 μm).
Optical Coherence Tomography (OCT)
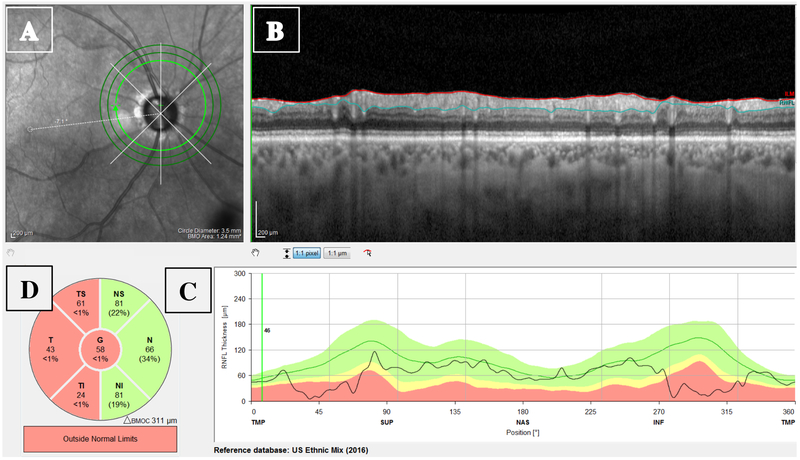
All eyes were scanned on the Spectralis HRA+OCT with the Glaucoma Module Premium protocol (Heidelberg Engineering Inc, Heidelberg, Germany). The circle scans were acquired in a high-speed mode and were set to average 100 times. The commercial report for the 3.5 mm circle scan included an infrared (IR) projection of the disc (Fig. 1A), the averaged B-scan image (Fig. 1B), cpRNFL thickness profile (Fig. 1C), and the sectorial pie chart of the cpRNFL thicknesses (Fig. 1D). Our focus here was on the averaged B-scan in Fig. 1.
Figure 1:
The circumpapillary retinal nerve fiber layer (cpRNFL) report showing the (A) projected infrared (IR) image of the disc; (B) high-resolution circle scan with the segmented borders of the RNFL (red and blue lines); (C) cpRNFL thickness plot; and (D) Thickness of cpRNFL for temporal-inferior (TI), temporal (T), temporal-superior (TS), nasal-superior (NS), nasal (N), and nasal-inferior (NI) sectors, along with the global (G) thickness in center circle.
Qualitative Assessment of Preserved Macular Regions of cpRNFL
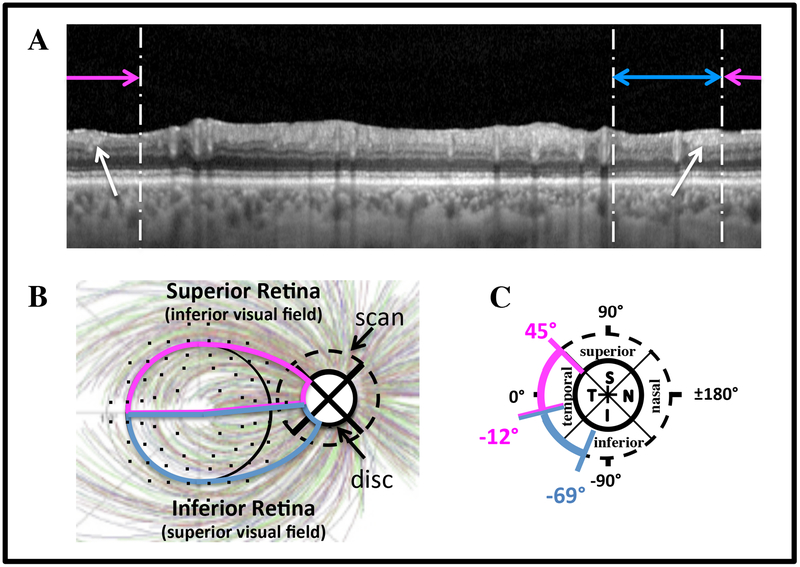
For all 39 eyes, the macular regions on the circle B-scan images (e.g. Fig. 1B) were qualitatively inspected for clearly visible portions of the cpRNFL.13,14 The macula was defined as the regions within 8° of the foveal center (black circle in Fig. 2C). The location of the corresponding region on the circle scan was based upon the schematic model in Fig. 2B,C. This model shows the approximate boundaries of the disc regions (panel B) associated with the superior (magenta) and inferior (blue) regions of the macula. The small black circles are the 10–2 VF locations adjusted for retinal ganglion cell (RGC) displacement as determined by Hood and Raza,13 based upon data from Drasdo et al.15 They are overlaid on the RNFL bundle tracings from Jansonius et al.16
Figure 2:
A. The circular B-scan image from Fig. 1B without the segmentation lines. The horizontal lines indicate the regions associated with the superior macula/inferior visual field (magenta) and inferior macula/superior visual field (blue) according to the schematic model.13 B,C. Schematic model showing the relation between regions of the macula and regions of the disc. The RNFL tracings are from Jansonius et al.,16 and the 10–2 point locations are from Hood and Raza,13 based upon data from Drasdo et al.15
The horizontal magenta and blue lines in Fig. 2A respectively indicate the regions of the B-scan associated with the superior retina (SR)/inferior visual field (IVF) and inferior retina (IR)/superior visual field (SVF), as determined by the model (Fig. 2B). Four of the authors examined the portion of the circular B-scans within the macular region for evidence of remaining cpRNFL. Supplement B (available at http://www.ophthalmologyglaucoma.org) has the B-scan images, as in Fig. 1B, for all 39 eyes so that readers can confirm the existence of cpRNFL for themselves.
Results
Qualitative assessment of remaining cpRNFL
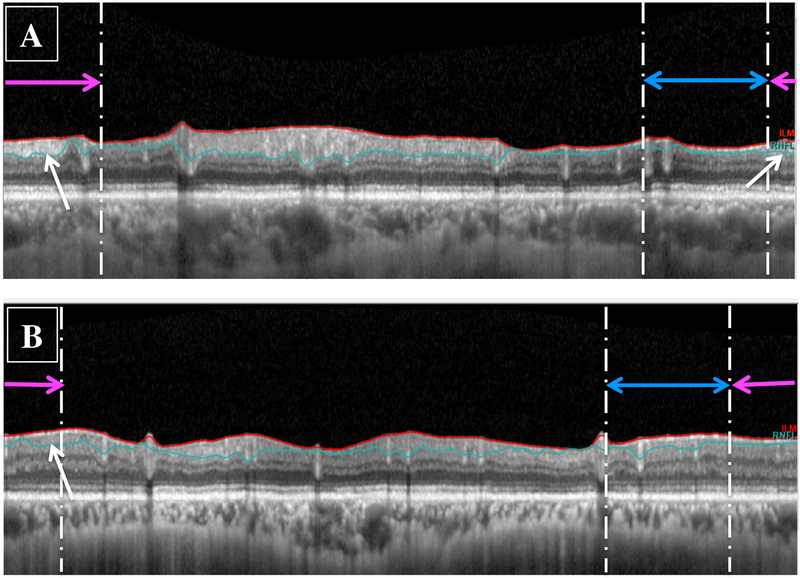
Based upon inspection of the circle scans, all 39 eyes had identifiable portions of cpRNFL in the region associated with the macula as indicated by the white arrows in Fig. 2A. For 36 of these eyes, there was a clear hyperdense cpRNFL region associated with the macula; an example is shown in Fig. 3A. The other 3 eyes had visible cpRNFL, but it was of low contrast and would be more difficult for the clinician to identify. An example is shown in Fig. 3B.
Figure 3:
Circle scans for (A) an eye with a global cpRNFL of 54 μm and a 24–2 visual field (VF) mean deviation (MD) of −22.31 dB showing preservation of the cpRNFL in the region associated with the macular region (white arrows), and (B) an eye with preserved cpRNFL that appeared hypodense (white arrow).
A comparison to 10–2 VF total deviation values
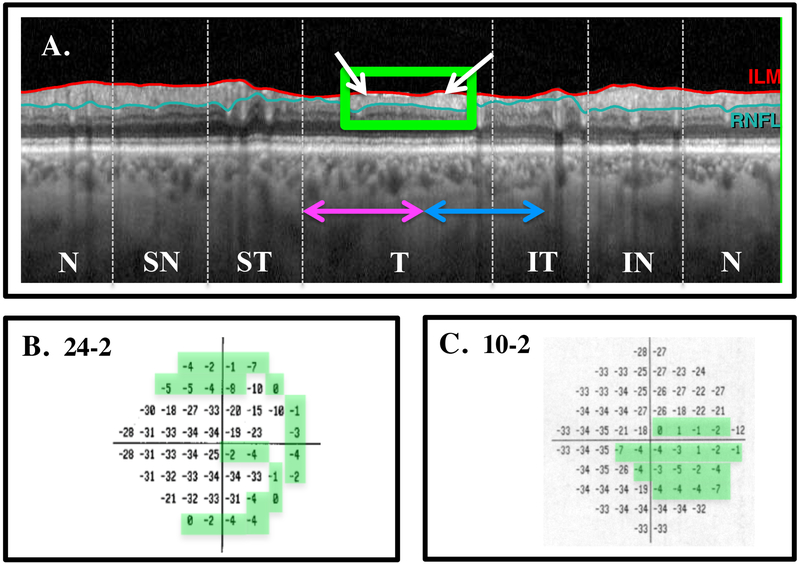
In general, the remaining cpRNFL regions showed good agreement with the regions on the 10–2 TD plots ≥ −8 dB. Figure 4B,C shows the 24–2 and 10–2 VFs for the same eye as in Figs. 1 and 2. The global thickness of this eye was 58 μm and the 24–2 VF MD was −19.86 dB. Here, the B-scan (Fig. 4A) is shown in NSTIN orientation. That is, it is shown as if the scan went from nasal (N) to superior (S) to temporal (T) to inferior (I) to nasal (N). This NSTIN plot places the region associated with the macula in the center and makes the comparison to the VF easier to visualize. The white arrows in Fig. 4A indicate preserved cpRNFL in the regions associated with both the superior and inferior macula. As predicted, there are locations on the 10–2 TD plot ≥ −8 dB; these locations are within the green boundaries in Fig. 4C.
Figure 4:
A. The B-scan image shown in an NSTIN profile with the temporal portion in the center. The white arrow indicates preserved cpRNFL in the regions associated with both the superior and inferior macular regions. B. The 24–2 total deviation (TD) plot. C. The 10–2 TD plot. The locations within the green borders have TD values ≥ −8 dB.
According to our hypothesis, if the 10–2 VF showed one or more points better than −8 dB, then there should be preserved cpRNFL in the associated region. In fact, 38 of the 39 eyes had one or more points on the 10–2 VF that were ≥ −8 dB. In these eyes, the number of points ranged from 1 to 54 (mean: 25.7 ± 12.6 points). The exception did have two points at −10 dB on the 10–2, and the preserved region on the 10–2 pattern deviation plot agreed with the regions of remaining cpRNFL as can be seen in Supplement C (available at http://www.ophthalmologyglaucoma.org).
Discussion
It is commonly assumed that OCT cannot be used for following eyes with advanced glaucoma. Here, we tested the hypothesis that eyes with 24–2 VF MD values worse than −15 dB will have preserved cpRNFL in the region of the disc associated with the macular region of the retina if the TD plot of the 10–2 has one or more locations with a TD value better than −8 dB.
Of the 39 eyes with advanced glaucoma in the present study, all had a recognizable cpRNFL in the macular region, and all but one had between 1 and 54 points on a 10–2 VF that were better than −8 dB. How do we reconcile this finding with the commonly held belief? Recall that this belief is based upon studies showing that global cpRNFL thickness asymptotes when the 24–2 VF MD is less than about −10 to - 15 dB.2–8 However, other studies have shown that this holds for a smaller portion of the disc as well. For example, a series of studies by Hood, Kardon and colleagues3,17,18, showed that the cpRNFL thickness of local regions of the disc also reached an asymptote at around −10 to −15 dB when compared to the local region of the VF associated with these disc regions. In their studies, the disc regions were about 45° in diameter. Based upon these findings, Hood and De Moraes suggested that cpRNFL tissue should be visible if the 24–2 or 10–2 had one or more VF points better than about −8 dB.12 The results of the present study are consistent with this hypothesis.
There are three limitations of this study that are worth mentioning. First, the sample size is relatively small. This is due to the fact that it was a retrospective study and many eyes with advanced glaucoma do not have 10–2 VF with the standard size III stimulus. Second, the literature suggests that over 20% of patients seen in practice have advanced glaucoma.19,20 Thus, it is of interest to know how many of these eyes can be followed with OCT scans. Because our study was a retrospective review, we cannot answer this question. We need a prospective study of advanced glaucoma eyes defined by a 24–2 VF MD worse than −15 dB and/or a cpRNFL thickness less than a particular value. What we can say is: if the 10–2 VF has points better than −8 dB, we predict it can be followed with OCT. Further, it is worth noting that we also predict that eyes with locations of the 24–2 VF better than −8 dB will have preserved cpRNFL in the corresponding region of the disc. Third, the assessment of cpRNFL was qualitative. While these regions are relatively easy to identify on B-scans, automated segmentation can be used in most cases as well. Combining automated segmentation with a region of interest approach offers the possibility of a completely automated, quantitative approach.21 Finally, such a quantitative cpRNFL measure would allow future work to answer two other important questions concerning the use of OCT to follow advance glaucoma. One, what is the repeat reliability of a cpRNFL measure, and two, how does it compare to other OCT measures such as RGC thickness.22–24 However, as we have previously pointed out, glaucoma specialists should not simply rely on summary metrics; they should examine the scan images as well.12,14
To conclude, OCT scans can be used to assess the preserved regions of cpRNFL associated with the macula in eyes with advanced glaucoma, if there is a preserved region on the 10–2 VF better than −8 dB. This suggests that these preserved regions can be followed as a way to evaluate progression in these eyes with advanced glaucoma.
Supplementary Material
Acknowledgments
Financial Support: NIH/NEI Grants RO1-EY02115
Footnotes
Publisher's Disclaimer: This is a PDF file of an unedited manuscript that has been accepted for publication. As a service to our customers we are providing this early version of the manuscript. The manuscript will undergo copyediting, typesetting, and review of the resulting proof before it is published in its final citable form. Please note that during the production process errors may be discovered which could affect the content, and all legal disclaimers that apply to the journal pertain.
Conflict of Interest: DCH: Topcon, Inc; Heidelberg Engineering, Inc.
References
- 1.Schuman JS, Hee MR, Puliafito CA, et al. Quantification of nerve fiber layer thickness in normal and glaucomatous eyes using optical coherence tomography. Archives of ophthalmology (Chicago, III: 1960). 1995;113(5):586–596. [DOI] [PubMed] [Google Scholar]
- 2.Medeiros FA, Lisboa R, Weinreb RN, Girkin CA, Liebmann JM, Zangwill LM. A combined index of structure and function for staging glaucomatous damage. Archives of ophthalmology (Chicago, Ill: 1960). 2012;130(5):E1–10. [PubMed] [Google Scholar]
- 3.Hood DC, Kardon RH. A framework for comparing structural and functional measures of glaucomatous damage. Progress in retinal and eye research. 2007;26(6):688–710. [DOI] [PMC free article] [PubMed] [Google Scholar]
- 4.Zangwill LM, Williams J, Berry CC, Knauer S, Weinreb RN. A comparison of optical coherence tomography and retinal nerve fiber layer photography for detection of nerve fiber layer damage in glaucoma. Ophthalmology. 2000;107(7):1309–1315. [DOI] [PubMed] [Google Scholar]
- 5.El Beltagi TA, Bowd C, Boden C, et al. Retinal nerve fiber layer thickness measured with optical coherence tomography is related to visual function in glaucomatous eyes. Ophthalmology. 2003;110(11):2185–2191. [DOI] [PubMed] [Google Scholar]
- 6.Kanamori A, Nakamura M, Escano MF, Seya R, Maeda H, Negi A. Evaluation of the glaucomatous damage on retinal nerve fiber layer thickness measured by optical coherence tomography. American journal of ophthalmology. 2003;135(4):513–520. [DOI] [PubMed] [Google Scholar]
- 7.Leung CK, Yung WH, Ng AC, Woo J, Tsang MK, Tse KK. Evaluation of scanning resolution on retinal nerve fiber layer measurement using optical coherence tomography in normal and glaucomatous eyes. Journal of glaucoma. 2004;13(6):479–485. [DOI] [PubMed] [Google Scholar]
- 8.Sihota R, Sony P, Gupta V, Dada T, Singh R. Diagnostic capability of optical coherence tomography in evaluating the degree of glaucomatous retinal nerve fiber damage. Investigative ophthalmology & visual science. 2006;47(5):2006–2010. [DOI] [PubMed] [Google Scholar]
- 9.Abrams LS, Scott IU, Spaeth GL, Quigley HA, Varma R. Agreement among optometrists, ophthalmologists, and residents in evaluating the optic disc for glaucoma. Ophthalmology. 1994;101(10):1662–1667. [DOI] [PubMed] [Google Scholar]
- 10.Gardiner SK, Swanson WH, Goren D, Mansberger SL, Demirel S. Assessment of the reliability of standard automated perimetry in regions of glaucomatous damage. Ophthalmology. 2014;121(7):1359–1369. [DOI] [PMC free article] [PubMed] [Google Scholar]
- 11.Blumenthal EZ, Sapir-Pichhadze R. Misleading statistical calculations in far- advanced glaucomatous visual field loss. Ophthalmology. 2003;110(1):196–200. [DOI] [PubMed] [Google Scholar]
- 12.Hood DC, De Moraes CG. Four Questions for Every Clinician Diagnosing and Monitoring Glaucoma. Journal of glaucoma. 2018;27(8):657–664. [DOI] [PMC free article] [PubMed] [Google Scholar]
- 13.Hood DC, Raza AS, de Moraes CG, Liebmann JM, Ritch R. Glaucomatous damage of the macula. Progress in retinal and eye research. 2013;32:1–21. [DOI] [PMC free article] [PubMed] [Google Scholar]
- 14.Hood DC. Improving our understanding, and detection, of glaucomatous damage: An approach based upon optical coherence tomography (OCT). Progress in retinal and eye research. 2017;57:46–75. [DOI] [PMC free article] [PubMed] [Google Scholar]
- 15.Drasdo N, Millican CL, Katholi CR, Curcio CA. The length of Henle fibers in the human retina and a model of ganglion receptive field density in the visual field. Vision research. 2007;47(22):2901–2911. [DOI] [PMC free article] [PubMed] [Google Scholar]
- 16.Jansonius NM, Nevalainen J, Selig B, et al. A mathematical description of nerve fiber bundle trajectories and their variability in the human retina. Vision research. 2009;49(17):2157–2163. [DOI] [PMC free article] [PubMed] [Google Scholar]
- 17.Hood DC. Relating retinal nerve fiber thickness to behavioral sensitivity in patients with glaucoma: application of a linear model. Journal of the Optical Society of America A, Optics, image science, and vision. 2007;24(5):1426–1430. [DOI] [PubMed] [Google Scholar]
- 18.Hood DC, Anderson SC, Wall M, Kardon RH. Structure versus function in glaucoma: an application of a linear model. Investigative ophthalmology & visual science. 2007;48(8):3662–3668. [DOI] [PubMed] [Google Scholar]
- 19.Crabb DP, Saunders LJ, Edwards LA. Cases of advanced visual field loss at referral to glaucoma clinics - more men than women? Ophthalmic & physiological optics. 2017;37:82–87. [DOI] [PubMed] [Google Scholar]
- 20.Boodhna T, Crabb DP. Disease severity in newly diagnosed glaucoma patients with visual field loss: trends from more than a decade of data. Ophthalmic & physiological optics. 2015;35:225–230. [DOI] [PubMed] [Google Scholar]
- 21.Wu Z, Thenappan A, DSD W, Ritch R, Hood DC. Detecting glaucomatous progression with a region-of-interest approach on optical coherence tomography: a signal-to-noise evaluation. Translational vision science & technology. 2018;7(1):19. [DOI] [PMC free article] [PubMed] [Google Scholar]
- 22.Belghith A, Medeiros FA, Bowd C, et al. Structural Change Can Be Detected in Advanced-Glaucoma Eyes. Investigative ophthalmology & visual science. 2016;57(9):October511–518. [DOI] [PMC free article] [PubMed] [Google Scholar]
- 23.Bowd C, Zangwill LM, Weinreb RN, Medeiros FA, Belghith A. Estimating Optical Coherence Tomography Structural Measurement Floors to Improve Detection of Progression in Advanced Glaucoma. American journal of ophthalmology. 2017;175:37–44. [DOI] [PMC free article] [PubMed] [Google Scholar]
- 24.Lavinsky F, Wu M, Schuman JS, et al. Can Macula and Optic Nerve Head Parameters Detect Glaucoma Progression in Eyes with Advanced Circumpapillary Retinal Nerve Fiber Layer Damage? Ophthalmology. 2018;125(12):1907–1912. [DOI] [PMC free article] [PubMed] [Google Scholar]
Associated Data
This section collects any data citations, data availability statements, or supplementary materials included in this article.


