Abstract.
Convolutional neural networks (CNNs) offer a promising means to achieve fast deformable image registration with accuracy comparable to conventional, physics-based methods. A persistent question with CNN methods, however, is whether they will be able to generalize to data outside of the training set. We investigated this question of mismatch between train and test data with respect to first- and second-order image statistics (e.g., spatial resolution, image noise, and power spectrum). A UNet-based architecture was built and trained on simulated CT images for various conditions of image noise (dose), spatial resolution, and deformation magnitude. Target registration error was measured as a function of the difference in statistical properties between the test and training data. Generally, registration error is minimized when the training data exactly match the statistics of the test data; however, networks trained with data exhibiting a diversity in statistical characteristics generalized well across the range of statistical conditions considered. Furthermore, networks trained on simulated image content with first- and second-order statistics selected to match that of real anatomical data were shown to provide reasonable registration performance on real anatomical content, offering potential new means for data augmentation. Characterizing the behavior of a CNN in the presence of statistical mismatch is an important step in understanding how these networks behave when deployed on new, unobserved data. Such characterization can inform decisions on whether retraining is necessary and can guide the data collection and/or augmentation process for training.
Keywords: deformable image registration, convolutional neural networks, image quality
1. Introduction
Convolutional neural networks (CNNs) are increasingly being investigated as a method for deformable registration in medical imaging1–6 due to their fast runtime and ability to learn complex functions without explicit physical models. Compared to conventional methods for image registration such as B-spline free-form deformation7 and variations on diffeomorphic registration,8–11 CNN-based methods are not only generally much faster1,4 but also provide a parameter-free, noniterative interface for achieving registration. However, a recurring question associated with CNN methods is the generalizability of the model beyond the data presented in the training set. This question is commonly addressed by dividing the data into train and test sets and performing cross-validation studies. However, the random sampling associated with this method enforces that the train and test data have the same population statistics, which could be unrealistic for various application scenarios in medical imaging. A direct example of this effect was shown by Eppenhof and Pluim,4 who performed CNN-based registration on pulmonary CT images and examined two separate data sets, DIR-Lab12,13 (images acquired using a GE Discovery ST PET/CT scanner) and CREATIS14,15 (images acquired using a Philips 16-slice Brilliance Big Bore Oncology Configuration). They reported that when the network was trained on DIR-Lab images alone, the results on cross-validated studies were optimistic compared to the results obtained by testing on the CREATIS dataset. One explanation for this deficit is that the network—having only been trained on one dataset—was not able to fully generalize to the statistical mismatch that existed between the datasets from two different scanner manufacturers—each with distinct acquisition and reconstruction protocols and, therefore, spatial resolution and noise characteristics.
Statistical mismatch—by which we mean a difference in some statistical characteristic of the image data, including first-order statistics (e.g., signal power and spatial resolution) and second-order statistics (e.g., noise and noise–power spectrum)—is of particular concern in medical imaging, where small data sets are unlikely to capture large variations observed in the population. For example, even within a single anatomical region and the relatively reproducible modality of CT imaging, first- and second-order statistics can vary widely based on the scanner manufacturer, scanning protocol (e.g., dose or beam energy), reconstruction protocol, and postprocessing technique. Training with all possible variations encountered in practice would be impractical and require unrealistically large training sets. Therefore, in scenarios with known statistical mismatch from the training set, the user opts either to retrain the network or assume the network would reasonably generalize to the test data. For example, when the statistical characteristics of the data are substantially mismatched (e.g., application to magnetic resonance images using a model trained on CT images), the need to retrain or apply transfer learning is clear. However, with known differences in first- and second-order image statistics between the training and test data, (e.g., training on high-dose and testing on low-dose data), generalizability of the model may be possible with a clear understanding of the extent and the limitations of generalizability.
In this work, we used a classical CNN model for deformable image registration to examine the effect of statistical mismatch in image noise, spatial resolution, and deformation magnitude. We trained the network under a variety of statistical conditions in simulated image data and measured performance (registration accuracy) as the statistical characteristics of the test data deviated from those of the training data. Although preliminary studies16 evaluated the effect of statistical mismatch in image noise alone, the work reported below extends the analysis to examine the effects of spatial resolution and deformation magnitude as additional sources of variability. Furthermore, we conducted experiments comparing the performance of networks trained on data containing wide- versus narrow-range variations in statistical characteristics. Finally, we validated the findings of these experiments by deploying the networks (trained on simulated image content alone) on anatomical image content.
2. Methods
2.1. Deformable Registration Techniques
CNN-based methods for performing deformable registration are generally grouped into three categories with respect to training: supervised, semisupervised, and unsupervised. Supervised methods rely upon accessibility to ground truth, dense displacement vector fields, where the error between the predicted and known displacement fields is directly minimized. The ground truth displacement fields are typically generated by interpolating a displacement field based on corresponding landmarks17 or applying known displacement fields to simulate deformation.4,18 Semi- or unsupervised techniques, on the other hand, still predict an output displacement vector field; however, the network further incorporates a spatial transformer such that, during training, an image similarity measure may be optimized,2,5,6 which can be paired with deformation-field regularization to yield cost functions similar to that of the conventional registration techniques.19 Furthermore, another active area of research considers adversarial20 methods (which can be performed in both supervised and unsupervised settings), where the training comprises alternating optimization of a generator network (i.e., a deformation field estimator) and a discriminator network (e.g., which predicts whether or not the registration comes from ground truth or the generator).1
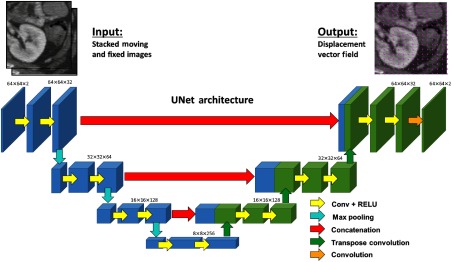
In this work, we use a supervised approach in which ground truth deformations were simulated, ensuring that the errors observed arise from the network and training conditions, rather than potential errors in ground truth definitions or suboptimality of the similarity metric. Based on the popularity of the U-Net21 and the potential for the results to be generalized to other CNN applications, this work examined a modified 2-D version of the SVF-Net17 for deformable image registration, which is based upon the U-Net architecture. As illustrated in Fig. 1, the network takes the stacked 2-D images (moving and fixed) to be registered as input and produces the displacement vector field as the output. The network was implemented in TensorFlow and was trained in a supervised manner with the ground truth displacement fields (discussed in Sec. 2.3.1) and optimized over an L2 loss function on the error in the predicted displacement field using the Adam optimizer22 with a learning rate of 0.0005.
Fig. 1.
CNN architecture adapted from SVF-Net for 2-D (slice) image registration. The two stacked image patches are supplied as input, and the output is the 2-D displacement vector field. Blue and green coloring of the features is included to explicitly depict the concatenation step.
For comparison, we also examined the performance of conventional registration methods that are based on physical models (compared to learning-based methods). These included the fast symmetric forces demons algorithm23 and B-spline free-form deformation7 as implemented in SimpleITK.24 For each algorithm, we utilized a morphological pyramid and optimized the displacement field smoothing parameters (demons) and number of control points (B-spline).
2.2. Statistical Evaluation of Image Registration
When examining registration performance with respect to statistical measures of image quality, it is useful to compare the experimental registration performance with respect to fundamental error bounds. Recent work25,26 quantitatively related the image content and noise statistics to image registration accuracy. Examination of translation-only rigid registration yielded theoretical results on the Cramér–Rao lower bound (CRLB) for the root-mean-square error (RMSE) of unbiased registration estimators. As described by Ketcha et al.,25,26 the CRLB is dependent on the signal power spectrum of the true image content and the noise-power spectra of the two images (including stochastic variations due to quantum noise). In the case of high signal-to-noise ratio, this bound is approximately proportional to when registering equal-dose CT images. By approximating deformable registration as independent, locally rigid translation-only registrations at each pixel, we may apply the CRLB to the context of deformable registration. A variety of properties of deformable registration may violate the above assumptions, such as bias and the lack of independence due to regularization of deformation field. However, the CRLB still provides a useful baseline of an ideal estimator to compare registration performance of different algorithms. Derivation of the CRLB for this deformable case was achieved through a sliding window computation of the rigid CRLB over the image to determine an approximate deformable CRLB at each pixel location (as described by Ketcha et al.16). The resulting bound (computed as a function of dose) is shown as a limiting case in comparison to the registration performance of various conventional and CNN-based registration methods in the results shown below.
2.3. Experimental Methods
2.3.1. Test image generation
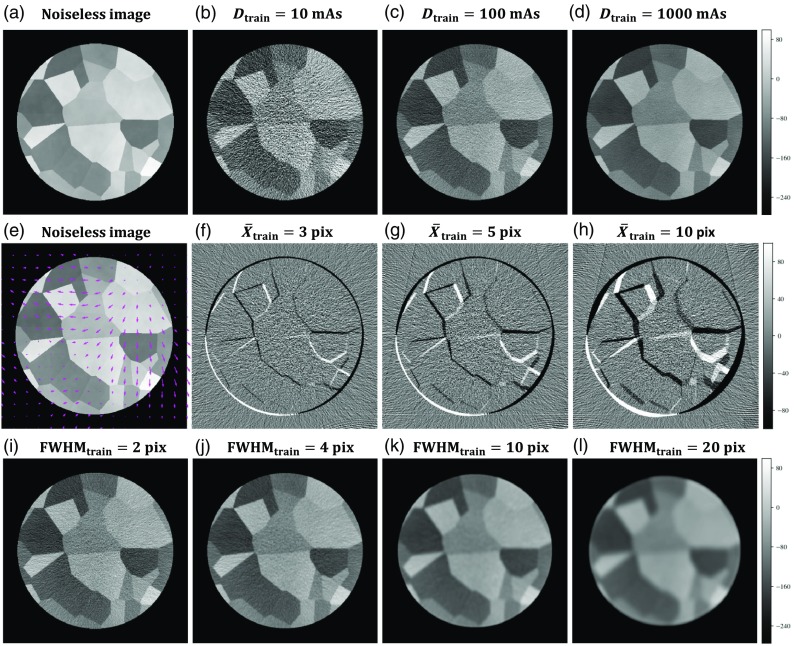
Training and test images were generated by sampling from a Voronoi image distribution, where seed points were uniformly and randomly sampled within the image, and piece-wise constant regions were subsequently defined by randomly sampling from CT Hounsfield units (HU) in the soft-tissue range ( to 90 HU). Recent work25 showed this content to follow a power-law distribution (commonly used to model soft-tissue anatomy27,28), where the 2-D Voronoi image content has a power spectrum closely following with . Since piece-wise constant content produces degenerate solutions in deformable image registration, a small amount of clutter content (10 HU standard deviation) was added to the image by directly sampling from a distribution. The image content was cropped to a 32-cm diameter cylinder with isotropic 0.68 mm pixel size (regions external to the cylinder defined to be air), yielding images as shown in Fig. 2(a).
Fig. 2.
Image generation. The simulated noiseless image (a) is injected with noise to form the moving image with (b)–(d) showing example images at 3 dose levels (where dose is linearly related to the x ray tube current-time product, mAs). Displacement vector fields are applied to the noiseless image (e) prior to noise injection to generate the fixed image with (f)–(h) showing the difference images of the fixed and moving images prior to registration for three levels of deformation magnitude. (i)–(l) Variations on the apodization filter cutoff allow for reconstruction at various spatial resolutions.
Ground truth displacement fields were simulated by sampling - and -components from a power-law () distribution to generate smoothly varying deformation. The displacement fields were applied to the noiseless images, after which realistic CT noise was injected into both the original and warped images. The noise injection process involved converting the image from HU to attenuation coefficients, performing 360 digital forward projections over 360 deg, injecting Poisson noise in the projection domain, and reconstructing using filtered back-projection. The magnitude of quantum noise was adjusted by scaling the fluence associated with the forward projection according to a specified dose level (quantified by tube-current-time product, mAs) using the SPEKTR toolkit.29 Furthermore, the spatial resolution in the image was adjusted by varying the cutoff frequency of the Hann apodization filter applied during reconstruction. The primary contributor to spatial resolution in this simulation was the apodization filter, and the full-width at half-maximum (FWHM) of the point spread function was approximated as the inverse of the Hann cutoff frequency. Following noise injection, corresponding pixel patches were sampled from the original and warped images for use as training and test data. Although training minimized error on the full displacement field, evaluation on test data was performed by measuring the mean target registration error (TRE) at corner points within the test image patches (defined unambiguously by the intersection points among three Voronoi regions).
The process described above presented three distinct experimental parameters for investigating the effect of statistical mismatch between training and test data: (1) the image noise (i.e., quantum noise), controlled by variation of dose (referred to as and ); (2) the spatial resolution, controlled by variation of the FWHM (denoted and ); and (3) the mean deformation magnitude (denoted and ). Variations in the images associated with variation of these parameters are depicted in Fig. 2.
2.3.2. Mismatch in noise magnitude
Training data in medical imaging, particularly in retrospective studies, are often limited in the diversity of dose levels exhibited. As a result, the dose levels observed during network deployment could vary widely from those observed during training. The following experiments examined the effect of statistical mismatch of noise between training and test data.
-
(1)
Single-dose training. CNNs were trained with data from a single-dose level (e.g., ) on image patch pairs, each with and uniformly sampled from (0.01, 0.1, 1, 3, 5, 10) px. For each dose condition (ranging from 5 to 1500 mAs), 11 networks were trained from random initialization, and the TRE was examined as a function of the difference of the dose in test data () from that in training data.
-
(2)
Diverse-dose training. Additional experiments examined the effect of training on a dataset containing a diverse range of dose levels. CNNs were trained on image patch pairs with dose levels uniformly sampled from (5, 10, 50, 100, 500, 1000, 1500) mAs. Additionally, a separate network was trained in a sparse manner, observing only two dose levels: 54,000 image patch pairs at 10 mAs and 54,000 image patch pairs at 1500 mAs. The networks were then evaluated by examining TRE as a function of the dose of the test image.
2.3.3. Mismatch in image resolution
Spatial resolution is another factor that is often variable in the population that could be sparsely represented in a training data set (e.g., a data set with all images acquired with the same make/model/manufacturer of scanner with particular postprocessing/reconstruction protocols). The following experiments examined the effect of statistical mismatch in spatial resolution between training and test data.
-
(1)
Single-resolution training. CNNs were trained observing data from a single-resolution level (e.g., ) on image patch pairs, each with uniformly sampled from (5, 10, 50, 100, 500, 1000, 1500) mAs and uniformly sampled from (1, 3, 5, 10) px. For each FWHM condition (ranging from 2 to 20 px), a single network was trained from random initialization, and the TRE was examined as the resolution of the test data () diverged from that of the training data.
-
(2)
Diverse-resolution training. Additional experiments examined the effect of training on a data set containing a diverse range of resolution levels. CNNs were trained on image patch pairs with resolution levels uniformly sampled from Hann frequency cutoffs ranging from 0.1 to (with increments of ), yielding values ranging from 2 to 20 px. The network was then evaluated by examining TRE as a function of the resolution of the test image.
2.3.4. Mismatch in deformation magnitude
The magnitude and range of soft-tissue deformation is a statistical characteristic that is often difficult to control when curating a training data set and is perhaps even more difficult to control when the network is deployed in a particular application. Therefore, it is important to understand how the network behaves as the statistics of the deformation differ between the test and training data.
-
(1)
Single-deformation magnitude training. CNNs were trained using data from only a single-mean deformation magnitude level (e.g., ) on image patch pairs, each with and uniformly sampled from (5, 10, 50, 100, 500, 1000, 1500) mAs. For each condition (ranging from 0.01 to 10 px), a single network was trained from random initialization, and the TRE was examined as the mean deformation magnitude of the test data () diverged from that of the training data.
-
(2)
Diverse deformation magnitude training. Additional experiments examined the effect of training on a dataset containing a diverse range of mean deformation magnitude. CNNs were trained on image patch pairs with uniformly sampled from (0.01, 0.1, 1, 3, 5, 10) px. The network was then evaluated by examining TRE as a function of the mean deformation magnitude of the test image.
2.3.5. Testing on anatomical image content
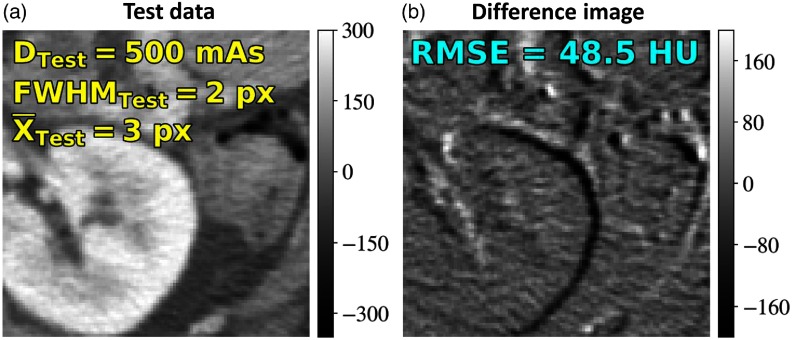
Networks trained on Voronoi images in the above experiments were applied to registration of real anatomy (a patient image from an IRB-approved study) in axial CT abdominal images [proximal to the kidney, as in Fig. 3(a)]. The noise injection and deformation process described in Sec. 2.3.1 was applied to the image to generate a registration scenario with , , and yielding a fixed and moving image. The difference image prior to registration is shown in Fig. 3(b). Note that due to the architecture, even though the network was trained on patches, it can be deployed on the image (and larger power of 2 image sizes) without modification.
Fig. 3.
Testing on anatomical content after training on Voronoi images. (a) Moving and fixed images were generated at , , and , yielding the difference image in (b).
The noise injection/deformation process was similarly applied to 10 abdominal CT images from The Cancer Imaging Archive (TCIA)30–33 to examine the performance of the diversely trained networks on real anatomy. Each of the 10 images was reconstructed under various conditions of dose, resolution, and deformation magnitude and cropped to image patch pairs focusing on soft-tissue regions of interest. For each experimental condition, the noise and deformation injection process was repeated 10 times per image, yielding 100 total image pairs. In each image, 10 conspicuous soft-tissue anatomical landmarks were selected for evaluation of TRE. The diversely trained networks were then deployed on these image patch pairs, and TRE was examined as a function of test image dose, resolution, and deformation magnitude.
3. Results
3.1. Registration Results: Effect of Noise Mismatch
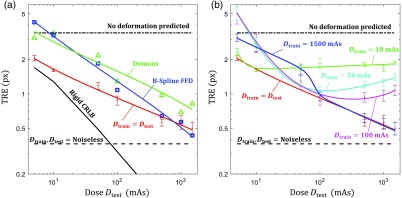
Figure 4 shows TRE performance as a function of test image dose (with and ) for the conventional registration methods and the CNN-based method at several training conditions. To provide context, the results were assessed relative to the bounds imparted by three figures of merit: (1) the “no deformation predicted” line, referring to the error associated with predicting a null displacement field; (2) the and “noiseless”line, referring to the performance when train and test data are noiseless, yielding an optimal bound that noisy data should not exceed; and (3) the CRLB for rigid registration, indicating ideal registration performance as a function of dose for unbiased estimators.
Fig. 4.
Registration performance as a function of test image dose. (a) TRE as a function of for single-dose training statistically matched CNN (, red), demons (green triangle), and B-spline FFD (blue square). These results are generally bounded by the rigid CRLB (black line), the predict no deformation line (black dot-dash), and the , noiseless error (black dashed). (b) TRE as a function of for single-dose training CNNs showing the effect of mismatched statistics for values of 10 (green), 50 (cyan), 100 (magenta), and 1500 (blue) mAs.
Figure 4(a) illustrates CNN registration performance in the statistically matched case (, red line) where the dose of the training data exactly matches that of test data; each point shows the TRE (mean ± std) for 11 networks trained at that dose level with 11 random initializations (e.g., the data point at indicates the performance of networks trained at ). The and datapoints only show the results of 3 and 2 trained networks, respectively, as most of the 11 randomly initialized networks did not successfully converge under these conditions, indicating the high sensitivity associated with training only on very noisy data. Generally, we see that CNN registration error was reduced with higher dose and yielded comparable or better performance to the conventional registration methods—outperforming the conventional methods in the low-dose range and achieving subpixel TRE in the high-dose range (down to 0.5 px TRE at 1500 mAs). The demons and CNN methods appeared to trend similarly as a function of dose, whereas B-spline FFD presented a steeper reduction in error with increased dose. None of the methods, however, closely followed the trend set by the CRLB in rigid registration, indicating that the assumption of independent, locally rigid registration is a weak approximation to deformable registration, although the CRLB still appears to present a reasonable lower limit to performance.
Figure 4(b) shows CNN registration performance for networks trained with only a single-dose level. Examination of the high-dose training condition shows similar performance to the case for a large range of test image dose levels—down to , where the registration performance begins to diverge from the statistically matched condition. Interestingly, for the CNNs trained at lower dose levels, we observe that registration performance plateaus (and even slightly increases) as the dose of the test image exceeds that of training images, indicating that there is no benefit in deploying the network on images acquired at higher dose (and lower noise) than the training data. Furthermore, these lower-dose training conditions did not exhibit a large range of robustness, where networks trained at 50 mAs yielded similar performance to those trained at 1500 mAs when tested on 10 mAs images (2.73 versus 2.52 px mean TRE).
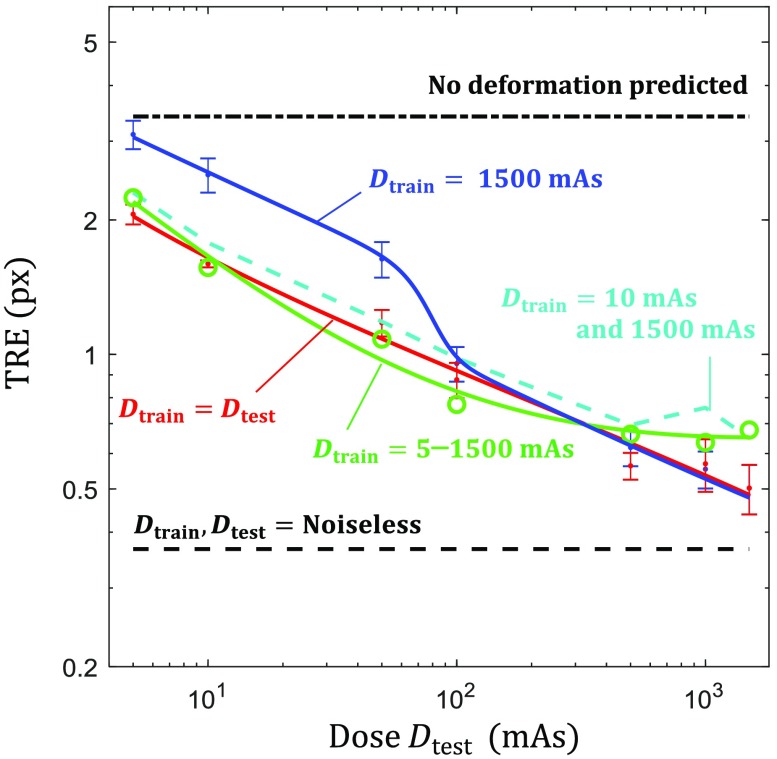
Dashed curves in Fig. 5 show the registration error as a function of test image dose for CNNs trained at diverse dose conditions. First, we observe that performance for the single network trained on a diversity of images with dose levels ranging from 5 to 1500 mAs closely matched the performance of the multitude of networks associated with the curve, with only a slight reduction in the performance in the very high-dose region. Furthermore, the network trained at only two dose levels, with half the training data at 1500 mAs and half at 10 mAs, yielded nearly the same performance as the highly diverse to 1500 mAs network, indicating that a wide range of dose levels (not necessarily densely or uniformly sampled) may be sufficient to diversify the training set.
Fig. 5.
Diverse dose training. The green ( to 1500 mAs) line shows TRE performance for the diversely trained (with respect to dose) network and the cyan dashed line depicts error when half the training data were 10 mAs and half were 1500 mAs. The blue () and red () solid lines from Fig. 4 are provided for reference.
3.2. Registration Results: Effect of Image Resolution Mismatch
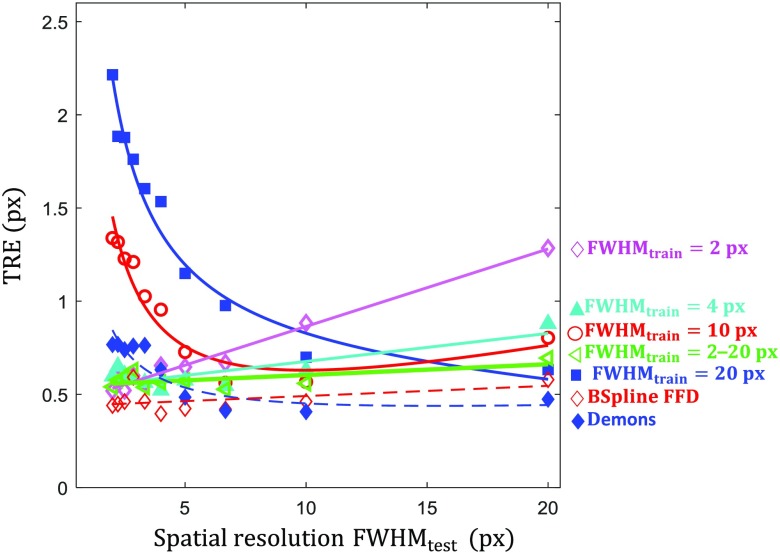
Figure 6 shows the TRE measured as a function of the spatial resolution (FWHM) in the test images (with and ). The curve (magenta) shows the performance of a network trained on high-resolution images, where we observe a linear increase in error as networks are tested on lower resolution images. The training (cyan) provides increased robustness (compared to ) in the low-resolution test region, and the performance is only slightly reduced in the high-resolution range. However, training on very low-resolution data ( [red] and [blue]) does not generalize to high-resolution test data, with a steep increase in error as the resolution of the test data exceeds that of the training data. We see again the diverse training network (green) generalizes well, providing near optimal performance across the entire range of tested image resolution levels. Comparison of the CNN performance with the conventional methods initially indicates that the conventional methods nearly always outperform the network; however, this can be attributed to two factors: (1) each data point for the conventional methods represents the TRE for best performing parameter selection at that FWHM test condition therefore it represents a “best-case” for the conventional methods and (2) the testing is performed on high-dose images where similar performance was observed [Fig. 4(a)] among the conventional and CNN-based methods.
Fig. 6.
Effect of image spatial resolution. TRE results as a function of for CNNs trained at various spatial resolutions: (magenta diamond), 4 (cyan triangle), 10 (red circle), and 20 (blue square) px. The green line ( to 20 px, sideways triangle) shows registration performance for the diversely trained (with respect to FWHM) network. Dashed lines show the performance of demons and B-spline FFD for comparison.
3.3. Registration Results: Effect of Deformation Mismatch
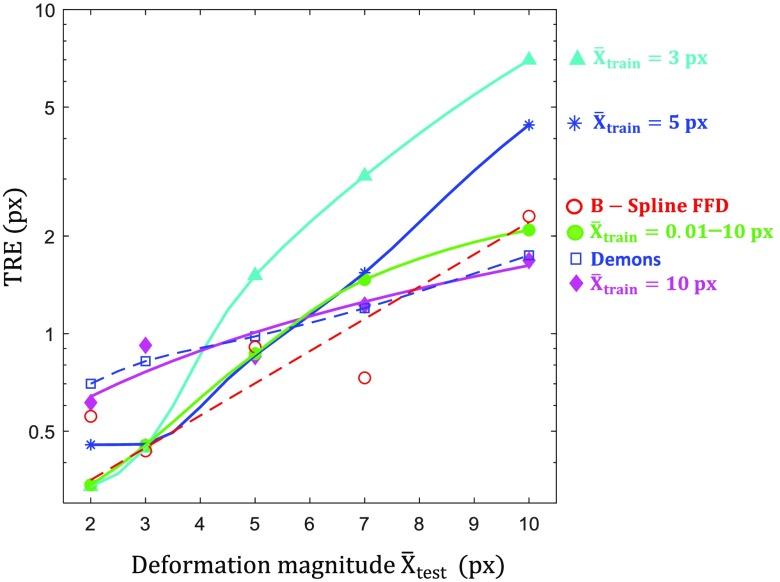
Figure 7 shows registration performance of the CNN as a function of (with and ) for networks trained with fixed mean displacement magnitude, . The experimental error generally increases as the deformation magnitude increases (as the registration becomes more difficult to solve); however, among each deformation level, the best performance is observed when training and test data are statistically matched (i.e., ). At large deformation () subpixel error is no longer achieved, and the best performing network at that condition () exhibited a mean TRE of 1.68 px. Although networks generalized well when , a sharp increase in error occurs if exceeded the mean displacement magnitude of the training conditions. However, it should be noted that high data will still likely contain regions of small deformation, aiding the ability to generalize. The diversely trained to 10 px condition yielded a good compromise on performance across all test conditions.
Fig. 7.
Effect of mismatch in mean deformation magnitude. TRE measured as a function of mean displacement magnitude for CNNs trained at 3 (cyan triangle), 5 (blue star), and 10 (magenta diamond) px. The green line shows registration performance for the diversely trained (with respect to ) network. Dashed lines show the performance of demons and B-spline FFD for comparison.
3.4. Registration Results: Testing on Anatomical Image Content
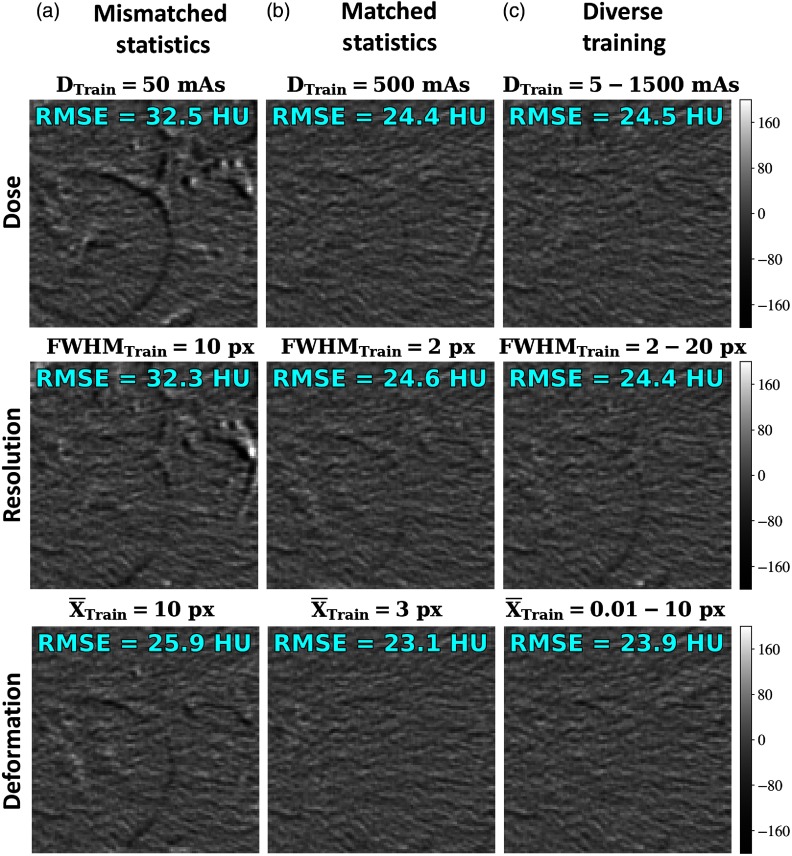
Figure 8 shows the registration performance for networks trained on Voronoi content alone and tested a real anatomy in axial CT abdominal images. Registration results are shown in terms of the difference images following registration, with the RMSE difference in pixel intensity (HU) shown in each case. The rows are organized according to the three prior experiments, examining the effect of dose, resolution, and deformation magnitude, respectively. The columns represent three conditions: mismatched statistics, matched statistics, and diverse training. Considering the difference images and RMSE values following registration, we observe results consistent with the results described above—namely, that matching the statistics of the training data to those of the test data tends to be optimal, but training on diverse datasets provides comparable (and generally more robust) performance. Furthermore, it is promising that training on Voronoi images alone yielded reasonable registration performance in real anatomy, providing another validation to the Voronoi training model and noting that Voronoi images were previously shown12 to share second-order statistical characteristics (i.e., power-law spectrum) with real anatomy.
Fig. 8.
Testing on anatomical content. Difference images following registration (original images shown in Fig. 3) are shown for networks at various training conditions. RMSE of the difference in HU is shown in text for each image. Columns represent conditions of (a) mismatched training and test statistics, (b) matched statistics, and (c) diverse training. Rows examine various training conditions for dose, resolution, and deformation magnitude.
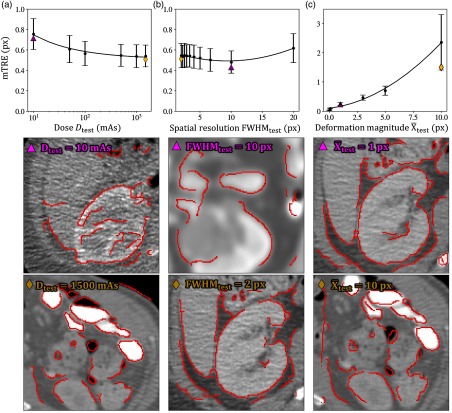
Figure 9 further demonstrates the performance of the diversely trained networks applied to images of real anatomy. Figure 9 shows the distributions (mean ± 1 standard deviation, computed over 100 image pairs) of the mean TRE for each image pair (mTRE, computed from 10 landmarks per image pair) for the diversely trained networks. Figure 9(a) shows the performance for the diversely trained network ( to 1500 mAs) and demonstrates a reduction in mTRE with increased dose (holding and ). The mean of the mTRE measurements exhibits a 1/sqrt dependence on dose () in agreement with the statistical model presented in Sec. 2.2. Example images representing the median performance at low- and high-dose levels are shown below each plot, with Canny edges overlaid on the registered image. Similarly, Fig. 9(b) shows the performance of the diversely trained () network applied to images generated at various levels of spatial resolution (holding and ). A nonmonotonic (quadratic) dependence on spatial resolution () is exhibited () with weak correlation to ( variation in mean mTRE over the full range of ). Finally, Fig. 9(c) shows results for the diversely trained ( to 10 px) network as a function of the test image deformation magnitude (holding and ), also demonstrating a roughly quadratic dependence () on the mean fit. Although the trends in mean of the mTRE measurements are consistent with basic models of performance (e.g., 1/sqrt dependence on dose), the individual mTRE measurements exhibit high variability, and fitting the collection of mTRE measurements (rather than the per-condition mean) to the models tested above exhibits low correlation [, 0.02 and 0.43 for Figs. 9(a)–9(c), respectively]. Thus the experimental variables are not strongly predictive of mTRE for a single image (e.g., a noisy image may spuriously yield more accurate registration than a higher dose image); however, the overall trends in mean mTRE were as expected. Overall, image registration is robustly achieved, except perhaps for the case of large test image deformation in Fig. 9(c). In each case, the trends in TRE reflect that of the registration errors shown above for the diversely trained networks applied to Voronoi test images (Figs. 5–7, respectively), again validating the use of Voronoi content as a statistical model for registration training that appears to transfer reasonably well to registration of real anatomy.
Fig. 9.
Registration error mTRE (mean ± 1 standard deviation) of the diversely trained networks applied to anatomical content as a function of the TCIA test image: (a) dose, (b) spatial resolution, and (c) deformation magnitude. Below each plot, are the median performers for two test conditions with the symbol on the image referring to the plotted symbol in the associated graph.
4. Discussion and Conclusion
The quality—and statistical characteristics—of medical images varies widely, depending on the imaging system, image acquisition protocol (e.g., dose level), reconstruction method (e.g., smoothing filters), and postprocessing techniques. Accordingly, it can be difficult to curate training data that is fully representative of the population statistics. Therefore, an understanding of the behavior of the network as the statistics of the test data deviate from those of the training data helps to ensure reliability of the network and/or determine whether additional data collection or augmentation is necessary. In this work, we specifically studied statistical mismatch in the form of image noise, spatial resolution, and deformation magnitude, generally finding that exactly matching the statistics is optimal; however, training the network with data featuring a diversity of statistical characteristics yields a single model that tends to be robust across a broader range of test conditions.
The experiments in this work provided insight on the importance of the various statistical characteristics that were examined. For mismatch in dose, it was found that testing on higher dose images than present in the training set did not improve (and in fact, slightly diminished) registration performance. Although testing on images that were noisier (e.g., lower-dose) than the training data generalized well, the ability to maintain similar performance to the matched statistics case was limited. Performance was further improved by including a diverse range of dose levels in the training set, extending generalizability of the network—especially in the low-dose range (although slightly diminishing performance in the high-dose range). Interestingly, a training set composed of two distinct noise levels (e.g., high-dose data and low-dose data) yielded similar improvement, with performance comparable to that of a training set representing “all” intermediate noise levels.
For mismatch in spatial resolution, while there was a modest reduction in performance by testing on blurrier data than present in the training set (which is easy to account with blurring augmentation methods), testing on much higher resolution images was found to exhibit a steep reduction in performance. Networks trained only on low-resolution data sets are therefore unlikely to extend well to high-resolution test data.
With respect to deformation magnitude, we found it important to ensure that the test data deformation magnitude did not exceed that observed in the training data. Although the networks generalized better to smaller deformation scenarios, performance could be greatly improved by ensuring a wide range of deformation magnitude in the training data, which can be accomplished by augmenting the dataset with known deformations of various magnitudes.
Many of the parameters and hyperparameters in this study were explored in preliminary studies to determine nominal values and fixed for the rest of the experiments. Such parameters include the number of training images (fixed image patch pairs), the learning rate, and network size. It is certainly the case that robustness could be improved if low-dose networks had either more training data or a smaller network with fewer weights to learn. Future and ongoing work investigates these and similar questions in the context of other forms of statistical mismatch, such as displacement vector field smoothness and nonlinear intensity shifts (e.g., due to change in beam energy for CT or T1/T2 weighting in MRI). Furthermore, the extent to which these findings hold for different network architectures or training methods (e.g., including regularization on the parameter weights or performing unsupervised training) warrants investigation. It is also important to consider how these findings may hold in much smaller datasets, where “diverse” training may not provide enough high-quality data for successful training.
Biography
Biographies of the authors are not available.
Disclosures
The research was supported by NIH Grant No. R01-EB-017226 and collaboration with Siemens Healthineers.
Contributor Information
Michael D. Ketcha, Email: mketcha3@jhmi.edu.
Tharindu De Silva, Email: tsameera1@gmail.com.
Runze Han, Email: rhan5@jhmi.edu.
Ali Uneri, Email: ali.uneri@jhu.edu.
Sebastian Vogt, Email: sebastian.vogt@siemens-healthineers.com.
Gerhard Kleinszig, Email: gerhard.kleinszig@siemens-healthineers.com.
Jeffrey H. Siewerdsen, Email: jeff.siewerdsen@jhu.edu.
References
- 1.Fan J., et al. , “Adversarial learning for mono-or multi-modal registration,” Med. Image Anal., 58, 101545 (2019). 10.1016/j.media.2019.101545 [DOI] [PMC free article] [PubMed] [Google Scholar]
- 2.Wang C., et al. , “FIRE: unsupervised bi-directional inter-modality registration using deep networks,” arXiv:1907.05062 (2019).
- 3.Uzunova H., et al. , “Training CNNs for image registration from few samples with model-based data augmentation,” Lect. Notes Comput. Sci. 10433, 223–231 (2017). 10.1007/978-3-319-66182-7_26 [DOI] [Google Scholar]
- 4.Eppenhof K. A. J., Pluim J. P. W., “Pulmonary CT registration through supervised learning with convolutional neural networks,” IEEE Trans. Med. Imaging 38(5) 1097–1105 (2018). 10.1109/TMI.42 [DOI] [PubMed] [Google Scholar]
- 5.Jaderberg M., et al. , “Spatial transformer networks,” in Adv. Neural Inf. Process. Syst., pp. 2017–2025 (2015). [Google Scholar]
- 6.de Vos B. D., et al. , “End-to-end unsupervised deformable image registration with a convolutional neural network,” in Deep Learning in Medical Image Analysis and Multimodal Learning for Clinical Decision Support, pp. 204–212, Springer, Cham, Switzerland: (2017). [Google Scholar]
- 7.Rueckert D., et al. , “Nonrigid registration using free-form deformations: application to breast MR images,” IEEE Trans. Med. Imaging 18(8), 712–721 (1999). 10.1109/42.796284 [DOI] [PubMed] [Google Scholar]
- 8.Vercauteren T., et al. , “Symmetric log-domain diffeomorphic registration: a demons-based approach,” Lect. Notes Comput. Sci. 5241, 754–761 (2008). 10.1007/978-3-540-85988-8_90 [DOI] [PubMed] [Google Scholar]
- 9.Avants B. B., et al. , “Symmetric diffeomorphic image registration with cross-correlation: evaluating automated labeling of elderly and neurodegenerative brain,” Med. Image Anal. 12(1), 26–41 (2008). 10.1016/j.media.2007.06.004 [DOI] [PMC free article] [PubMed] [Google Scholar]
- 10.Cao Y., et al. , “Large deformation diffeomorphic metric mapping of vector fields,” IEEE Trans. Med. Imaging 24(9), 1216–1230 (2005). 10.1109/TMI.2005.853923 [DOI] [PubMed] [Google Scholar]
- 11.Vercauteren T., et al. , “Diffeomorphic demons: efficient non-parametric image registration,” Neuroimage 45(1), S61–S72 (2009). 10.1016/j.neuroimage.2008.10.040 [DOI] [PubMed] [Google Scholar]
- 12.Castillo R., et al. , “A framework for evaluation of deformable image registration spatial accuracy using large landmark point sets,” Phys. Med. Biol. 54(7), 1849–1870 (2009). 10.1088/0031-9155/54/7/001 [DOI] [PubMed] [Google Scholar]
- 13.Castillo E., et al. , “Four-dimensional deformable image registration using trajectory modeling,” Phys. Med. Biol. 55(1), 305–327 (2009). 10.1088/0031-9155/55/1/018 [DOI] [PMC free article] [PubMed] [Google Scholar]
- 14.Vandemeulebroucke J., et al. , “Spatiotemporal motion estimation for respiratory-correlated imaging of the lungs,” Med. Phys. 38(1), 166–178 (2011). 10.1118/1.3523619 [DOI] [PubMed] [Google Scholar]
- 15.Vandemeulebroucke J., et al. , “The POPI-model, a point-validated pixel-based breathing thorax model,” in XVth Int. Conf. Use of Comput. in Radiat. Ther. (ICCR), vol. 2, pp. 195–199 (2007). [Google Scholar]
- 16.Ketcha M. D., et al. , “Effect of statistical mismatch between training and test images for CNN-based deformable registration,” Proc. SPIE 10949, 109490T (2019). 10.1117/12.2512824 [DOI] [Google Scholar]
- 17.Rohé M.-M., et al. , “SVF-Net: learning deformable image registration using shape matching,” Lect. Notes Comput. Sci. 10433, 266–274 (2017). 10.1007/978-3-319-66182-7_31 [DOI] [Google Scholar]
- 18.Sokooti H., et al. , “Nonrigid image registration using multi-scale 3D convolutional neural networks,” Lect. Notes Comput. Sci. 10433, 232–239 (2017). 10.1007/978-3-319-66182-7_27 [DOI] [Google Scholar]
- 19.Hu Y., et al. , “Weakly-supervised convolutional neural networks for multimodal image registration,” Med. Image Anal. 49, 1–13 (2018). 10.1016/j.media.2018.07.002 [DOI] [PMC free article] [PubMed] [Google Scholar]
- 20.Goodfellow I., et al. , “Generative adversarial nets,” in Adv. Neural Inf. Process Syst., pp. 2672–2680 (2014). [Google Scholar]
- 21.Ronneberger O., Fischer P., Brox T., “U-Net: convolutional networks for biomedical image segmentation,” Lect. Notes Comput. Sci. 9351, 234–241 (2015). 10.1007/978-3-319-24574-4_28 [DOI] [Google Scholar]
- 22.Kingma D. P., Ba J., “Adam: a method for stochastic optimization,” in Proc. Int. Conf. Learn. Represent, pp. 1–41 (2015). [Google Scholar]
- 23.Vercauteren T., et al. , “Diffeomorphic demons using ITK’s finite difference solver hierarchy,” in Insight Journal—ISC/NA-MIC Workshop on Open Science at MICCAI, http://hdl.handle.net/1926/510 (2007). [Google Scholar]
- 24.Lowekamp B. C., et al. , “The design of SimpleITK,” Front. Neuroinform. 7(December), 45 (2013). 10.3389/fninf.2013.00045 [DOI] [PMC free article] [PubMed] [Google Scholar]
- 25.Ketcha M. D., et al. , “A statistical model for rigid image registration performance: the influence of soft-tissue deformation as a confounding noise source,” IEEE Trans. Med. Imaging 38, 2016–2027 (2019). 10.1109/TMI.2019.2907868 [DOI] [PMC free article] [PubMed] [Google Scholar]
- 26.Ketcha M. D., et al. , “Effects of image quality on the fundamental limits of image registration accuracy,” IEEE Trans. Med. Imaging 36, 1997–2009 (2017). 10.1109/TMI.2017.2725644 [DOI] [PMC free article] [PubMed] [Google Scholar]
- 27.Burgess A. E., “Statistically defined backgrounds: performance of a modified nonprewhitening observer model,” J. Opt. Soc. Am. A 11(4), 1237–1242 (1994). 10.1364/JOSAA.11.001237 [DOI] [PubMed] [Google Scholar]
- 28.Richard S., et al. , “Generalized DQE analysis of radiographic and dual-energy imaging using flat-panel detectors,” Med. Phys. 32(5), 1397–1413 (2005). 10.1118/1.1901203 [DOI] [PubMed] [Google Scholar]
- 29.Punnoose J., et al. , “Technical note: spektr 3.0—a computational tool for x-ray spectrum modeling and analysis,” Med. Phys. 43(3057), 4711 (2016). 10.1118/1.4955438 [DOI] [PMC free article] [PubMed] [Google Scholar]
- 30.Clark K., et al. , “The Cancer Imaging Archive (TCIA): maintaining and operating a public information repository,” J. Digital Imaging 26(6), 1045–1057 (2013). 10.1007/s10278-013-9622-7 [DOI] [PMC free article] [PubMed] [Google Scholar]
- 31.Roth H., et al. , “A new 2.5 D representation for lymph node detection in CT,” Cancer Imaging Arch. (2015). 10.7937/K9/TCIA.2015.AQIIDCNM [DOI] [Google Scholar]
- 32.Roth H., et al. , “A new 2.5 D representation for lymph node detection using random sets of deep convolutional neural network observations,” in Medical Image Computing and Computer-Assisted Intervention (MICCAI), pp. 520–527 (2014). [DOI] [PMC free article] [PubMed] [Google Scholar]
- 33.Seff A., et al. , “2D view aggregation for lymph node detection using a shallow hierarchy of linear classifiers,” in Medical Image Computing and Computer-Assisted Intervention (MICCAI) 544–552 (2014). [DOI] [PMC free article] [PubMed] [Google Scholar]


