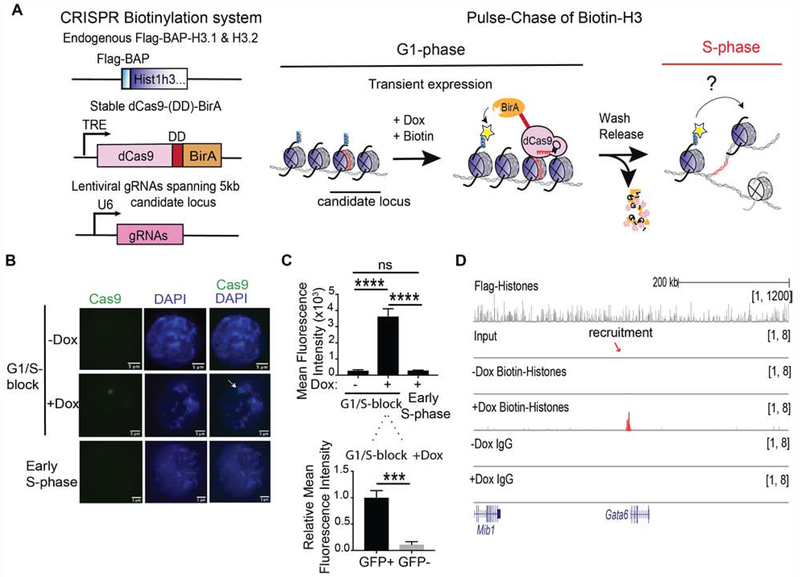
Figure 1. Precise labeling of H3.1 and H3.2 histones in living cells.
(A) Overview of the system to assess in vivo chromatin domain inheritance in mESCs. A master cell line containing endogenous Flag-BAP tagged versions of H3.1 and H3.2, a stably integrated doxycycline (Dox)-inducible dCas9-DD-BirA, and transducible gRNAs spanning 5 kb of a candidate locus is arrested in G1 phase. Following a 6 hr pulse of minimal doxycycline (Dox) and exogenous biotin, nearby tagged parental nucleosomes are biotinylated (blue histones and yellow asterisks). Wash-off of media releases cells into S-phase wherein the re-distribution of biotin-H3 at a mononucleosomal level is assayed in newly synthesized chromatin. (B) Cas9 immunofluorescence and DAPI staining of mESC nuclei with dCas9-DD-BirA targeted to the Gatat6 locus in G1/S-blocked cells ±Dox (top and middle panels), and in early S-phase cells (1 hr release after G1/S-block) following Dox and thymidine wash-off (bottom panel). Data is representative of two sets of biological experiments in which n=3 in each experiment. (C) Quantitation of Cas9 in (B), where the mean fluorescence intensity is compared to G1/S-block - Dox and early S-phase nuclei (top) or within the nucleus of G1/S-block +Dox (bottom). Statistical significance was determined using Student’s t-test (***p<0.001 and **** p<0.0001) and data are represented as mean ±SEM. (D) ChIP-seq analysis of G1/S-blocked cells at the Gata6 locus following dCas9-DD-BirA recruitment. Native Flag (top panel) and biotin and IgG (lower panels). Recruitment significance was determined by a Mann-Whitney test (p<0.0001). For ChIP-seq tracks, the data were normalized using Drosophila chromatin spike-in and the tracks show a scaling factor processed with the bioconductor package ChIPSeqSpike (see STAR Methods).

