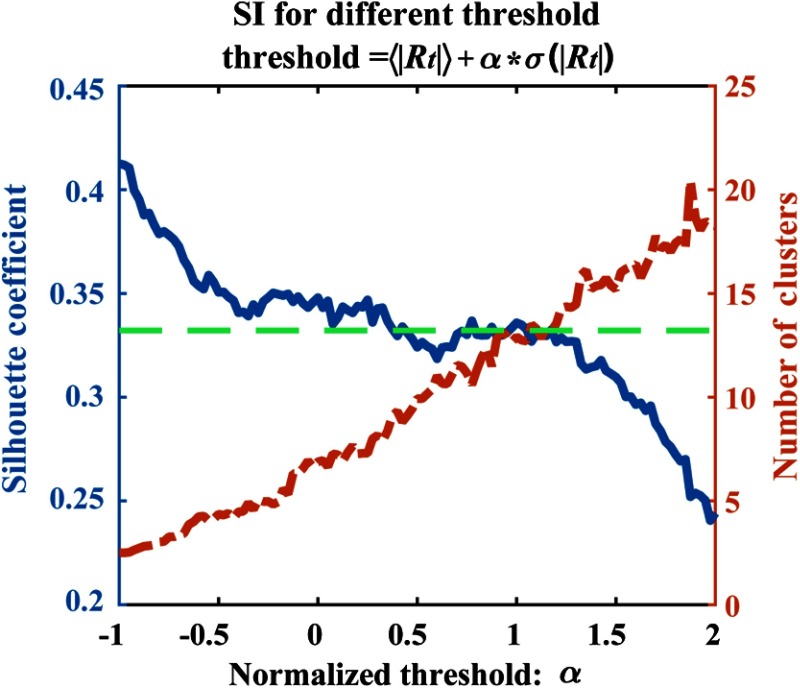
Fig. 2.
Explore the threshold of DCBFC through experimental testing. Blue line and orange-dotted line, respectively, indicate average SI and average cluster number of different thresholds. Green-dotted line indicates the mean of all SI. In this study, the trading-off between SI and number of clusters was concerned. The threshold was set to be .

