

Abstract
Objective
Rheumatoid arthritis (RA) fibroblast‐like synoviocytes (FLS) derived from hip and knee have distinctive DNA methylation and transcriptome patterns in interleukin (IL)‐6 signaling and Janus kinase (JAK)–signal transducers and activators of transcription (STAT) pathways. To determine the functional effects of these joint‐specific signatures, we evaluated how RA hip and knee FLS differ in their response to IL‐6.
Methods
Hip or knee RA FLS were obtained after arthroplasty. Previously published datasets on epigenetic landscape of FLS were mined to identify joint‐specific IL‐6–related epigenomic differences. RNA sequencing was performed on five RA hip and five knee FLS treated with or without IL‐6. Differential gene expression was determined using edgeR software. STAT3 phosphorylation was measured using bead assays. Sensitivity to tofacitinib was evaluated by measuring CCL2 inhibition using quantitative polymerase chain reaction.
Results
Assay for Transposase‐Accessible Chromatin sequencing and histone chromatin immunoprecipitation sequencing datasets from RA FLS were analyzed to identify epigenomic differences between hip and knee. Differential chromatin accessibility was associated with IL‐6,IL‐6R, and JAK1 genes. H3K27ac was also differentially marked at other JAK‐STAT–related genes, including STAT3‐STAT5A region. Principal component analysis of RNA sequencing data confirmed segregation between RA hip and knee FLS under basal conditions, that persisted following IL‐6 treatment. STAT3 phosphorylation after IL‐6 was significantly higher in knee than hip FLS and was highly correlated with JAK1 protein levels. Knee FLS were less sensitive to the JAK inhibitor tofacitinib than hip FLS.
Conclusion
RA hip and knee FLS have distinct transcriptomes, epigenetic marks, and STAT3 activation patterns in the IL‐6 pathway. These joint‐specific differences might contribute to a differential clinical response in individual joints to targeted therapies such as JAK inhibitors.
Introduction
Rheumatoid arthritis (RA) is an aggressive immune‐mediated disease characterized by joint damage mediated through synovial inflammation 1, 2. Despite advances, RA therapy remains an unmet need in a significant percentage of patients. The distribution of RA is generally symmetrical and often involves the small joints of the hands and feet in early disease. As the disease progresses, larger appendicular joints can become involved 3. The reasons for the characteristic joint distribution are not known, nor do we understand why clinical responses to targeted agents vary between patients or why not all joints improve in an individual patient. This study was designed to understand joint location–specific mechanisms in disease pathogenesis by evaluating gene expression and epigenetic marks in RA fibroblast‐like synoviocytes (FLS) derived from the hip and knee.
Overall, RA FLS display a unique aggressive phenotype and exhibit distinctive epigenetic marks compared with non‐RA FLS 4, 5. Differentially imprinted genes and pathways, which include cell recruitment and adhesion, could contribute to their destructive behavior. A detailed evaluation of the epigenetic landscape in RA helped us identify joint‐specific mechanisms, especially differential marks involving interleukin (IL)‐6 signaling and Janus kinase (JAK)–signal transducers and activators of transcription (STAT) pathways in RA hip and knee FLS 6. We hypothesized that hip and knee RA FLS would therefore have differential IL‐6 signaling, which could affect their function and sensitivity to JAK inhibitors. Our data show that IL‐6 signaling differs in FLS based on joint location and correlates with the need for higher concentrations of the JAK inhibitor tofacitinib to block activation. We hypothesize that asynchronous joint responses to targeted therapy are potentially due to these differences and are related to joint‐specific FLS biology.
Methods
FLS and culture conditions
This study was approved by the Institutional Review Board of University of California, San Diego, and informed consent was obtained from all participants. Synovial tissue was obtained from RA patients at the time of total joint replacement or synovectomy. Clinical information was limited because samples were de‐identified. Matched hip and knee samples from individual RA patients could not be obtained because of ethical and technical issues, including difficulty performing minimally invasive hip biopsies. The diagnosis of RA conformed to the American College of Rheumatology 1987 revised criteria 7. The synovium was minced and incubated for 1 hour at 37°C with 0.5 mg/ml of type VIII collagenase (Sigma‐Aldrich) in serum‐free RPMI 1640 (Life Technologies), filtered, extensively washed, and cultured in Dulbecco's modified Eagle's medium (DMEM; Life Technologies) supplemented with 10% heat‐inactivated fetal bovine serum (Gemini Bio‐Products), and supplements (penicillin, streptomycin, gentamicin, and glutamine) in a humidified atmosphere containing 5% CO2. Cells were allowed to adhere overnight, and then nonadherent cells were removed. Adherent FLS were split at 1:3 when they were 70%–80% confluent and used from passages 4 through 7 8.
Real‐time quantitative polymerase chain reaction
RA FLS were serum starved for 24 hours in DMEM containing 0.1% fetal bovine serum and supplements. Cells were treated with various doses of IL‐6 (GenWay Biotech) for various time points. For inhibition assays, the cells were treated for 1 hour with various doses of tofacitinib (Sigma‐Aldrich) prior to IL‐6 (7.5 ng/ml) stimulation. Total RNA was isolated from FLS using RNA STAT‐60 and then reverse transcribed (Applied Biosystems). The complementary DNA served as template for amplification by quantitative polymerase chain reaction using CCL2 TaqMan Gene Expression assays (Hs00234140_m1) using a StepOnePlus Instrument (Applied Biosystems). The Ct values were normalized to glyceraldehyde 3‐phosphate dehydrogenase (GAPDH; Hs02758991_g1) 9.
Protein analyses
Serum‐starved RA FLS cultures were stimulated for 30 minutes with 7.5 ng/ml IL‐6 or 5 ng/ml interferon gamma (IFN‐γ) and Western blot analysis was performed using anti‐phosphorylated STAT1 Tyr701 (P‐STAT1), anti‐phosphorylated STAT3 Tyr703 (P‐STAT3), STAT1, STAT3, JAK1 antibodies (Cell Signaling Technology), or anti‐GAPDH antibody (Santa Cruz Biotechnology), and horseradish peroxidase (HRP)‐conjugated goat anti‐rabbit IgG or anti‐mouse (Cell Signaling Technology) as secondary antibody. Blots were developed using an Immun‐Star WesternC Chemiluminescence kit and analyzed using a VersaDoc imaging system and Quantity One software (Bio‐Rad). IL‐6‐induced P‐STAT3 and total STAT3 levels were also quantified using MSD multi‐spot assay system phospho‐STAT3 (Tyr705, K150SVD) and Total STAT3 (K150SND) kits (Meso Scale Diagnostics).
RNA sequencing processing and analysis
Five RA hip and 5 RA knee FLS were serum starved for 24 hours in DMEM containing 0.1% fetal bovine serum and supplements. Cells were stimulated with IL‐6 (7.5 ng/ml) or serum starvation medium for 2 hours and total RNA was extracted using RNA STAT‐60. The samples had an average RNA Integrity number of 10 (Agilent 2100 Bioanalyzer). After polyA selection and library preparation (Illumina Tru‐Seq3 adapter protocol), the pooled samples were sequenced using Illumina Hi‐Seq (Genewiz). Raw read quality was evaluated using FastQC. Adapter and low‐quality bases below a quality score of 30 were trimmed from raw RNA sequencing (RNA‐seq) reads using Trimmomatic (v0.30) 10. After trimming, reads with less than 36 bp were discarded. The remaining reads were aligned to human reference genome hg19 using HISAT2 (v2.1.0) 11 and assembled and quantified by HTSeq (v0.9) 12. Differentially expressed genes (DEGs) were identified using edgeR software 13 and DESeq2 14 packages. To be considered a DEG, at least twofold change of gene expression levels between hip and knee should be achieved and the Benjamini‐Hochberg–adjusted P value should be less than 0.05. Gene overlaps of DEGs were performed using GSEA MSigDB C2 Canonical pathways with the Kyoto Encyclopedia of Genes and Genomes (KEGG) database (false discovery rate [FDR] < 0.05) 15, 16.
Assay for transposase‐accessible chromatin sequencing and chromatin immunoprecipitation sequencing data analysis
Assay for Transposase‐Accessible Chromatin sequencing (ATAC‐seq) and H3K27ac chromatin immunoprecipitation sequencing (ChIP‐seq) data were processed as previously described 17. From these, three RA hip and five RA knee datasets were used for further analysis. Differentially open regions (ATAC‐seq) and differentially modified epigenomic regions (DMER, ChIP‐seq) between hip and knee samples were determined by DiffBind package in R (FDR < 0.05). Differential regions were annotated using the Genomic Regions Enrichment Annotations Tool (GREAT) 18. Gene overlaps were performed using GSEA MSigDB C2 Canonical pathways with KEGG database 15, 16.
Statistical methods
The two‐sample t test was used to compare each of the outcomes (P‐STAT3/GAPDH and JAK1/GAPDH) between the knee and hip groups. However, given the large differences in scales for each outcome across the three experiments, the two‐sample t test will be biased towards the experiments with larger outcomes. We addressed this issue by creating a t test–like statistic by averaging the three t statistics based on the three experiments and using a permutation distribution based on 1000 permutation runs for inference 19. Spearman's rho was used to indicate strength of association between the two outcomes 20. This rank‐based correlation measure effectively addresses the scale differences in the outcomes across the three experiments within the current setting to provide a meaningful measure of association between the outcomes. To help visualize the rank‐based association, we used the quantiles of the original outcomes to represent the ranked outcomes.
Results
Differential epigenetic profiles in RA hip and knee FLS
We first evaluated differential chromatin accessibility and modified epigenetic regions between RA hip and knee FLS, especially in the JAK‐STAT pathway, using our database of epigenetic marks 17. For chromatin accessibility, DiffBind identified 1806 differential ATAC‐seq regions (FDR < 0.05) comparing the hip and knee FLS with sufficient high‐quality data (n = 3 and 5, respectively). The locations of the differentially accessible regions were then calculated with respect to the nearest transcription start site (TSS). The majority of differentially accessible regions were located between 50 and 500 kb upstream and downstream of the TSS (Figure 1A) and likely represent cis‐enhancers based on their intergenic location. These regions were mapped to the nearest genes using GREAT 18. Pathway analysis of the mapped genes was performed using the KEGG database 15, 16 (Supplementary Data 1). The analysis identified significant differences in the “JAK‐STAT pathway” (FDR = 2.7E‐04) and in related pathways such as “cytokine‐cytokine receptor” (FDR = 3.6E‐08), which includes JAK‐STAT signaling. The differentially accessible individual genes associated with JAK‐STAT between hip and knee included JAK1, IL‐6R, and IL‐6 (Figure 1B). These data suggest that divergent epigenomic landscapes could influence joint‐specific responses to IL‐6 and JAK‐STAT signaling.
Figure 1.
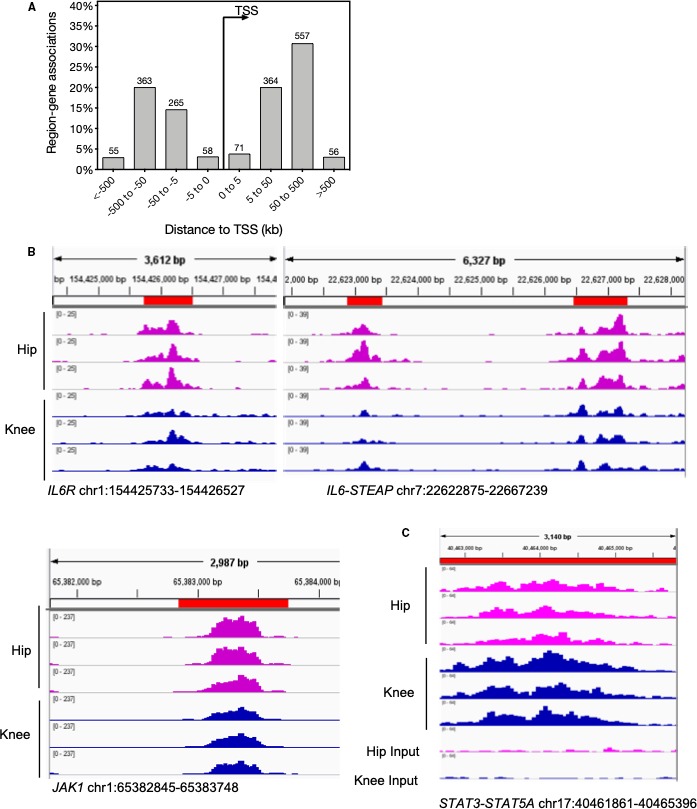
Epigenetic profile differences between rheumatoid arthritis hip and knee fibroblast‐like synoviocytes. A, Differentially accessible regions identified by Assay for Transposase‐Accessible Chromatin sequencing are located primarily between 50 and 500 kb upstream and downstream of the transcription start site (TSS; false discovery rate [FDR] < 0.05). B, Differentially accessible regions in Janus kinase (JAK)–signal transducers and activators of transcription (STAT) pathway–associated genes IL‐6R, IL‐6‐STEAP, and JAK1. C, Differentially modified H3K27ac signal at STAT3‐STAT5A intergenic region (FDR = 0.024).
We then evaluated differentially modified H3K27ac regions between hip and knee FLS and their association with IL‐6 and JAK‐STAT pathways. We identified an intergenic DMER between STAT3 and STAT5A with 1.7‐fold higher H3K27ac levels in the knee than the hip (FDR = 0.024, Figure 1C), suggesting higher enhancer or promoter activity of STAT3 or STAT5A in knee than in hip.
Global gene expression in IL‐6–stimulated RA hip and knee FLS
Under basal conditions, cultured RA hip and knee FLS have different gene expression profiles that involve several pathways, including IL‐6 and JAK‐STAT signaling 6. Based on the above observations, we evaluated whether IL‐6 stimulation alters the pattern of joint‐specific gene expression. An independent set of RA hip and knee FLS were cultured with or without IL‐6 (7.5 ng/ml) for 2 hours and RNA‐seq was performed. Principal component analysis confirmed that hip and knee FLS transcriptomes segregate from each other under basal conditions (Figure 2, red circle). As expected, IL‐6 altered gene expression in hip and knee FLS compared with their respective medium controls (Figure 2). Therefore, the global gene expression differences for hip and knee samples observed under basal conditions were largely maintained after IL‐6 stimulation (orange circle).
Figure 2.
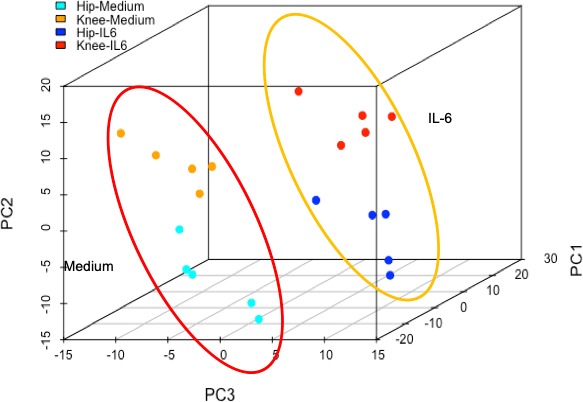
Principal component analysis of differential gene expression using RNA sequencing in rheumatoid arthritis hip and knee fibroblast‐like synoviocytes. Gene expression differences between hip and knee under basal condition are shown in the red circle. Stimulation with interleukin (IL)‐6 induced changes in gene expression shown in the orange circle, but the joint‐specific differences are maintained.
We then determined the DEGs between hip and knee FLS using edgeR and focused on the differences between IL‐6–treated groups. We identified 127 DEGs (with twofold change in expression and adjusted P < 0.05) (see Supplementary Data 2). Some genes were differentially expressed only in the medium or IL‐6–treated hip‐knee pairs. For example, 55 DEGs that were unique to the medium hip versus knee comparison were identified, whereas 34 genes were unique DEGs to the IL‐6–stimulated groups. KEGG analysis of the unique DEGs did not reveal a specific pattern or pathway enrichment. Using the 127 DEGs (IL‐6–treated hip versus knee FLS), we computed the overlap with KEGG pathways. The top KEGG pathway identified was “cell adhesion molecules” with FDR = 3.8E‐03 (Supplementary Data 3). These data demonstrate that differential expression between RA hip and knee under basal conditions are maintained after IL‐6 stimulation and that DEGs are associated with cell adhesion and migration.
Differential response to IL‐6 in RA hip and knee FLS
To explore functional differences between IL‐6–treated hip and knee FLS, we used a candidate gene approach and focused on CCL2 because RNA transcript levels were consistently higher in RA knee FLS compared with RA hip FLS. An IL‐6 dose response using RA hip and knee FLS showed that CCL2 expression is induced in FLS isolated from both locations but with consistently higher expression in the knee than hip (Figure 3). We chose an optimal dose of 7.5 ng/ml for subsequent mechanism experiments.
Figure 3.
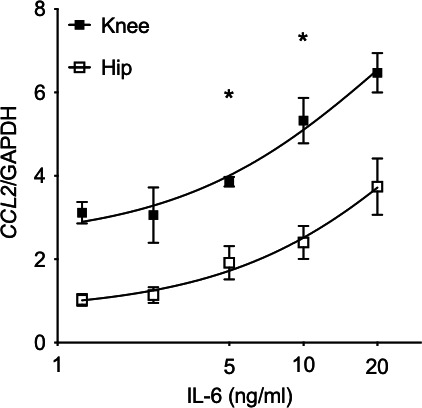
Functional response to interleukin (IL)‐6 in rheumatoid arthritis hip and knee fibroblast‐like synoviocytes (FLS). CCL2 gene expression was evaluated in IL‐6–treated hip and knee FLS by quantitative polymerase chain reaction (n = 6/group). CCL2 expression was significantly higher in knee than hip FLS at 5 to 10 ng/ml dose range (P < 0.001, 2‐way ANOVA, Sidak multiple comparison test). We chose 7.5 ng/ml of IL‐6 for the subsequent experiments.
Differential IL‐6 signaling in RA hip and knee FLS
Because IL‐6 signals through STAT3, we performed a time course experiment after IL‐6 stimulation and measured P‐STAT3 levels using multiplex bead assay (Figure 4A). P‐STAT3 levels peaked after 30 minutes of IL‐6 stimulation and returned to baseline levels by 60 minutes in hip and knee FLS. At peak expression, P‐STAT3 levels were significantly higher in knee than hip FLS. Interestingly, SOCS3 gene expression after IL‐6 stimulation was similar in RA hip and knee FLS (data not shown). Next, we determine whether higher STAT3 phosphorylation in the knee is associated with higher JAK1 protein levels. The GAPDH normalized data from three separate experiments were combined and ranked for calculating Spearman's correlation (see Figure 4B for the combined plot (n = 10/group). P‐STAT3 was highly correlated with JAK1 (Spearman r = 0.75) and the correlation was statistically significant (P < 0.0005). Furthermore, JAK1 expression was statistically significantly higher in knee than hip (P = 0.04).
Figure 4.
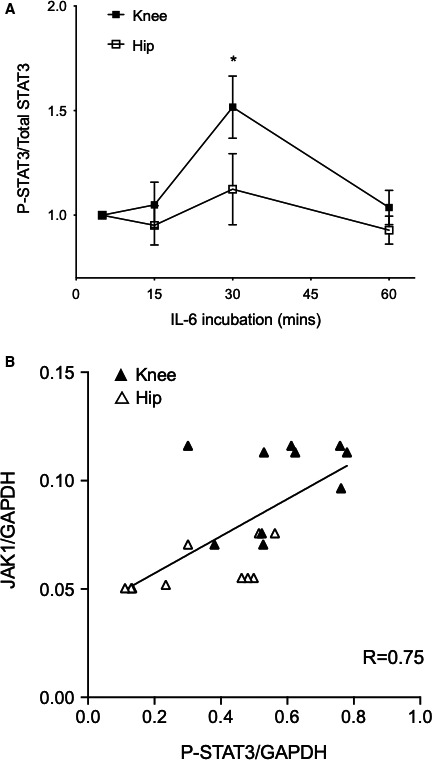
P‐STAT3 activation in rheumatoid arthritis hip and knee fibroblast‐like synoviocytes (FLS). A, P‐STAT3 and total STAT3 levels were measured at various times after interleukin (IL)‐6 treatment (7.5 ng/ml) using bead assays. After 30 minutes, P‐STAT3/STAT3 was significantly higher in knee than hip FLS (n = 6/group, P < 0.05, 2‐way ANOVA, Sidak multiple comparison test). B, P‐STAT3 and JAK1 levels were quantified by Western blot analysis, normalized to glyceraldehyde 3‐phosphate dehydrogenase (GAPDH). Combined data from three different experiments (n = 10/group) were ranked as described in the Statistical Methods section. P‐STAT3 and JAK1 protein levels were highly correlated (Spearman R = 0.75) and statistically significant (P < 0.0005). Correlation also shows that knee FLS expressed more JAK1 than hip FLS (P = 0.04).
Specificity of JAK‐STAT differential responses
Although P‐STAT‐3 was differentially regulated by IL‐6 based on joint location, induction of P‐STAT1 was similar in IL‐6–stimulated hip and knee FLS (Figure 5A). We also evaluated the effect of another JAK activator, namely interferon (IFN)‐γ. Phosphorylation of P‐STAT1 and P‐STAT3 were similar in RA hip and knee FLS. Therefore, the signaling patterns that distinguish hip and knee are likely specific for IL‐6 and for P‐STAT3.
Figure 5.
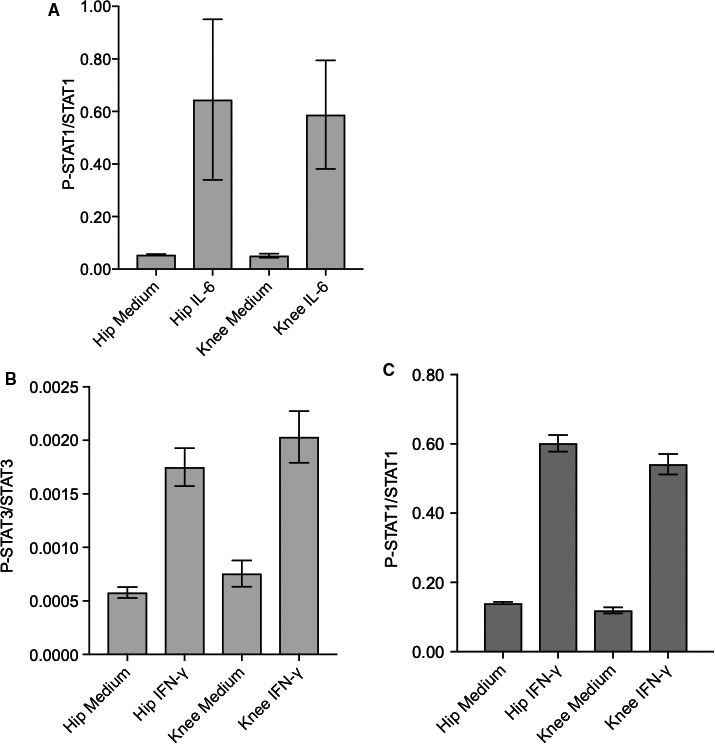
Specificity of Janus kinase (JAK)–signal transducers and activators of transcription (STAT) activation by interleukin (IL)‐6 and interferon (IFN)‐γ in rheumatoid arthritis hip and knee fibroblast‐like synoviocytes (FLS). A, P‐STAT1 and total STAT1 levels were measured after 30 minutes of IL‐6 (7.5 ng/ml) by Western blot analysis. P‐STAT1/STAT1 levels increased after IL‐6 stimulation but were not statistically different in hip and knee FLS. B and C, P‐STAT3/STAT3 and P‐STAT1/STAT1 levels increased after 30 minutes of IFN‐γ (5 ng/ml) but were not statistically different between the joints.
Differential sensitivity of RA hip and knee FLS to JAK inhibition
The clinical relevance of our findings was evaluated by determining the relative sensitivity of IL‐6–stimulated RA hip and knee FLS to the JAK inhibitor tofacitinib. CCL2 gene expression was measured in FLS treated with a fixed concentration of IL‐6 in combination with increasing doses of tofacitinib. As expected, CCL2 expression decreased with 100 to 1000 nM of tofacitinib. However, hip FLS were significantly more sensitive to tofacitinib than knee (EC50 of 156 nM and 251 nM for hip and knee, respectively; n = 9/group, P = 0.04) (Figure 6).
Figure 6.
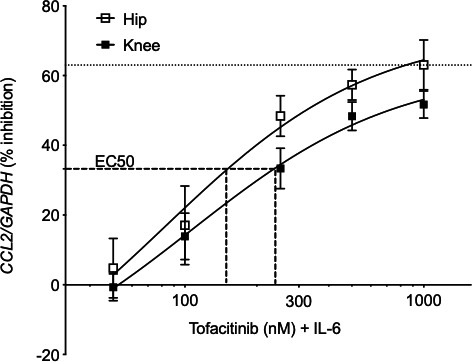
Sensitivity to tofacitinib in rheumatoid arthritis hip and knee fibroblast‐like synoviocytes (FLS). Cells pretreated with various doses of tofacitinib (50 to 1000 ng/ml) were treated with 7.5 ng/ml interleukin (IL)‐6 for 30 minutes, and CCL2 expression was measured by quantitative polymerase chain reaction. Data from three separate experiments were combined (n = 9/joint). EC50 represents 50% of the maximal CCL2 inhibition by tofacitinib (63%). Hip and knee FLS achieve EC50 at 156 and 251 nM tofacitinib, respectively, indicating hip FLS are more sensitive to inhibition by tofacitinib than knee FLS (P = 0.04).
Discussion
RA FLS exhibit a transformed aggressive phenotype and produce high levels of proinflammatory cytokines such as IL‐6 and matrix metalloproteinases, contributing to bone loss and cartilage destruction 3. The cells maintain their invasive and destructive behavior over many passages in culture, with abnormalities in apoptosis, anchorage‐dependent growth and invasion 2, 21. RA FLS can migrate from joint to joint when injected into severe combined immunodeficient mice and invade into cartilage explants 22. These data suggest that RA FLS are abnormally imprinted and display a pathogenic phenotype that persists despite removal from the inflammatory milieu.
Recent epigenetic studies suggest that changes in DNA methylation might contribute to the aggressive phenotype of RA FLS 23. RA FLS have a distinct DNA methylome profile compared with non‐RA FLS, and the differentially methylated genes regulate key pathways such as cell adhesion and migration relevant to RA pathogenesis 4, 5. Some of these epigenetic marks demonstrate DNA methylation patterns that distinguish RA FLS isolated from different joint locations 6. For example, FLS isolated from RA hips and knees have differential methylation in important immunological pathways, most notably the IL‐6 and JAK‐STAT signaling pathways. These pathways were identified in RA using computational methods that subtracted the potential influence of concomitant osteoarthritis (OA) 6. Thus, it is unlikely that secondary OA is the cause of the hip‐knee differences studied in the present manuscript.
The biologic processes that lead to joint‐specific differential marks such as DNA methylation are not known. The cells could be imprinted centrally and then migrate to a preprogrammed location. On the other hand, undifferentiated cells in the joint could be affected by their local disease environment and subsequently develop joint‐specific marks. The latter seems more likely given observations that FLS can migrate from joint to joint 22. Despite this plasticity, the cells do not return to a less differentiated state after they are removed from the joint and thus retain their joint‐specific characteristics 24.
The causes of joint‐specific epigenomic changes are not known. Stress from high‐intensity muscle contractions, for instance, can induce changes in DNA methylation and histone modifications 25, 26. The loads and biomechanical requirements vary from joint to joint and could lead to microdifferentiation among stromal cells that support regionally important functions. Fibroblast subsets are increasingly recognized and are even observed within synovial tissue 27. The epigenomic landscape represents another way to characterize the remarkable heterogeneity of the stromal compartment.
The epigenetic and transcriptional differences between FLS in hips and knees could contribute to functions relevant to RA. One of the most prominent changes relates to regulation of IL‐6 signaling through the JAK‐STAT pathway and was originally discovered using our unbiased transcriptome and DNA methylation databases 6. In the current studies, we initially mined our recently published epigenetic datasets to identify other marks that distinguish RA FLS based on their joint of origin 17. The majority of open chromatin regions were located in intergenic regions within 5 to 500 kb of the TSS. Open chromatin regions can modulate gene expression as we previously showed with an upstream LBH enhancer 28. JAK1 protein was higher in knee FLS and was associated with increased STAT3 phosphorylation. Unexpectedly, chromatin was more accessible near JAK1 in hip RA FLS, suggesting that the mechanism of differential expression is more complex. We also identified differential H3K27ac enhancer/promoter marks between two JAK‐regulated genes, STAT3‐STAT5, and differential open chromatin regions associated with IL‐6R, IL‐6, and JAK1. The observations are consistent with recent studies of histone H3 acetylation of the IL‐6 promoter, which leads to higher IL‐6 expression in RA FLS 29.
We then evaluated gene expression in a confirmatory set of RA hip and knee FLS in the presence or absence of IL‐6 by RNA‐seq. The transcription profiles of RA hip and knee FLS could be distinguished from each other under basal conditions, similar to our previous results 6. The separation was maintained in cells activated with low doses of IL‐6, suggesting that the joint‐specific differences are stable and that IL‐6 activation does not lead to general convergence of the hip and knee transcriptional profiles.
We then focused on CCL2 expression for mechanism studies because it was consistently higher in knee‐derived cells. CCL2 is also an important biomarker in patients with RA and decreases within hours in patients treated with the JAK inhibitor tofacitinib 30. Using the optimal concentration of IL‐6 to maximize hip and knee differences, we found that STAT3 phosphorylation and CCL2 expression are both significantly increased in RA knee FLS compared with hip FLS. The biologic relevance of P‐STAT is also reflected in our synovial biopsy study in RA where changes in P‐STAT3 and P‐STAT1 correlated with clinical response to tofacitinib therapy 30. Therefore, joint‐specific differences in STAT phosphorylation could have an impact on therapeutic responses in individual joints.
To understand why P‐STAT3 is higher in RA knee FLS, we looked at the relationship between JAK1 protein and cell activation in FLS from different locations. The data showed a close relationship between P‐STAT3 induction and JAK1 expression, and both were significantly higher in knees FLS. We also evaluated the specificity for IL‐6 signaling by studying JAK‐STAT activation by IFN‐γ. Surprisingly, P‐STAT3 or P‐STAT1 in knee and hip FLS were similar after IFN‐γ stimulation. One explanation might be that, in contrast to the IFN‐γ receptor, IL‐6R forms complexes with several JAK family members including TYK2 31, 32. Unlike IFN‐γ, IL‐6 can also induce JAK‐STAT activation through canonical and noncanonical signaling, which might contribute to the differences 33. Further studies defining how joint‐specific imprinting occurs and how the selectivity for individual pathways occurs are in progress.
Joint‐specific differences in cytokine signaling could have clinical implications. For example, the differences in sensitivity to tofacitinib, although relatively small, occur in the range of therapeutic concentrations achieved in patients 34. Subtle shifts in the dose response curve could contribute to differential improvement in various joint groups. It is also possible that FLS heterogeneity or subsets could contribute to the distinctive distribution of arthritis observed in RA and other forms of polyarthritis or oligoarthritis 35. Future studies are needed to determine whether the overall differences related to JAK‐STAT signaling are due to different populations of mesenchymal cell subsets. However, recent work by Ciurea and colleagues supports our hypothesis on joint‐specific differences related to JAK inhibitors (Ciurea et al; EULAR abstract FRI01442019, 2019). They observed that wrist, knee, and ankle respond less well to tofacitinib than other joints as predicted by the data in our study (Ciurea et al; EULAR abstract FRI01442019, 2019). Together, our results suggest that we should consider including joint‐specific response measures in clinical trials to help us stratify patients for targeted agents based on the joints that are most severely affected.
Author Contributions
All authors were involved in drafting the article or revising it critically for important intellectual contact, and all authors approved the final version to be published. Dr. Hammaker had full access to all of the data in the study and takes responsibility for the integrity of the data and the accuracy of the data analysis.
Study conception and design. Hammaker, Ai, Boyle, Wang, Firestein.
Acquisition of data. Hammaker, Nygaard, Kuhs.
Analysis and interpretation of data. Hammaker, Nygaard, Kuhs, Ai, Boyle, Wang, Firestein.
Supporting information
Supplementary Data 1. Pathway analysis of differentially accessible chromatin regions identified by DiffBind (FDR<0.05) between RA hip (n=3) and knee (n=5) FLS.
Supplementary Data 2. Differentially expressed genes between hip and knee FLS after medium or IL‐6 stimulation. 148 DEGs (with at least 2‐fold change and adjusted p‐value <0.05) were identified in untreated FLS (column A) and 127 DEGs were identified after IL‐6 stimulation (column C). The Venn diagram shows 93 DEGs were common between basal and IL‐6 groups (column E), 55 DEGs were unique to unstimulated hip vs. knee (column G) and 34 DEGs were unique to IL‐6‐stimulated hip vs. knee group (column I).
Supplementary Data 3. Pathway analysis of differentially expressed genes comparing IL‐6‐stimulated hip and knee FLS.
Acknowledgment
We thank the Center for Computational Biology and Bioinformatics at University of California San Diego School of Medicine for their assistance with the bioinformatic analysis (Altman Clinical and Translational Research Institute [ACTRI] grant UL1TR001442). We thank Dr. Matthew Meunier, Dr. Francis Gonzales, and Dr. Reid Abrams from the Department of Orthopaedic Surgery at the University of California San Diego School of Medicine for helping us procure patient tissue.
Dr. Firestein's work was supported by RO1 NIH National Institute of Arthritis and Musculoskeletal and Skin Diseases grants AR‐071321 and AR‐065466.
No potential conflicts of interest relevant to this article were reported.
References
- 1. Smolen JS, Aletaha D, Barton A, Burmester GR, Emery P, Firestein GS, et al. Rheumatoid arthritis. Nat Rev Dis Primers 2018;4:18001. [DOI] [PubMed] [Google Scholar]
- 2. Bartok B, Firestein GS. Fibroblast‐like synoviocytes: key effector cells in rheumatoid arthritis. Immunol Rev 2010;233:233–55. [DOI] [PMC free article] [PubMed] [Google Scholar]
- 3. Firestein GS, McInnes IB. Immunopathogenesis of rheumatoid arthritis. Immunity 2017;46:183–96. [DOI] [PMC free article] [PubMed] [Google Scholar]
- 4. Whitaker JW, Shoemaker R, Boyle DL, Hillman J, Anderson D, Wang W, et al. An imprinted rheumatoid arthritis methylome signature reflects pathogenic phenotype. Genome Med 2013;5:40. [DOI] [PMC free article] [PubMed] [Google Scholar]
- 5. Nakano K, Whitaker JW, Boyle DL, Wang W, Firestein GS. DNA methylome signature in rheumatoid arthritis. Ann Rheum Dis 2013;72:110–7. [DOI] [PMC free article] [PubMed] [Google Scholar]
- 6. Ai R, Hammaker D, Boyle DL, Morgan R, Walsh AM, Fan S, et al. Joint‐specific DNA methylation and transcriptome signatures in rheumatoid arthritis identify distinct pathogenic processes. Nat Commun 2016;7:11849. [DOI] [PMC free article] [PubMed] [Google Scholar]
- 7. Arnett FC, Edworthy SM, Bloch DA, McShane DJ, Fries JF, Cooper NS, et al. The American Rheumatism Association 1987 revised criteria for the classification of rheumatoid arthritis. Arthritis Rheum 1988;31:315–24. [DOI] [PubMed] [Google Scholar]
- 8. Rosengren S, Boyle DL, Firestein GS. Acquisition, culture, and phenotyping of synovial fibroblasts. Methods Mol Med 2007;135:365–75. [DOI] [PubMed] [Google Scholar]
- 9. Boyle DL, Rosengren S, Bugbee W, Kavanaugh A, Firestein GS. Quantitative biomarker analysis of synovial gene expression by real‐time PCR. Arthritis Res Ther 2003;5:R352–60. [DOI] [PMC free article] [PubMed] [Google Scholar]
- 10. Bolger AM, Lohse M, Usadel B. Trimmomatic: a flexible trimmer for Illumina sequence data. Bioinformatics 2014;30:2114–20. [DOI] [PMC free article] [PubMed] [Google Scholar]
- 11. Kim D, Langmead B, Salzberg SL. HISAT: a fast spliced aligner with low memory requirements. Nat Methods 2015;12:357–60. [DOI] [PMC free article] [PubMed] [Google Scholar]
- 12. Anders S, Pyl PT, Huber W. HTSeq–a Python framework to work with high‐throughput sequencing data. Bioinformatics 2015;31:166–9. [DOI] [PMC free article] [PubMed] [Google Scholar]
- 13. Robinson MD, McCarthy DJ, Smyth GK. edgeR: a Bioconductor package for differential expression analysis of digital gene expression data. Bioinformatics 2010;26:139–40. [DOI] [PMC free article] [PubMed] [Google Scholar]
- 14. Love MI, Huber W, Anders S. Moderated estimation of fold change and dispersion for RNA‐seq data with DESeq2. Genome Biol 2014;15:550. [DOI] [PMC free article] [PubMed] [Google Scholar]
- 15. Subramanian A, Tamayo P, Mootha VK, Mukherjee S, Ebert BL, Gillette MA, et al. Gene set enrichment analysis: a knowledge‐based approach for interpreting genome‐wide expression profiles. Proc Natl Acad Sci U S A 2005;102:15545–50. [DOI] [PMC free article] [PubMed] [Google Scholar]
- 16. Mootha VK, Lindgren CM, Eriksson KF, Subramanian A, Sihag S, Lehar J, et al. PGC‐1α‐responsive genes involved in oxidative phosphorylation are coordinately downregulated in human diabetes. Nat Genet 2003;34:267–73. [DOI] [PubMed] [Google Scholar]
- 17. Ai R, Laragione T, Hammaker D, Boyle DL, Wildberg A, Maeshima K, et al. Comprehensive epigenetic landscape of rheumatoid arthritis fibroblast‐like synoviocytes. Nat Commun 2018;9:1921. [DOI] [PMC free article] [PubMed] [Google Scholar]
- 18. McLean CY, Bristor D, Hiller M, Clarke SL, Schaar BT, Lowe CB, et al. GREAT improves functional interpretation of cis‐regulatory regions. Nat Biotechnol 2010;28:495–501. [DOI] [PMC free article] [PubMed] [Google Scholar]
- 19. Efron B,Tibshirani RJ. An Introduction to the Bootstrap. New York, NY: Springer; 1993. [Google Scholar]
- 20. Tang W, He H, Tu XM. Applied categorical and count data analysis. 1st ed Boca Raton (FL): Chapman & Hall/CRC; 2012. [Google Scholar]
- 21. Müller‐Ladner U, Ospelt C, Gay S, Distler O, Pap T. Cells of the synovium in rheumatoid arthritis. Synovial fibroblasts. Arthritis Res Ther 2007;9:223. [DOI] [PMC free article] [PubMed] [Google Scholar]
- 22. Lefèvre S, Knedla A, Tennie C, Kampmann A, Wunrau C, Dinser R, et al. Synovial fibroblasts spread rheumatoid arthritis to unaffected joints. Nat Med 2009;15:1414–20. [DOI] [PMC free article] [PubMed] [Google Scholar]
- 23. Bottini N, Firestein GS. Duality of fibroblast‐like synoviocytes in RA: passive responders and imprinted aggressors. Nat Rev Rheumatol 2013;9:24–33. [DOI] [PMC free article] [PubMed] [Google Scholar]
- 24. Müller‐Ladner U, Kriegsmann J, Franklin BN, Matsumoto S, Geiler T, Gay RE, et al. Synovial fibroblasts of patients with rheumatoid arthritis attach to and invade normal human cartilage when engrafted into SCID mice. Am J Pathol 1996;149:1607–15. [PMC free article] [PubMed] [Google Scholar]
- 25. Barrès R, Yan J, Egan B, Treebak JT, Rasmussen M, Fritz T, et al. Acute exercise remodels promoter methylation in human skeletal muscle. Cell Metab 2012;15:405–11. [DOI] [PubMed] [Google Scholar]
- 26. McGee SL, Fairlie E, Garnham AP, Hargreaves M. Exercise‐induced histone modifications in human skeletal muscle. J Physiol 2009;587(Pt 24):5951–8. [DOI] [PMC free article] [PubMed] [Google Scholar]
- 27. Mizoguchi F, Slowikowski K, Wei K, Marshall JL, Rao DA, Chang SK, et al. Functionally distinct disease‐associated fibroblast subsets in rheumatoid arthritis. Nat Commun 2018;9:789. [DOI] [PMC free article] [PubMed] [Google Scholar]
- 28. Hammaker D, Whitaker JW, Maeshima K, Boyle DL, Ekwall AH, Wang W, et al. LBH gene transcription regulation by the interplay of an enhancer risk allele and DNA methylation in rheumatoid arthritis. Arthritis Rheumatol 2016;68:2637–45. [DOI] [PMC free article] [PubMed] [Google Scholar]
- 29. Wada TT, Araki Y, Sato K, Aizaki Y, Yokota K, Kim YT, et al. Aberrant histone acetylation contributes to elevated interleukin‐6 production in rheumatoid arthritis synovial fibroblasts. Biochem Biophys Res Commun 2014;444:682–6. [DOI] [PubMed] [Google Scholar]
- 30. Boyle DL, Soma K, Hodge J, Kavanaugh A, Mandel D, Mease P, et al. The JAK inhibitor tofacitinib suppresses synovial JAK1‐STAT signalling in rheumatoid arthritis. Ann Rheum Dis 2015;74:1311–6. [DOI] [PMC free article] [PubMed] [Google Scholar]
- 31. Stahl N, Boulton TG, Farruggella T, Ip NY, Davis S, Witthuhn BA, et al. Association and activation of Jak‐Tyk kinases by CNTF‐LIF‐OSM‐IL‐6β receptor components. Science 1994;263:92–5. [DOI] [PubMed] [Google Scholar]
- 32. Heinrich PC, Behrmann I, Müller‐Newen G, Schaper F, Graeve L. Interleukin‐6‐type cytokine signalling through the gp130/Jak/STAT pathway. Biochem J 1998;334:297–314. [DOI] [PMC free article] [PubMed] [Google Scholar]
- 33. Rose‐John S, Scheller J, Elson G, Jones SA. Interleukin‐6 biology is coordinated by membrane‐bound and soluble receptors: role in inflammation and cancer. J Leukoc Biol 2006;80:227–36. [DOI] [PubMed] [Google Scholar]
- 34. Hodge JA, Kawabata TT, Krishnaswami S, Clark JD, Telliez JB, Dowty ME, et al. The mechanism of action of tofacitinib ‐ an oral Janus kinase inhibitor for the treatment of rheumatoid arthritis. Clin Exp Rheumatol 2016;34:318–28. [PubMed] [Google Scholar]
- 35. Zhang F, Wei K, Slowikowski K, Fonseka CY, Rao DA, Kelly S, et al. Defining inflammatory cell states in rheumatoid arthritis joint synovial tissues by integrating single‐cell transcriptomics and mass cytometry. Nat Immunol 2019;20:928–42. [DOI] [PMC free article] [PubMed] [Google Scholar]
Associated Data
This section collects any data citations, data availability statements, or supplementary materials included in this article.
Supplementary Materials
Supplementary Data 1. Pathway analysis of differentially accessible chromatin regions identified by DiffBind (FDR<0.05) between RA hip (n=3) and knee (n=5) FLS.
Supplementary Data 2. Differentially expressed genes between hip and knee FLS after medium or IL‐6 stimulation. 148 DEGs (with at least 2‐fold change and adjusted p‐value <0.05) were identified in untreated FLS (column A) and 127 DEGs were identified after IL‐6 stimulation (column C). The Venn diagram shows 93 DEGs were common between basal and IL‐6 groups (column E), 55 DEGs were unique to unstimulated hip vs. knee (column G) and 34 DEGs were unique to IL‐6‐stimulated hip vs. knee group (column I).
Supplementary Data 3. Pathway analysis of differentially expressed genes comparing IL‐6‐stimulated hip and knee FLS.