Abstract
Objective
Patients with Early Infantile Epileptic Encephalopathy (EIEE) 52 have inherited, homozygous variants in the gene SCN1B, encoding the voltage‐gated sodium channel (VGSC) β1 and β1B non‐pore‐forming subunits.
Methods
Here, we describe the detailed electroclinical features of a biallelic SCN1B patient with a previously unreported variant, p.Arg85Cys.
Results
The female proband showed hypotonia from birth, multifocal myoclonus at 2.5 months, then focal seizures and myoclonic status epilepticus (SE) at 3 months, triggered by fever. Auditory brainstem response (ABR) showed bilateral hearing loss. Epilepsy was refractory and the patient had virtually no development. Administration of fenfluramine resulted in a significant reduction in seizure frequency and resolution of SE episodes that persisted after a 2‐year follow‐up. The patient phenotype is more compatible with early infantile developmental and epileptic encephalopathy (DEE) than with typical Dravet syndrome (DS), as previously diagnosed for other patients with homozygous SCN1B variants. Biochemical and electrophysiological analyses of the SCN1B variant expressed in heterologous cells showed cell surface expression of the mutant β1 subunit, similar to wild‐type (WT), but with loss of normal β1‐mediated modification of human Nav1.1‐generated sodium current, suggesting that SCN1B‐p.Arg85Cys is a loss‐of‐function (LOF) variant.
Interpretation
Importantly, a review of the literature in light of our results suggests that the term, early infantile developmental and epileptic encephalopathy, is more appropriate than either EIEE or DS to describe biallelic SCN1B patients.
Introduction
Voltage‐gated sodium channels (VGSCs) are responsible for the rising phase and propagation of action potentials in excitable cells.1 VGSCs were purified as heterotrimeric complexes of α and β subunits from mammalian brain.2 This work showed that a central α subunit forms the ion‐conducting pore and is associated with two different β subunits.3 Originally characterized as “auxiliary,” β subunits are now known to be dynamic, multifunctional molecules that engage in diverse and essential roles in multiple tissues.4, 5 Their ability to participate in both conducting and nonconducting roles makes VGSC β subunits unique among voltage‐gated ion channel subunits. The breadth of β subunit function hinges on the key structural motif common to all members of this family of proteins: an immunoglobulin (Ig) loop enabling them to function as cell adhesion molecules (CAMs).4, 5, 6 CAM‐mediated adhesive functions are critical to brain development, including the processes of neurite outgrowth, axon pathfinding, fasciculation, and cell migration.4, 5 Integrity of the Ig loop is also critical for β1‐mediated VGSC modulation in vivo,7 making this domain multi‐functional. In their roles as ion channel modulators, not only of VGSCs but also of voltage‐gated K+ channels,8, 9, 10, 11 β subunits make important contributions to the regulation of neuronal firing. As substrates for sequential cleavage by β‐ (BACE) and γ‐secretases, β subunits contribute to the regulation of VGSC α subunit gene expression.12, 13 Taking all of these roles into consideration, it is not surprising that variants in the genes encoding VGSC β subunits are linked to pathophysiology.
Patients with Early Infantile Epileptic Encephalopathy (EIEE) 52 (OMIM 617350) have inherited, homozygous variants in the gene SCN1B, encoding the VGSC β1 and β1B non‐pore‐forming subunits.5 Inherited, heterozygous SCN1B variants have been linked to generalized epilepsy with febrile seizures (FS) plus, temporal lobe epilepsy (TLE), and cardiac arrhythmias, including Brugada syndrome and atrial fibrillation.5, 14 Homozygous SCN1B variants have been reported in seven epilepsy patients to date, with clinical descriptions suggestive of Dravet syndrome (DS).15, 16, 17 Scn1b null mice have a phenotype that is similar to DS.18, 19 Thus, this small patient cohort was presumed to represent a subset of DS. Here, we describe a 4‐year electroclinical follow‐up of an eighth reported SCN1B patient with a previously unreported variant, c.253C > T (p.Arg85Cys), located in the extracellular Ig loop domain. The electroclinical profile suggests a diagnosis of early infantile developmental and epileptic encephalopathy (DEE), a severe neurodevelopmental disorder often beginning in infancy that is characterized by intractable seizures and pronounced developmental impairment, a more severe form of epilepsy and developmental delay than DS. Electrophysiological analysis of the variant shows β1 subunit loss‐of‐function (LOF) in spite of normal cell surface expression of the protein. These data are similar to previous work with the SCN1B‐p.Cys121Trp variant, also located in the Ig loop domain, showing normal cell surface expression, but LOF in terms of sodium current (INa) modulation7, 20 and for which a homozygous mouse model shows a phenotype that is similar to Scn1b null mice.21 Importantly, our results provide new information about autosomal recessive inheritance in epilepsy (reviewed in 22) and suggest reconsideration of the linkage of SCN1B variants to early infantile DEE rather than to EIEE or DS.
Results
Case study
The female proband was born from consanguineous parents, first cousins of Belgian origin. The familial pedigree was highly suggestive of GEFS+ (Fig. 1). The father and his sister presented with febrile seizures (FS) in childhood. Three cousins of the parents had a non‐detailed history of FS or epilepsy.
Figure 1.

Pedigree of the family.
After an uncomplicated pregnancy, a global hypotonia was noted from birth. At 2 months of age, the proband was unable to hold her head, had no visual interactions, and began to present frequent erratic myoclonus triggered by transition phases of sleep, fever, and hot bath. Long‐term (24 h) video electroencephalogram (EEG) monitoring at that time revealed frequent bilateral central spikes (Fig. 2). Spikes were isolated or occurred in bursts lasting a few seconds followed by high‐voltage slow waves followed sometimes by unilateral or bilateral myoclonus (Fig. 3). Myoclonus was also observed without simultaneous spikes. Less frequently, there were bilateral temporal spikes. One cluster of myoclonus was followed by a focal to bilateral clonic seizure (Fig. 4), and thousands of epileptic and non‐epileptic myoclonus (Fig. 3) were captured during this first long‐term video EEG. Despite the frequent central and temporal spikes, structure of sleep stages was overall preserved with the presence of sleep spindles.
Figure 2.
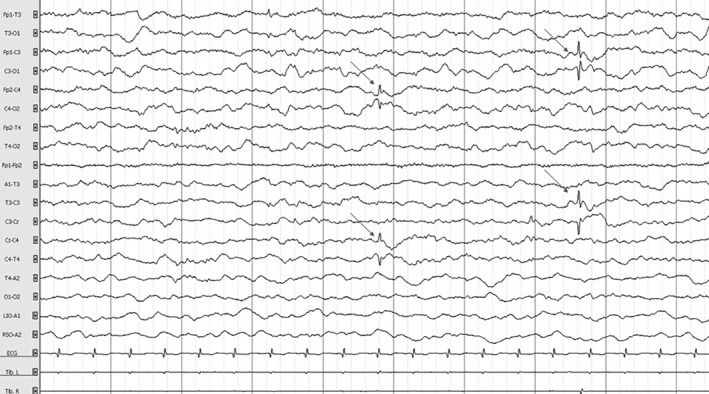
Electroencephalogram of the patient at 2.5 months in awake state showing a normal background with isolated, bilateral slow amplitude central spikes without clinical manifestations (arrows). Time constant: 10 sec. Amplitude: 100 µV/cm. High band filter: 0.3 Hz. Low band filter: 70 Hz.
Figure 3.
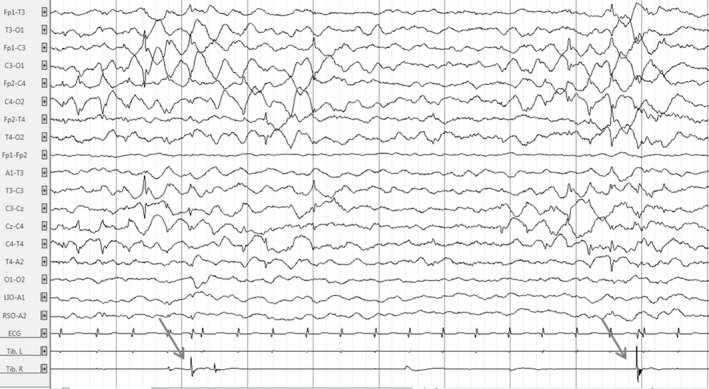
Electroencephalogram of the patient at 2.5 months in awake state showing clusters of bilateral high‐amplitude central spikes followed by high‐amplitude slow waves and erratic focal right myoclonus (arrows). Time constant: 10 sec. Amplitude: 100 µV/cm. High band filter: 0.3 Hz. Low band filter: 70 Hz.
Figure 4.
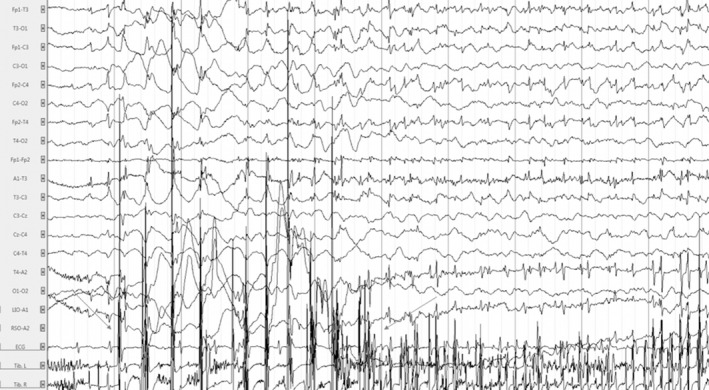
Electroencephalogram of the patient at 2.5 months in awake state showing rhythmic bilateral central high‐voltage spikes accompanied by a cluster of high‐voltage myoclonus (n = 10, arrow to arrow) followed by a focal to bilateral clonic seizure with alteration of consciousness lasting 80 sec. Time constant: 10 sec. Amplitude: 300 µV/cm. High band filter: 0.3 Hz. Low band filter: 70 Hz.
Despite the levetiracetam (50 mg/kg/d) treatment, erratic bursts of myoclonus persisted. The proband experienced a first fever‐induced myoclonic status epilepticus (SE) at 3 months, which lasted for 30 min. Several episodes of focal to bilateral tonic‐clonic seizures followed. Central spikes and waves with some generalized spikes were still observed on EEG. Addition of valproate (30 mg/kg/d) with clobazam (0.5 mg/kg/d) resulted in a slight decrease in both spikes and seizures. At 7 months, introduction of the ketogenic diet and topiramate (5 mg/kg/d) decreased myoclonus frequency and intensity. The proband became slightly more interactive with social smiling but with persistent, severe global hypotonia.
Eight myoclonic or hemiclonic febrile SE occurred within the first 2 years of life. At 24 months, EEG was unchanged, with thousands of myoclonus isolated or in bursts during the awake state or during sleep that often led to arousal. The epilepsy remained refractory, with developmental plateauing. The proband was treated at that time with a combination of valproic acid (30 mg/kg/d), topiramate (5 mg/kg/d), clobazam (0.5 mg/kg/d), and ketogenic diet. Fenfluramine (FFA) (0.6 mg/kg/d) was started as an add‐on at 28 months. No further SE has occurred since that time, despite weaning of the ketogenic diet at age 3. Moreover, a significant reduction in seizure frequency was observed (Fig. 5). The 24‐h video EEG performed 1 year after addition of FFA revealed no myoclonus during the awake state, even when the background EEG remained unchanged. During sleep, several epileptic and non‐epileptic myoclonus were recorded; however, they were less severe than observed prior to FFA administration and did not lead to arousal of the child. Taken together, these observations suggest that FFA was effective in reducing epileptic severity. Nevertheless, her motor and cognitive development remained severely impaired with little improvement since the beginning of epilepsy: interaction is present with social smiling and vocalization, but the child is still unable to hold her head at 5 years, with a severe global hypotonia.
Figure 5.
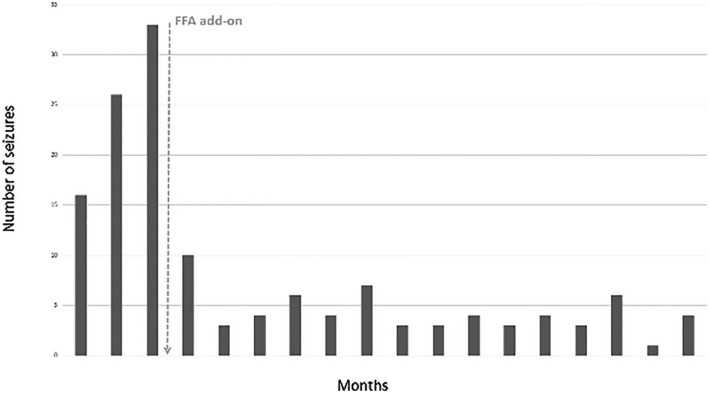
Number of seizures lasting more than 1 minute before and after fenfluramine (FFA) add‐on.
The work‐up showed normal metabolic analysis and normal brain MRI. Auditory brainstem response (ABR) indicated brainstem involvement, since wave V vanished bilaterally at 50 dB, while waves I and III were still identified at 30 dB. Evoked otoacoustic emissions were preserved, and both the behavioral audiometry and the auditory steady‐state responses estimated a bilateral hearing loss with a hearing threshold around 50 dB (Fig. 6). Electrocardiogram, holter ECG, and cardiac echography were normal (data not shown). A gene panel testing of DNA amplified by multiplex PCR (Ampliseq®) and re‐sequenced by next‐generation sequencing on Ion PGM® found a homozygous SCN1B variant c.253C > T (p.Arg85Cys) in the proband. Both parents and her older sister were found to be heterozygous carriers (Fig. 1). Other family members were not tested for the presence of the variant.
Figure 6.
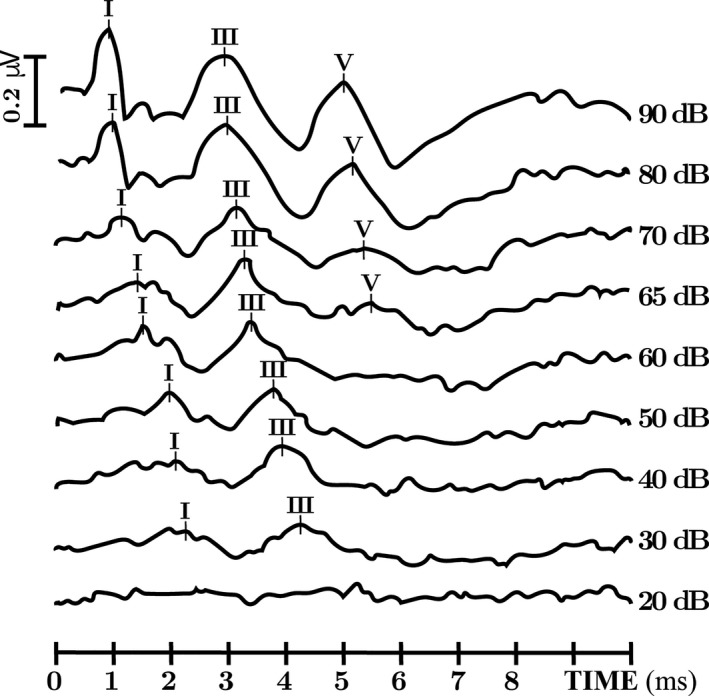
Auditory brainstem response obtained at various intensities decreasing from 90 to 20 dB alternatively in condensation and rarefaction polarity. ABR show, when stimulation intensity decreases, an early loss of the wave V, while wave I/III remains, and a prolonged I–V interpeak latencies. (For illustration purpose, only the right side is shown).
β1‐p.Arg85Cys is expressed at the cell surface
Previous work with the SCN1B‐p.Cys121Trp variant, linked to GEFS+, showed normal cell surface expression in heterologous cells, but LOF in terms of INa modulation.7, 20 A biallelic Scn1b‐p.Cys121Trp mouse model showed a phenotype that is similar to DS.21 In contrast, heterologous expression experiments with the variant, SCN1B‐p.Arg125Cys, linked to a diagnosis of DS, showed that the mutant β1 protein was retained inside the cell and subsequently unavailable at the plasma membrane to modulate INa.15 Growing the cells at a lower temperature, to permit proper protein folding, resulted in cell surface expression and normal INa modulation.15 To investigate the subcellular localization of this newly identified DEE‐linked SCN1B variant, p.Arg85Cys, which is located in the Ig loop domain (Fig. 7A and B),23 we performed cell surface biotinylation experiments comparing the polypeptide, β1‐p.Arg85Cys, to wild‐type (WT) β1 protein (Fig. 7A). Experiments were performed in Chinese hamster lung (CHL) fibroblasts that were stably transfected with soluble enhanced green fluorescent protein (eGFP), WT β1, or β1‐p.Arg85Cys. The WT β1 and β1‐p.Arg85Cys cDNA constructs each contained a C‐terminal, in‐frame, V5‐epitope tag followed by a 2A endoproteolytic sequence and eGFP on the 3’ end of the construct for detection of equimolar expression of a fluorescence marker protein. Total protein and neutravidin‐selected cell surface proteins were analyzed by western blot with anti‐V5 antibody. An antibody to HSP90 was used as an internal control to detect non‐cell surface proteins. Results shown in Figure 7C suggest that, similar to WT β1, β1‐p.Arg85Cys localizes to the cell surface. To confirm this result by another method, β1 subcellular localization in the same cell lines used in Figure 7B was assessed by confocal immunofluorescence microscopy. Cells were stained with fluorescently labeled wheat germ agglutinin (WGA), to identify the plasma membrane, and anti‐V5 antibody, to label WT or mutant β1 subunits. Colocalization between anti‐V5 and WGA was observed in both the WT β1 and β1‐p.Arg85Cys lines, confirming that the patient variant, β1‐p.Arg85Cys, can traffic to the plasma membrane (Fig. 7D). Orthogonal views of a single z‐stack from immunofluorescence microscopy are shown in Fig. 7E. No other overt differences in subcellular localization were observed between WT β1 and β1‐p.Arg85Cys.
Figure 7.
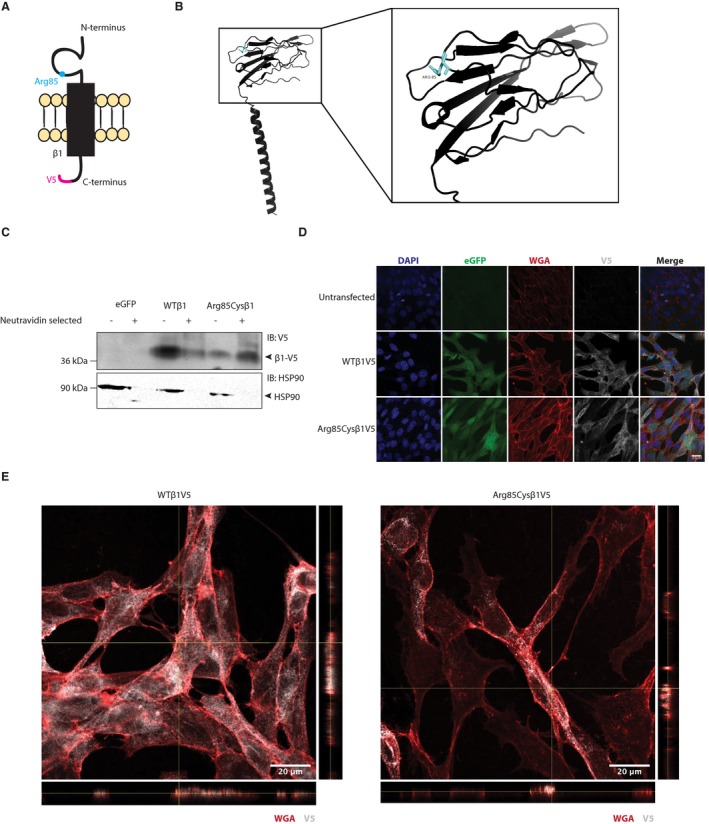
β1‐p.Arg85Cys localizes to the plasma membrane. (A) Cartoon diagram of β1‐p.Arg85Cys. (B) Crystal structure of WTβ1 (PDB: 6AGF).23 The residue, Arg85, is shown in cyan. Right: 20 angstrom area showing detail of the Ig domain. (C) Cell surface biotinylation shows that β1‐p.Arg85Cys can localize to the plasma membrane, similar to WT (representative of four independent experiments). (D) β1 WT and β1‐p.Arg85Cys colocalize with the plasma membrane marker, WGA (representative of five independent experiments). (E) Orthogonal views of a single z‐stack (YZ plane to right, XZ plane below) from immunofluorescence microscopy indicating colocalization between V5 and WGA signals.
Electrophysiological analysis
We next investigated the ability of β1‐p.Arg85Cys to modulate INa. Human Nav1.1 channels (hNav1.1) were chosen for this experiment due to their association with EIEE and DS.24 HEK‐hNav1.1 cells were transiently transfected with WT β1, β1‐p.Arg85Cys, or eGFP for voltage‐clamp analysis. Representative INa density traces, showing transient and persistent currents, evoked by a 50‐msec test pulse to 0 mv following a prepulse to −120 mV are shown in Figure 8A and quantified in Figure 8B and C. WT β1 co‐expression with hNav1.1 significantly increased transient and persistent INa density compared to hNav1.1 alone. In contrast, co‐expression of β1‐p.Arg85Cys with hNav1.1 did not significantly change these values. Figure 8B and E show quantification of the mean τ values for the fast and slow components, respectively, of INa inactivation. WT β1 significantly reduced the fast, but not slow component, while β1‐p.Arg85Cys had no significant effect on either value. Results shown in Figure 9 and Table 1 indicate that neither WT β1 nor β1‐p.Arg85Cys subunits affect the voltage dependence of hNav1.1‐generated INa.
Figure 8.
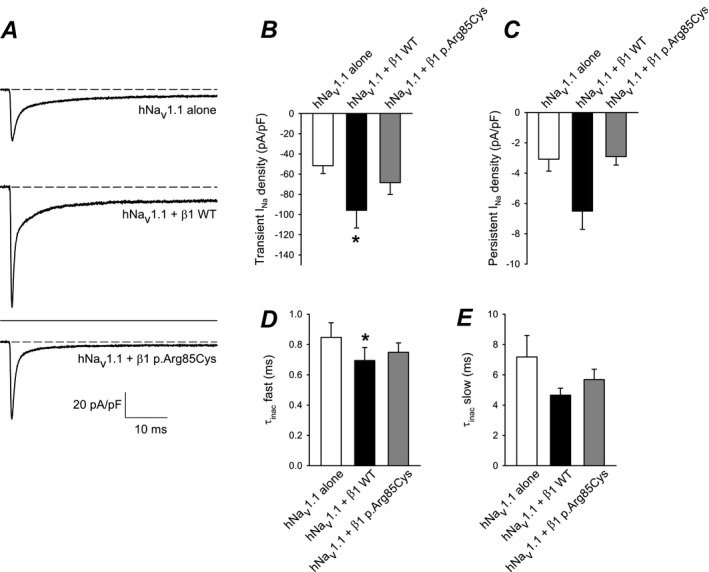
β1‐p.Arg85Cys does not modulate INa density or τ of inactivation. (A) Representative INa density traces; currents were evoked with a 50‐msec test pulse to 0 mv following a prepulse to − 120 mV. Top: Cells expressing hNav1.1 alone (eGFP only). Middle: Cells expressing hNav1.1 plus WT β1 subunits. Lower: Cells expressing hNav1.1 plus β1‐p.Arg85Cys subunits. All traces are shown at the same scale. (B) Mean transient INa density measured at the peak from currents represented in (A). (C) Mean persistent INa density measured as the average current of the last 2 msec of the current to 0 mV represented in (A). (D and E) INa inactivation was fit to a double exponential equation and the mean τ for the fast and slow components were plotted. n = 13 cells per condition; *P < 0.05. Error bars indicate mean ± standard error of the mean. *P < 0.05. [Correction added on 06 December 2019 after first online publication: Figure 8 has been updated.]
Figure 9.
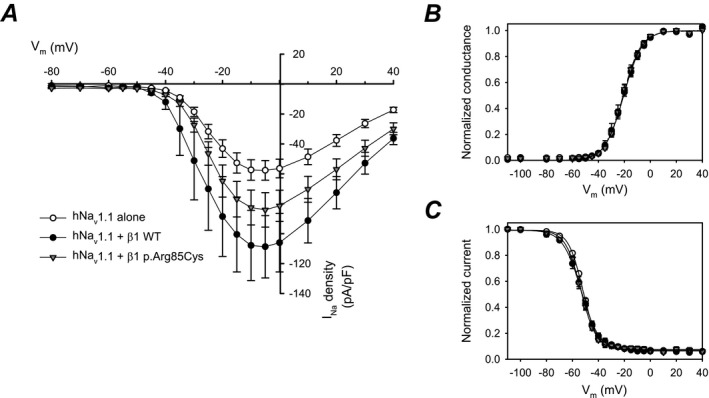
WT β1 subunit co‐expression increases hNav1.1 INa density but neither WT β1 nor β1‐p.Arg85Cys affect the voltage dependence of hNav1.1‐generated INa. (A) Mean current‐voltage relationships of transient INa: hNav1.1 alone, tranfected with eGFP only, (open circles, n = 12 cells), hNav1.1 plus WT β1 (closed circles, n = 11 cells), hNav1.1 plus β1‐p.Arg85Cys (triangles, n = 13 cells). (B) Activation curves from the data shown in (A). (C). Steady‐state inactivation curves recorded using a standard two‐pulse protocol (hNav1.1, n = 12 cells; hNav1.1 plus WT β1, n = 13 cells; hNav1.1 plus β1‐p.Arg85Cys, n = 13 cells). [Correction added on 06 December 2019 after first online publication: Figure 9 has been updated.]
Table 1.
Voltage‐dependent properties. Data were obtained by fitting individual activation or inactivation curves to a Boltzmann equation.
| Voltage‐dependent properties | n | ||||||
|---|---|---|---|---|---|---|---|
| Activation | Inactivation | ||||||
| G max (nS) | k (mV) | V 1/2 (mV) | h (mV) | V 1/2 (mV) | C | ||
| hNav1.1 alone (eGFP only) | 1.07 ± 0.13 | 7.08 ± 0.40 | −20.4 ± 0.8 | −5.81 ± 0.41 | −51.8 ± 0.4 | 0.07 ± 0.012 | 12 |
| hNav1.1 + β1 WT | 1.88 ± 0.41 | 6.72 ± 0.023 | −20.8 ± 1.5 | −6.90 ± 0.62 | −53.4 ± 1.2 | 0.06 ± 0.008 | 13 |
| hNav1.1 + β1‐p.R85C p.Arg85Cys | 1.35 ± 0.16 | 6.73 ± 0.32 | −20.7 ± 1.0 | −5.69 ± 0.32 | −53.6 ± 0.7 | 0.08 ± 0.079 | 13 |
Methods
Antibodies
Primary antibodies used were as follows: anti‐V5 (1:1000 dilution, Invitrogen), anti‐HSP90 (1:1,000 dilution, Enzo Life Science), or Wheat Germ Agglutinin Alexa Fluor™ 568 conjugate (1:200 dilution, ThermoFisher). Goat anti‐mouse HRP‐conjugated antibody was diluted to 1:10,000 (Invitrogen) for both V5 and HSP90 western blots. Alexa Fluor™ 647 (1:500 dilution) was used as a secondary antibody for anti‐V5 in immunocytochemistry experiments.
Expression vectors
Human WT β1‐V5‐2AeGFP and β1‐p.Arg85Cys‐V5‐2AeGFP cDNAs were generated by gBLOCK from Integrated DNA Technologies. Both β1 constructs contained an in‐frame, C‐terminal V5‐epitope tag followed by a 2A endoproteolytic sequence and eGFP on the 3’ end of the construct. A control construct expressing eGFP only was amplified from the WT construct using gene‐specific primers and gel‐purified. cDNAs were inserted into pENTR‐SD/D TOPO Gateway entry vector by a TOPO reaction according to the manufacturer's instructions. All constructs were moved to the Gateway‐compatible destination vector, pcDNAdest40, using a LR clonase reaction according to the manufacturer's instructions.
Cell lines
Chinese hamster lung fibroblasts were obtained from the American Type Culture Collection. A stable HEK cell line expressing human (h) Nav1.1 was a gift from GlaxoSmithKline. CHL and HEK‐hNav1.1 cells were maintained at 37°C and 5% CO2 in Dulbecco's Modified Eagle Medium (DMEM) supplemented with 5% heat‐inactivated fetal bovine serum (Corning) and 100 U/mL penicillin/streptomycin (Gibco). Stably transfected CHL cells and HEK‐hNav1.1 cells were supplemented with 600 µg/mL G418 (Gibco). Stable β1‐V5‐2AeGFP or β1‐p.Arg85Cys‐V5‐2AeGFP cell lines were generated by transfecting 1 µg of cDNA with 5 µL of Lipofectamine 2000. About 48 h following transfection, cells were passaged into media containing 600 µg/mL G418 and incubated until individual, eGFP‐positive colonies were visible (approximately 7–10 days). Clonal colonies were isolated, expanded, and verified for β1‐V5 or β1‐p.Arg85Cys‐V5 expression via western blot with anti‐V5 antibody. For electrophysiological analyses, HEK‐hNav1.1 cells were transiently transfected with β1‐V5‐2AeGFP, β1‐p.Arg85Cys‐V5‐2AeGFP, or eGFP only (1 µg of cDNA with 5 µL of Lipofectamine 2000). Approximately 12 h following transfection, the cells were passaged at low density onto 35‐mm dishes. Cells were identified by eGFP fluorescence by an investigator blind to genotype.
Cell surface biotinylation and western blot analyses
Stable cell lines were grown in 100‐mm tissue culture plates until 90–100% confluent. Cell surface proteins were biotinylated using the Cell Surface Protein Isolation Kit (Pierce) according to the manufacturer's protocol. Loading buffer containing 1% sodium dodecyl sulfate, 1 mmol/L β‐mercaptoethanol, and 0.2% dithiothreitol was added to samples and heated for 10 min at 85°C. Samples were separated on 10% Tris‐Glycine polyacrylamide gels, as noted in the figure legends, then transferred to nitrocellulose membrane (16 h, 55 mA, 4°C) and probed with antibodies as noted in the figure legends. Incubations with anti‐V5 and secondary antibody were completed using a SnapID (Millipore‐Sigma) with 10‐min incubations. Anti‐HSP90 was incubated overnight at 4°C in 2% milk in Tris‐buffered saline with 0.1% tween (TBST). Secondary antibodies to detect anti‐HSP90 were incubated at room temperature for 1 h. Immunoreactive bands were detected using West Femto chemiluminescent substrate (GE Health Sciences) and imaged on an iBrightFL1000 (Invitrogen).
Immunocytochemistry and confocal microscopy
CHL cells stably overexpressing WT β1‐V5‐2AeGFP or β1p.Arg85Cys‐V5‐2AeGFP constructs, as indicated in the figure legend, were incubated with WGA for 10 min at 4°C. Cells were washed three times for 5 min each in Dulbecco's phosphate‐buffered saline (DPBS) at 4°C and immediately fixed with 4% paraformaldehyde at room temperature for 15 min. Following fixation, cells were quickly washed three times in DPBS and blocked in 90% DPBS, 10% goat serum, and 0.3% triton X‐100 for 1 h at room temperature in a dark, humidified chamber. Cells were incubated in anti‐V5 overnight in a dark, humidified chamber. Cells were washed three times for 10 min each with DPBS, incubated in secondary antibody (Alexa Fluor™ 647) for 2 h in a dark, humidified chamber at room temperature, and then washed three times for 10 min in DPBS. Slides were air dried and mounted in Prolong Gold with DAPI (Invitrogen). Stained cells were imaged on a Zeiss 880 confocal microscope at the University of Michigan Department of Pharmacology.
Electrophysiological analysis
HEK‐hNav1.1 cells were transiently transfected as described above. Electrophysiological recordings were performed ~12 h following final plating. Isolated INa was recorded using standard whole‐cell patch clamp, with previously described conditions.25 Briefly, isolated INa was recorded from GFP‐positive HEK cells at 21–22°C in the presence of a bath solution containing (in mmol/L): 120 NaCl, 1 BaCl2, 2 MgCl2, 0.2 CdCl2, 1 CaCl2, 10 HEPES, 20 TEA‐Cl, and 10 glucose (pH = 7.35 with CsOH, osmolarity = 300–305 mosm). Fire‐polished patch pipettes were filled with an internal solution containing (in mmol/L): 1 NaCl, 150 N‐methyl‐d‐glucamine, 10 ethyleneglycoltetraacetic acid (EGTA), 2 MgCl2, 40 HEPES, and 25 phosphocreatine‐tris, 2 MgATP, 0.02 Na2GTP, 0.1 leupeptin (pH = 7.2 with H2SO4). All recordings were performed within 10 to 120 min after the culture medium was replaced by bath recording solution and the dish with cells was placed on the recording setup. Holding potential was −80 mV.
Voltage‐clamp analysis was performed using pClamp 10 (Molecular Devices) and SigmaPlot 11 (Systat software). Statistical analyses, t‐test, and one‐way ANOVA, were performed using SigmaPlot. Statistical significance was determined by P > 0.05.
Discussion
Here, we provide the first detailed electroclinical investigation of an epilepsy patient with bilateral hearing loss presenting with a previously unreported, inherited homozygous SCN1B missense variant, p.Arg85Cys, suggesting that this genotype is linked to an early infantile DEE rather than typical DS. Moreover, a significant reduction of seizure severity and of the fever‐induced SE was observed after FFA add‐on that persisted after a 2‐year follow‐up. Functional analysis of β1‐p.Arg85Cys protein in heterologous cells showed loss of Nav1.1‐generated INa modulation in spite of normal levels of expression of the mutant protein at the cell surface. A previously described SCN1B LOF variant at this position, β1‐p.Arg85His, has been linked to atrial fibrillation familial type 13 in heterozygous patients.26 Similar to β1‐p.Arg85Cys shown here, β1‐p.Arg85His was found to be expressed at the cell surface but lost the ability to modulate Nav1.5‐generated INa when expressed in a heterologous system.26 Previous work has shown that β1‐mediated effects on current modulation are cell‐type specific.5 Additionally, the heterologous cells utilized in these studies are nonpolarized and do not form specialized membrane microdomains such as axon initial segments or intercalated discs. Future work that characterizes these patient variants in neurons or cardiomyocytes may provide additional insights into disease mechanisms.
Patients with homozygous SCN1B variants are very rare. Seven patients have been reported so far, all diagnosed with DS.15, 16, 17 However, a review of the literature suggests that six of these seven published cases do not strictly fit DS criteria. In DS, first seizures usually begin around 6 to 12 months of age, with prolonged febrile, generalized, clonic, or hemiclonic seizures, and a normal EEG background until 2 years of age. Development shows signs of decline after 2 years of age. Disease is progressively marked by additional seizures of multiple etiologies, ataxia, and pyramidal signs.27, 28
The first SCN1B DEE patient described by Patino et al. (SCN1B‐p.Arg125Cys)15 was similar to the present case but with some clinical characteristics in favor of DS, for example, the presence of refractory FS, myoclonus, and seizure triggers like vaccination, fever, and infection. Nevertheless, the disease evolution of the SCN1B‐p.Arg125Cys patient was worse than the usual DS course. The EEG was abnormal from 3 months of age, with central discharges. While the neonatal period was not reported, a tetrapyramidal syndrome with global hypotonia was noted at 13 months. The reported absence of SE was not typical of DS. The patient died due to aspiration pneumonia at 14 months. The second patient, described by Ogiwara et al. (SCN1B‐p.Ile106Phe),17 was more similar to DS. While initial seizures were not provoked by fever, fever‐sensitive seizures of various types, including myoclonic seizures, appeared around 6 months of age. Developmental decline occurred earlier than typical DS. The course of the disease was marked by a global developmental delay with progressive ataxia and intractable epilepsy. Interictal EEG was initially normal, but started to display multifocal spikes and slow waves, occurring singly or in bursts, around 1 year of age. In a less clinically detailed paper, Ramadan et al. reported five other cases of SCN1B‐linked EE from three consanguineous families (SCN1B‐p.Tyr119Asp and SCN1B‐c.449‐2Ala > Gly, which are likely splice site variants).16 No seizure triggers, like fever or vaccination, were mentioned. The ages of EEG completion and seizure types were not systematically specified. Epilepsy onset and developmental decline appeared early (1 or 2 months old) in four of the five cases. One of the three families had a different phenotype with microcephaly, dysmorphic features, and various malformations.
In the present patient case, development was already abnormal at birth. Epilepsy started early, at 3 months of age, with abundant EEG discharges. The course of the disease was severe with profound motor and cognitive delay. While the observed prolonged febrile myoclonic or hemiclonic seizures were more concordant with DS, electroclinical evidence suggests that SCN1B‐linked DEE is more severe, with an earlier onset of seizures and developmental delay. This idea is consistent with the negative result of the study of Kim et al, looking for SCN1B variants in a cohort of DS patients29 as well as with the finding of neuronal pathfinding deficits in Scn1b null mice at postnatal day 10 prior to seizure onset.30 Thus, we propose that the term, “early infantile DEE,” is more appropriate than EIEE, which is classically used in patients with a severe early onset epilepsy and profound developmental delay. The term “epileptic encephalopathy” refers to conditions where the epileptic abnormalities themselves are thought to contribute to the progressive disturbance of cerebral function, such that early effective intervention may improve developmental outcome.31 Whether the patient reported here, and more generally all patients with EIEE, fit this definition of epileptic encephalopathy is highly debatable because the neurological prognosis of these patients seems predominantly caused by preexisting brain dysfunction31 and not by the severity of the epilepsy. Our case illustrates this concept: development was already abnormal from birth, before the onset of epilepsy, and despite the resolution of febrile SE and significant improvement of seizure frequency with FFA add‐on, we did not observe a significant improvement in neurological development. Because neurological prognosis is predominantly caused by a developmental encephalopathy of genetic origin, early infantile DEE seems a more appropriate term than EIEE to describe the electroclinical picture of this patient.
The addition of FFA (0.6 mg/kg/d) to the anticonvulsant regimen of our patient resulted in a significant and prolonged reduction in seizure frequency with increased quality of life (Fig. 5), but no significant improvement in motor or cognitive development. FFA was developed originally as an appetite suppressant but was withdrawn from human use after reports of increased risk of cardiac valvulopathy and pulmonary hypertension in adult patients treated with high‐dose FFA for obesity.32 The potential utility of FFA in epilepsy emerged in the 1980s with its use in intractable self‐induced epilepsy33, 34 and in the 1990s with a remarkable effect on a group of patients who were shown later to present with SCN1A‐DS variants.35 The positive benefit/risk ratio profile of low‐dose FFA treatment in patients with DS was confirmed in a recently reported phase 3 study.36, 37 FFA antiepileptic activity is thought to arise via enhanced serotonergic neurotransmission by augmenting carrier‐mediated synaptic release of 5‐HT and by preventing reuptake.38, 39 In our patient, low‐dose FFA provided resolution of febrile SE and sustained, clinically meaningful, daily seizure reduction that persisted after a 2‐year follow‐up. FFA was well tolerated with no clinical and/or echocardiographic signs of cardiac valvulopathy or pulmonary hypertension. These results suggest that FFA may provide a promising treatment option in patients with homozygous SCN1B‐linked early infantile DEE.
Early infantile DEE resulting from homozygous SCN1B LOF variants may be similar to a new class of variants linked to a recurrent, missense SCN1A variant, p.Thr226Met, which is associated with a more severe clinical phenotype than typical DS. In SCN1A‐linked early infantile DEE, seizures and epileptic spasms are observed beginning at an average of 9 weeks of age, with concomitant development of hyperkinetic movement disorders, including choreoathetosis, dystonia, myoclonus, and perioral hyperkinesia. Patients have greater developmental impairments than DS, are nonambulatory, and the majority require feeding tubes.40 Heterologous expression of the mutant Nav1.1‐p.Thr226Met protein showed negative shifts in the voltage dependence of both activation and inactivation of INa compared to WT Nav1.1, which can be interpreted as both gain‐ and loss‐of‐function.41
To conclude, we present an eighth case of a homozygous variant in SCN1B with a phenotype of early infantile DEE, rather than DS, and a prolonged response to FFA. The pathogenic role of this variant has been assessed in vitro and, while FFA appears to be particularly efficient in resolution of febrile SE and reduction in seizure frequency in this patient, further studies are needed to identify new therapeutic options to improve the neurological development of this devastating disease. Importantly, a review of the literature in light of our results suggests that early infantile DEE is a more appropriate terminology than either EIEE or DS for SCN1B‐linked epileptic encephalopathy.
Author contributions
AAB, JO, and BA performed and analyzed the molecular biology and cell biology experiments. LFL‐S performed and analyzed the electrophysiological experiments. LLI planned and supervised the molecular, cellular, and electrophysiological research and wrote the manuscript. AA and CS performed the clinical follow‐up and electroclinical description, prepared the figures, and wrote the manuscript. DL performed the gene panel. AS and BC performed FFA treatment and follow‐up. MV performed the ABR and generated the figure.
Conflict of Interest
The authors declare no conflict of interest.
Acknowledgments
Supported by NIH R37 NS076752 to LLI, NIH T32 GM008322 predoctoral fellowship to AAB, and NIH F31 HL144047 to AAB.
Funding Information
Supported by NIH R37 NS076752 to LLI, NIH T32 GM008322 predoctoral fellowship to AAB, and NIH F31 HL144047 to AAB.
Funding Statement
This work was funded by National Institute of General Medical Sciences grant GM008322; National Institute of Neurological Disorders and Stroke grant NS076752; National Heart, Lung, and Blood Institute grant HL144047.
Contributor Information
Alec Aeby, Email: alec.aeby@huderf.be.
Lori L. Isom, Email: lisom@umich.edu.
References
- 1. Catterall WA. Voltage‐gated sodium channels at 60: structure, function and pathophysiology. J Physiol 2012;590(Pt 11):2577–2589. [DOI] [PMC free article] [PubMed] [Google Scholar]
- 2. Hartshorne RP, Catterall WA. Purification of the saxitoxin receptor of the sodium channel from rat brain. Proc Natl Acad Sci USA 1981;78:4620–4624. [DOI] [PMC free article] [PubMed] [Google Scholar]
- 3. Messner DJ, Catterall WA. The sodium channel from rat brain. Separation and characterization of subunits. J Biol Chem 1985;260:10597–10604. [PubMed] [Google Scholar]
- 4. Brackenbury WJ, Isom LL. Na Channel beta subunits: overachievers of the ion channel family. Front Pharmacol 2011;2:53. [DOI] [PMC free article] [PubMed] [Google Scholar]
- 5. O'Malley HA, Isom LL. Sodium channel beta subunits: emerging targets in channelopathies. Annu Rev Physiol 2015;10:481–504. [DOI] [PMC free article] [PubMed] [Google Scholar]
- 6. Isom LL, Catterall WA. Na+ channel subunits and Ig domains. Nature 1996;383:307–308. [DOI] [PubMed] [Google Scholar]
- 7. Kruger LC, O'Malley HA, Hull JM, et al. beta1‐C121W is down but not out: epilepsy‐associated Scn1b‐C121W results in a deleterious gain‐of‐function. J Neurosci 2016;36:6213–6224. [DOI] [PMC free article] [PubMed] [Google Scholar]
- 8. Marionneau C, Carrasquillo Y, Norris AJ, et al. The sodium channel accessory subunit Navbeta1 regulates neuronal excitability through modulation of repolarizing voltage‐gated K(+) channels. J Neurosci 2012;32:5716–5727. [DOI] [PMC free article] [PubMed] [Google Scholar]
- 9. Deschenes I, Armoundas AA, Jones SP, Tomaselli GF. Post‐transcriptional gene silencing of KChIP2 and Navbeta1 in neonatal rat cardiac myocytes reveals a functional association between Na and Ito currents. J Mol Cell Cardiol 2008;45:336–346. [DOI] [PMC free article] [PubMed] [Google Scholar]
- 10. Deschênes I, Tomaselli GF. Modulation of Kv4.3 current by accessory subunits. FEBS Lett 2002;528:183–188. [DOI] [PubMed] [Google Scholar]
- 11. Nguyen HM, Miyazaki H, Hoshi N, et al. Modulation of voltage‐gated K+ channels by the sodium channel beta1 subunit. Proc Natl Acad Sci USA 2012;109:18577–18582. [DOI] [PMC free article] [PubMed] [Google Scholar]
- 12. Wong HK, Sakurai T, Oyama F, et al. beta Subunits of voltage‐gated sodium channels are novel substrates of beta‐site amyloid precursor protein‐cleaving enzyme (BACE1) and gamma‐secretase. J Biol Chem 2005;280):23009–23017. [DOI] [PubMed] [Google Scholar]
- 13. Kim DY, Carey BW, Wang H, et al. BACE1 regulates voltage‐gated sodium channels and neuronal activity. Nat Cell Biol 2007;9:755–764. [DOI] [PMC free article] [PubMed] [Google Scholar]
- 14. Edokobi N, Isom LL. Voltage‐gated sodium channel beta1/beta1B subunits regulate cardiac physiology and pathophysiology. Front. Physiol. 2018;9:351. [DOI] [PMC free article] [PubMed] [Google Scholar]
- 15. Patino GA, Claes LR, Lopez‐Santiago LF, et al. A functional null mutation of SCN1B in a patient with Dravet syndrome. J Neurosci 2009;29:10764–10778. [DOI] [PMC free article] [PubMed] [Google Scholar]
- 16. Ramadan W, Patel N, Anazi S, et al. Confirming the recessive inheritance of SCN1B mutations in developmental epileptic encephalopathy. Clin Genet 2017;92:327–331. [DOI] [PubMed] [Google Scholar]
- 17. Ogiwara I, Nakayama T, Yamagata T, et al. A homozygous mutation of voltage‐gated sodium channel beta(I) gene SCN1B in a patient with Dravet syndrome. Epilepsia 2012;53:e200–e2003. [DOI] [PubMed] [Google Scholar]
- 18. Chen C, Westenbroek RE, Xu X, et al. Mice lacking sodium channel beta1 subunits display defects in neuronal excitability, sodium channel expression, and nodal architecture. J Neurosci 2004;24:4030–4042. [DOI] [PMC free article] [PubMed] [Google Scholar]
- 19. Yuan Y, O'Malley HA, Smaldino MA, et al. Delayed maturation of GABAergic signaling in the Scn1a and Scn1b mouse models of Dravet Syndrome. Sci Rep 2019;9:6210. [DOI] [PMC free article] [PubMed] [Google Scholar]
- 20. Meadows LS, Malhotra J, Loukas A, et al. Functional and biochemical analysis of a sodium channel b1 subunit mutation responsible for Generalized Epilepsy with Febrile Seizures Plus Type 1. J Neurosci 2002;22:10699–10709. [DOI] [PMC free article] [PubMed] [Google Scholar]
- 21. Wimmer VC, Reid CA, Mitchell S, et al. Axon initial segment dysfunction in a mouse model of genetic epilepsy with febrile seizures plus. J Clin Invest 2010;120:2661–2671. [DOI] [PMC free article] [PubMed] [Google Scholar]
- 22. Calhoun JD, Carvill GL. Unravelling the genetic architecture of autosomal recessive epilepsy in the genomic era. J Neurogenet 2018;32:295–312. [DOI] [PubMed] [Google Scholar]
- 23. Pan X, Li Z, Zhou Q, et al. Structure of the human voltage‐gated sodium channel Nav1.4 in complex with beta1. Science 2018;362 10.1126/science.aau2486 [DOI] [PubMed] [Google Scholar]
- 24. Catterall WA. Dravet syndrome: a sodium channel interneuronopathy. Curr Opin Physiol 2018;2:42–50. [DOI] [PMC free article] [PubMed] [Google Scholar]
- 25. Liu Y, Lopez‐Santiago LF, Yuan Y, et al. Dravet syndrome patient‐derived neurons suggest a novel epilepsy mechanism. Ann Neurol 2013;74:128–139. [DOI] [PMC free article] [PubMed] [Google Scholar]
- 26. Watanabe H, Darbar D, Kaiser DW, et al. Mutations in sodium channel β1‐ and β2‐subunits associated with atrial fibrillation. Circulation 2009;2:268–275. [DOI] [PMC free article] [PubMed] [Google Scholar]
- 27. Wirrell EC, Laux L, Donner E, et al. Optimizing the diagnosis and management of dravet syndrome: recommendations from a north american consensus panel. Pediatr Neurol 2017;68:34.e3. [DOI] [PubMed] [Google Scholar]
- 28. Dravet C. The core Dravet syndrome phenotype. Epilepsia 2011;52(Suppl 2):3–9. [DOI] [PubMed] [Google Scholar]
- 29. Kim YO, Dibbens L, Marini C, et al. Do mutations in SCN1B cause Dravet syndrome? Epilepsy Res 2013;103:97–100. [DOI] [PubMed] [Google Scholar]
- 30. Brackenbury WJ, Yuan Y, O'Malley HA, et al. Abnormal neuronal patterning occurs during early postnatal brain development of Scn1b‐null mice and precedes hyperexcitability. Proc Natl Acad Sci USA 2013;110:1089–1094. [DOI] [PMC free article] [PubMed] [Google Scholar]
- 31. Scheffer IE, Berkovic S, Capovilla G, et al. ILAE classification of the epilepsies: position paper of the ILAE commission for classification and terminology. Epilepsia 2017;58:512–521. [DOI] [PMC free article] [PubMed] [Google Scholar]
- 32. Connolly JM, Bakay MA, Fulmer JT, et al. Fenfluramine disrupts the mitral valve interstitial cell response to serotonin. Am J Pathol 2009;175:988–997. [DOI] [PMC free article] [PubMed] [Google Scholar]
- 33. Aicardi J, Gastaut H. Treatment of self‐induced photosensitive epilepsy with fenfluramine. N Engl J Med 1985;313:1419. [DOI] [PubMed] [Google Scholar]
- 34. Boel M, Casaer P. Add‐on therapy of fenfluramine in intractable self‐induced epilepsy. Neuropediatrics. 1996;27:171–173. [DOI] [PubMed] [Google Scholar]
- 35. Ceulemans B, Boel M, Leyssens K, et al. Successful use of fenfluramine as an add‐on treatment for Dravet syndrome. Epilepsia 2012;53:1131–1139. [DOI] [PubMed] [Google Scholar]
- 36. Ceulemans B, Schoonjans AS, Marchau F, et al. Five‐year extended follow‐up status of 10 patients with Dravet syndrome treated with fenfluramine. Epilepsia 2016;57:e129–e134. [DOI] [PubMed] [Google Scholar]
- 37. Schoonjans A, Paelinck BP, Marchau F, et al. Low‐dose fenfluramine significantly reduces seizure frequency in Dravet syndrome: a prospective study of a new cohort of patients. Eur J Neurol. 2017;24:309–314. [DOI] [PMC free article] [PubMed] [Google Scholar]
- 38. Fuller RW, Snoddy HD, Hemrick SK. Effects of fenfluramine and norfenfluramine on brain serotonin metabolism in rats. Proc Soc Exp Biol Med 1978;157:202–205. [DOI] [PubMed] [Google Scholar]
- 39. Baumann MH, Bulling S, Benaderet TS, et al. Evidence for a role of transporter‐mediated currents in the depletion of brain serotonin induced by serotonin transporter substrates. Neuropsychopharmacology 2014;39:1355–1365. [DOI] [PMC free article] [PubMed] [Google Scholar]
- 40. Sadleir LG, Mountier EI, Gill D, et al. Not all SCN1A epileptic encephalopathies are Dravet syndrome: early profound Thr226Met phenotype. Neurology 2017;89:1035–1042. [DOI] [PMC free article] [PubMed] [Google Scholar]
- 41. Berecki G, Bryson A, Terhag J, et al. SCN1A gain of function in early infantile encephalopathy. Ann Neurol 2019;85:514–525. [DOI] [PubMed] [Google Scholar]


