

Abstract
During cell migration, forces applied to a cell from its environment influence the motion. When the cell is placed on a substrate, such a force is provided by the cell-substrate adhesion. Modulation of adhesivity, often performed by the modulation of the substrate stiffness, tends to cause common responses for cell spreading, cell speed, persistence, and random motility coefficient. Although the reasons for the response of cell spreading and cell speed have been suggested, other responses are not well understood. In this study, we develop a simple toy model for cell migration driven by the relation of two forces: the adhesive force and the plasma membrane tension. The simplicity of the model allows us to perform the calculation not only numerically but also analytically, and the analysis provides formulas directly relating the adhesivity to cell spreading, persistence, and the random motility coefficient. Accordingly, the results offer a unified picture on the causal relations between those multiple cellular responses. In addition, cellular properties that would influence the migratory behavior are suggested.
Keywords: Cell migration, Chemokinesis, Persistence, Random motility coefficient, Modeling
Introduction
Motion is caused by forces; the cell is no exception. When the cell is placed on a substrate, cell-substrate adhesion provides the only force from the environment and will govern the cell’s migratory behavior. The influence of the adhesivity can be inferred by varying the substrate stiffness since it has been observed in many experiments that cells tend to adhere more strongly to stiffer substrates for neutrophils [1, 2], fibroblasts [3–7], and myoblasts [8, 9] while filopodia are excepted [10]. The effects of substrate stiffness on cell migration and/or morphology have been studied in various cell types including neutrophils [1, 11–13], fibroblasts [3–7, 11, 14–20], epithelial cells [6, 14], smooth muscle cells [21–24], cardiomyocytes [25], myoblasts [8, 9], and endothelial cells [26, 27] (see [28, 29] for a review). In most experiments, cells tend to show common responses; on stiffer substrates (and therefore at stronger adhesion), cells spread more [1, 3–5, 8, 11–15, 20, 22–26], move more slowly [1, 3, 7, 13, 14, 21] and more persistently [1, 12, 19], and show a biphasic trend of random motility coefficient (RMC, that is, the diffusion coefficient for inorganic particles), i.e., the presence of a maximum of RMC at a certain stiffness [12], whereas some exceptions have been observed for cell spreading [17], migration speed [12, 18, 23], persistence [17], and RMC [27]. Cells also respond to inhomogeneous mechanical environments; cells manifest durotaxis, that is, the tendency to migrate toward a stiffer region of the substrate [3, 21, 30–32], and cells migrate in the direction of shear stress under fluid flow [33, 34] although an exception is known [35].
Some of those responses are intuitively understandable. Regarding cell spreading, as suggested in a study [22], cells would spread more at stronger adhesion because adhesion would support the expansion of the plasma membrane. For cell speed, as suggested in [1], cells would move slowly at strong adhesion because the disruption of stronger adhesion would require more time for translocation of the cell body. On the subject of cell speed, we will discuss the details later, because in contrast to this intuitive reasoning, some studies have presented a biphasic dependence on substrate stiffness and adhesivity [12, 23]. Although these mechanisms have been suggested, it remains unclear why cells migrate more persistently at stronger adhesion and why a peak of RMC emerges at a certain adhesivity.
In this study, we theoretically explore how the cell migration is affected by cell-substrate adhesivity through the investigation of a mathematical model for spontaneous random cell migration in one-dimensional (1D) space. According to Newton’s third law, namely the action-reaction relation, we hypothesize that translocation of the cell body is governed by the relation between two forces: the adhesive force and plasma membrane tension. Due to its simplicity, this model can characterize cell migration without describing the intracellular details such as cytosolic chemical components. Although this hypothesis seems oversimplified, the model predicts multiple experimental observations, that is, the increase in cell spreading and persistence and the biphasic trend of RMC for increasing adhesive strength. The model also accounts for the directional migration in durotaxis and under external shear stress. Although many mathematical models for cell migration have already been proposed [36–53] (see [54–58] for a review), the present model has an advantage; owing to its simplicity, we can carry out the calculation not only numerically but also analytically, which provides formulas directly relating the adhesivity, cellular properties, and cellular migratory behavior, and suggests causal relations underlying the above cellular responses (see Appendix A for the detailed comparison of the present study with the previous theoretical works).
Model
It is widely accepted that the movement of a cell proceeds via cyclic repetition of the following processes: protrusion of the plasma membrane takes place at the front because of extension of actin filaments, the protruded membrane adheres to the substrate, and the plasma membrane is retracted at the rear via disruption of the adhesion [59, 60]. Even in the absence of any extracellular guiding factor such as a concentration gradient of a chemoattractant, cells show spontaneous migration with changing the migration direction frequently [61, 62].
Incorporating these processes, we construct a model for this spontaneous random migration of a single cell in 1D space changing its position by stochastically protruding and retracting its plasma membrane. Figure 1 schematically illustrates the model. The membrane protrusion and retraction induce a change in the position of the cell’s edges represented by xL(t) and xR(t) for the left edge and right edge, respectively. Note that experiments on 2D substrates are mainly consulted in this study to determine parameter values for numerical simulations and to discuss the agreement between the theory and experiments. The reason is that, although studies on cells in 1D space are increasing in number (see [63] for a review), experiments focusing on the effects of adhesivity or substrate stiffness in 1D space are still quite rare [64].
Fig. 1.
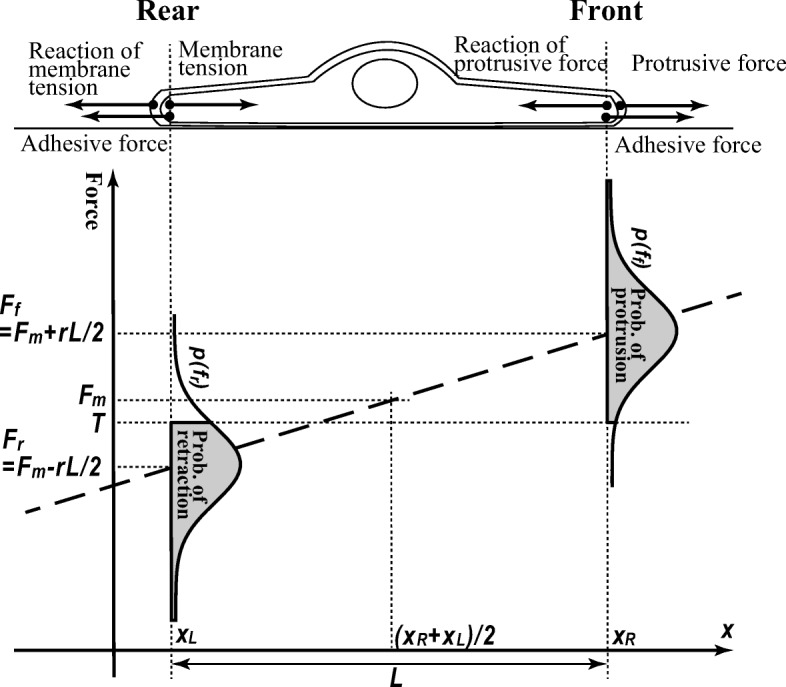
Schematic illustration of the model. The cell migrates in a 1D space. The protrusion and retraction of the cell membrane and the switching of the migration direction occur depending on the relation between the membrane tension and the adhesive force at the front and rear
In the present model, the membrane protrusion and retraction are governed by the relation between two forces: membrane tension and adhesive force. Let T(t) be the membrane tension at time t, and be uniform across the membrane because of fast propagation [65]. Note that, to be precise, this tension indicates the sum of all the forces which work as tension, i.e., the forces inducing the change in the cell surface area, which may include cortical tension as well as the naïve membrane tension generated by the lipid bilayer. According to the positive correlation between membrane tension and cell spreading [66], we postulate a linear relation between them for simplicity, formulated as T(t) = K(L(t) − L0) in 1D space, where L(t) := xR(t) − xL(t) gives the cell length, and K and L0 respectively denote the membrane elasticity and natural cell length, i.e., the cell length without expansion.
The adhesive force is the other crucial force regulating membrane protrusion and retraction for the following reason. When actin filaments push the membrane forward at the front from inside, due to Newton’s third law, the reaction force pushes the filaments back with the same strength. Therefore, the filaments must be supported by something with another force pushing forward, and this supporter has to be supported by something else. According to the series of these action-reaction relations, the system cannot be closed inside of the cell; the cell must be pushed forward by something extracellular. Thus, the cell-substrate adhesion should support the force required for the membrane protrusion. This inference is not new and can be found in some studies [22, 57, 60].
In addition, reflecting the observations that adhesive sites near the leading edge support the force for the protrusion [67], the cell front is assumed to protrude when adhesive force at the front ff(t) exceeds the membrane tension T(t). To be precise, ff(t) represents the maximal force beyond which the cell-substrate connection breaks up. For the same reason, the membrane retracts at the rear when T(t) exceeds the adhesive force at the rear fr(t) in accordance with a study in which the retraction was assisted by membrane tension [68]. The two forces, ff(t) and fr(t), are determined as follows.
Adhesion sites are not uniformly distributed across a cell even in the absence of inhomogeneity in the environment: adhesion is stronger at the front than at the rear [69]. Such asymmetry is generally referred to as polarity [70]. Theories about polarization predict positive correlations between cell size and the magnitude of polarity [71]. Accordingly, in this model, we assume that the difference between the adhesive forces at the front and rear increases with cell length; the mean adhesive force at the front is given by and at the rear . Here, Fm represents the mean adhesive force averaged across the cell and is assumed to be constant because this would be determined by the properties of the cell and substrate. We mainly focus on the dependence of migratory behavior on this parameter to investigate the influence of the cell-substrate adhesivity. Another parameter, r, represents a cellular property indicating how highly the cell can polarize, and is referred to as polarizability in what follows.
In the model, the protrusion and retraction are assumed to occur in a stepwise manner at each discretized time step. Because the adhesivity fluctuates with evolution of time [72], the adhesive forces at the front ff(t) and at the rear fr(t) at each time step are randomly chosen according to probability distributions, pf and pr, whose means exist at Ff(t) and Fr(t) defined above, respectively. For simplicity, we use a normal distribution for the probability distributions: and , where the fluctuation of adhesivity σ is introduced. As we see later, these functional forms are not required for the qualitative results as far as unimodal functions are assumed.
When the selected adhesive force at the front ff(t) exceeds T(t), the adhesion can support the protrusion at the front. Then, the front edge is protruded. On the other hand, the rear edge is retracted when the chosen adhesive force at the rear fr(t) is less than T(t) because the adhesive force at the rear cannot support the membrane tension. When ff(t) is less than T(t), the adhesive force is not sufficient to support the protrusion; therefore, the cell cannot migrate forward more. In this case, the cell changes the migration direction, i.e., switches the front and rear in the present model. Note that even if we assume that this switching does not always happen, the results are not affected substantially (Appendix B).
To avoid complexity, contractile forces generated by stress fibers formed by actomyosin are not incorporated into the model. Because we focus on the net translocation of the entire cell body in this study, this omission would not be crucial; when a contractile force is generated at one edge of an actomyosin, another force in the opposite direction and almost the same magnitude should be generated at the other edge. Therefore, the contractile forces would contribute little to the net translocation of the center of mass of the cell. Indeed, some works report that the absence of myosin does not affect the persistence in cell migration [73–75]. A recent study reports that adhesion formation in the lamellipodium functions as a myosin-independent mechanosensor to control cell adhesion and spreading [20]. In addition, a recent theoretical work succeeds in the description of cell migration in spite of the omission of the role of the actomyosin [53].
Parameter values
This model includes five parameters, Fm, L0, r, σ, and K. Although the model works independently of the cell type and therefore regardless of parameter values, their values need to be set to test by numerical simulations or show the analytical results graphically. We determine them by means of experiments on neutrophils because a lot of data are available. 100 Pa is chosen according to experiments on substrate stiffness in the range from 3 to 13 kPa [12], combined with a relation between substrate stiffness s and adhesive force Fm, Fm[Pa] = 20s[kPa] + 100, estimated from another study [1]. 10 μ m follows from typical cell size. Although r has never been measured directly, Pa/μ m is obtained from an observation that the difference in the adhesive force between the front and rear is thought to be 1/10 of the maximal adhesive force [76]: rL0 ≈ Fm/10. Pa is estimated from the time evolution of the adhesive force [1]. Pa/μ m is obtained from a study [1] where an increase of 400 Pa in adhesive force induced an increase by μm2 in cell area corresponding to an increase of 20 μ m in cell length in 1D space because μ m.
The updating rule in simulation
In the numerical simulation, time evolutions of the right edge xR(t) and left edge xL(t) are updated by the cycle of the following three steps. (1) Adhesive forces at the front ff(t) and rear fr(t) are chosen according to probability distributions pf(f) and pr(f) defined above. (2) If fr(t) < T(t), then the rear edge is retracted by unit length. If ff(t) > T(t), then the front edge is protruded by unit length. (3) If ff(t) < T(t), then the front and rear are switched. We implicitly assume the presence of the sufficient drag force during the movement; in other words, the step sizes of the protrusion and retraction are independent of the magnitude of ff(t) − T(t) and T(t) − fr(t). The step size should be taken as small as possible to simulate the continuous movement of a cell. We use 1 μ m for the step size. As seen in the analysis later, the predictions do not depend on this length qualitatively. In all initial states, we set xR(0) = 10 μ m and xL(0) = 0 μ m, and the right edge is set to be the front. For each combination of the parameter values, the code ran 10,000 time steps for 10 samples. The time in the calculation is converted to the real time scale from a relation between cell speed S and adhesivity Fm, S[μ m/min] = − 0.025Fm[Pa] + 12.5, estimated from an experimental study [12]. That is to say, since the spatial step size is fixed at 1 μ m, the real-time duration τ of the single-time step is given by τ = 1/(− 0.025Fm[Pa] + 12.5) [min].
Results
Time evolution
The numerical simulations provide time courses of the cell trajectory (Appendix C). It is observed that the cell tends to migrate persistently when it adheres strongly. In addition, it is also observed that the cell length reaches an equilibrium state after a short period (Appendix C). This feature suggests that the analysis in terms of equilibrium states should be successful. In what follows, overlines on the variables, , represent quantities in equilibrium.
Cell length
In those equilibrium states, membrane tension should be balanced with mean adhesive force: . According to T = K(L − L0), the cell length is obtained as . Figure 2 shows this relation. The numerical simulation reproduces this relation (Appendix D). The cell length increases with the mean adhesive force independently of other parameters. Regarding other parameters, the cell length decreases with membrane elasticity K, increases with natural cell length L0, and is independent from polarizability r and adhesivity fluctuation σ.
Fig. 2.

The dependence of cell length L on the adhesive force Fm at different membrane elasticity K and natural cell length L0. Parameter values are r = 1.0 Pa/μ m, K = 20 Pa/μ m, L0 = 10 μ m, and σ = 10 Pa when fixed. The dependences on r and σ are not shown because no dependence is observed as inferred from the analytical results
Persistence length
From the numerical simulations, we can find a characteristic of the persistence length. The persistence length is defined in the model as the distance by which the cell moves between direction switches. From the collection of the cell trajectories obtained by the simulations, we can construct the probability distribution of persistence length, Δx. As a result, we can see the probability distributions of Δx are well described by exponential functions denoting (Appendix E). The constant ξ gives the mean of the persistence length referred to as characteristic persistence length (CPL) in what follows.
We can analytically estimate the CPL ξ. The probability of keeping the migration direction at each time step is the probability that the adhesive force at the front is larger than the membrane tension, and therefore is estimated as . Despite the asymmetry of the probabilities of keeping and switching the migration direction at each time step, this asymmetric random walk is equivalent to the normal symmetric random walk when the long-time behavior is considered. This is because a asymmetric random walk in which the probability of keeping the direction is p and of switching the direction is 1 − p and whose step size is 1 is equivalent to the symmetric random walk whose step length is (Appendix F for the derivation). Accordingly, the CPL ξ is obtained by the substitution of given above into p here:
| 1 |
where erf represents the error function.
Figure 3 shows the CPL ξ calculated from Eq. 1. The results obtained from numerical simulations well matches this equation (Appendix D). We can see that cells migrate more persistently at stronger adhesion independently of cellular properties. Regarding other parameters, cells migrate more persistently when cells have larger polarizability r, smaller membrane elasticity K, larger natural cell length L0, and smaller adhesivity fluctuation σ.
Fig. 3.

The dependence of the characteristic persistence length (CPL) ξ on adhesive force Fm at different polarizability r, membrane elasticity K, natural cell length L0, and adhesivity fluctuation σ. Parameter values are r = 1.0 Pa/μ m, K = 20 Pa/μ m and L0 = 10 μ m, and σ = 10 Pa when fixed
Because ξ is given in terms of the error function, cells hardly switch the migration direction when . Inversely, when , cells are likely to perform a random walk of the least step size regardless of adhesive strength, as seen in the case of r = 0 (Appendix D). The persistence is sensitive to parameters when they satisfy . Note that parameter values used in the simulations — determined by means of experimental conditions— satisfy this relation.
Random motility coefficient
RMC μ of a normal random walk with step length ξ and step time τ is calculated from μ = ξ2/τ, which reads μ = Sξ in terms of speed S = ξ/τ. Although cellular random migration is often more precisely described by the persistent random walk rather than the normal random walk [77], we do not incorporate it into the model here for simplicity. As assumed in the determination of the time scale in the simulations, we use S[μ m/min] = − 0.025Fm[Pa] + 12.5 again for the relation between mean adhesive force Fm and cell speed S. By coupling this relation with ξ given by Eq. 1, the RMC is obtained.
Figure 4 shows the RMC μ. The qualitative trend depends on parameters; it shows biphasic trends when the cell has a large polarizability r, small membrane elasticity K, large natural cell length L0, and small adhesivity fluctuation σ, whereas it monotonically decreases when the cell has a small r, large K, small L0, and large σ (see also Appendix D).
Fig. 4.

The dependence of random motility coefficient (RMC) μ on adhesive force Fm at different polarizability r, membrane elasticity K, natural cell length L0, and adhesivity fluctuation σ. Parameter values are r = 1.0 Pa/μ m, K = 20 Pa/μ m, L0 = 10 μ m, and σ = 10 Pa when fixed
Durotaxis
Using the same model, we numerically observe durotaxis, i.e., the tendency of cells to move toward a stiffer region of the substrate [3, 21, 30–32]. In the calculation, we select the gradient of the substrate stiffness, h = 0.010,0.015,0.020 kPa/μ m, from an study for smooth vascular muscle cells [31], and the relation, Fm[Pa] = 20s[kPa] + 100, is used again to transform the stiffness s into the adhesivity Fm. The stiffness is set to increase in the positive direction of the x-axis. Figure 5 shows typical trajectories, where we can observe durotaxis. Cells migrate faster on average as the gradient increases.
Fig. 5.

Directed cell migration induced by substrate stiffness gradients, namely durotaxis, at three gradients: h = 0.005, 0.010, and 0.015 kPa/μ m. Other parameter values are Fm = 300 Pa, r = 1.0 Pa/μ m, K = 20 Pa/μ m, L0 = 10 μ m, and σ = 10 Pa
Migration under shear stress
Using the same model, we numerically examine the cell migration under external shear stress. Placed in fluid flow, cells adhering to substrates are exposed to shear stress and tend to migrate downstream of the flow [33, 34]. Suppose fs is the force acting on the cell surface in the positive direction of the x-axis. We assume for simplicity that the additional stress on the cell surface is localized at the edges and equally distributed. That is to say, we assume that the force exerted by the membrane at the right edge decreases to TR(t) = T(t) − fs/2 while that at the left edge increases to TL(t) = T(t) + fs/2, according to the force balance. We set fs = 1.0, 2.0 and 3.0 Pa in accordance with an experimental study for endothelial cells [33]. Figure 6 shows typical trajectories, where we can observe the migration in the direction of the shear stress. Cells migrate faster on average under larger shear stress.
Fig. 6.

Directed cell migration induced by a fluid flow providing shear stresses at three stresses: fs = 1.0, 2.0, and 3.0 Pa. Other parameter values are Fm = 300 Pa, r = 1.0 Pa/μ m, K = 20 Pa/μ m, L0 = 10 μ m, and σ = 10 Pa
Discussion
Comparison with experimental results
- Cell spreading:
The results shown in Fig. 2 are consistent with experiments in which cells spread more at stronger adhesion [78] and on stiffer substrates for neutrophils [1, 12, 13], fibroblasts [4, 5, 11, 14–16], endothelial cells [11, 26], smooth muscle cells [22–24], cardiomyocytes [25], and myoblasts [8].
- Persistence length:
In experiments, cells migrate more persistently at stronger adhesion [78] and on stiffer substrates [1, 12, 19]. This relation is seen in the result, Eq. 1 and Fig. 3. The order of magnitudes, tens of micrometers, also matches experiments for neutrophils [1, 12] as well as another cell type [19, 78].
- Random motility coefficient (RMC):
At the typical parameter values for neutrophils, r = 1.0 Pa/μ m, K = 20 Pa/μ m, L0 = 10 μ m, and σ = 10.0 Pa, the biphasic dependence of the RMC on the adhesivity is obtained (Fig. 4 and Appendix D), in line with experiments [12, 79]. These findings implies the existence of the optimal adhesivity (and therefore the optimal substrate stiffness) at which the cell can travel further. The order of the magnitude compares favorably to observations, 30–120 μ m2/min [12]. Note that the RMC can be monotonic as well depending on the cellular properties (Fig. 4 and Appendix D) and on the relation between cell speed and adhesivity (Appendix G). This qualitative variety is in agreement with experiments; while biphasic trend is observed also for other cell types [78, 80], monotonic trends are reported as well [27, 79, 81, 82].
- Migration in inhomogeneous environments:
The present model is also applied to the migration in inhomogeneous mechanical environments. The model cell exhibits durotaxis (Fig. 5), which has been demonstrated by experiments [3, 21, 30–32]. Directional migration downstream in fluid flow [33, 34] is also reproduced by the model cell subjected to shear stress (Fig. 6). The order of the speed, 0.5 μ m/min under shear stress of 1.2 Pa for endothelial cells [33], is similar to that obtained by the model. Directional migration upstream [35] is not explained only by the mechanical reasons incorporated in the present model.
Mechanism underlying the migration behavior
Taken together, we can suggest a mechanism underlying multiple cellular responses to the mechanical interaction with the substrate. Figure 7 summarizes the causal relations. For cells to spread, the plasma membrane expansion against spontaneous membrane shrinkage should be supported by the cell-substrate adhesion. Therefore, cells spread more at stronger adhesion (Fig. 2). When cell spreading is substantial, a large difference in adhesive strength between the front and rear should arise [71]. Under uniform membrane tension across the cell caused by its fast propagation [65], the large asymmetry of the adhesive strength gives rise to greater probability that the adhesion at the front is strong enough to support the force produced in the membrane protrusion, while at the rear the adhesion is weak enough to be disrupted. These tendencies facilitate persistent migration (Fig. 3). The biphasic dependence of the RMC is due to the fact that, in terms of mathematics, it is obtained by multiplication of persistence length and cell speed, which are respectively an increasing function and decreasing function. In terms of physiology, the RMC should be small at strong adhesion owing to the slow motion despite the long persistence, whereas this coefficient would be small at weak adhesion too because of frequent turning despite the fast motion. Thus, an optimal adhesive force and therefore optimal substrate stiffness can arise at which the cell can travel further. While cell spreading and persistence are explained independently of the cellular properties and therefore cell types, the general tendency is not concluded on RMC; its qualitative behavior, monotonic or biphasic, is sensitive to the functional form of the cell speed and persistence length, in other words, is sensitive to the cellular properties and therefore may vary with cell type (Fig. 4).
Fig. 7.

Causal relations generating cellular migratory behavior in response to mechanical interaction with the substrate
Some studies have reported that cell speed is biphasic with respect to substrate stiffness and therefore to adhesivity [12, 19, 23], whereas we have assumed a monotonic negative correlation between them. According to the results of the present study, it might happen in those experiments that the cell speeds were not measured precisely when the adhesion was weak. Because cell speed has often been measured by the time-lapse imaging, frequent turning at weak adhesion might cause the underestimation of the cell speed, and lead to the biphasic trend with respect to adhesivity. In fact, it is reported that the measurement of migration speed depends on the time interval of the time-lapse imaging [12]. In a recent study, a method for precise measurement is proposed [78], and shows a decrease in cell speed with increasing adhesivity. Therefore, we have assumed the negative correlation between them.
The role of the cellular properties represented by parameters can be summarized as follows. Because the asymmetry of the adhesion induces the persistence of migration, cells with greater polarizability r migrate more persistently. Because greater spreading should result in larger asymmetry in the adhesion, softer cells, i.e., cells with smaller elasticity K and cells with larger natural size L0 migrate more persistently. In addition, greater adhesivity fluctuation σ increases the chance of formation of adhesive force less than membrane tension. This prevents the membrane protrusion and reduces the persistence.
To test the above mechanism experimentally, each causal relation in Fig. 7 should be confirmed directly. That is to say, the correlations between the mean adhesivity, cell size, anisotropy of adhesivity, persistence, and migration speed should be investigated in the same experiment. In particular, to the best of the author’s knowledge, correlation between the anisotropy of the adhesivity and persistence has never been experimentally explored thus far. If the mechanism is supported, the measurement of the cellular mechanical properties represented by prameters would be informative to characterize cell types and to predict migratory activity. Particularly, two of them, polarizability r and adhesivity fluctuation σ, seem to have never been measured experimentally. They would be measurable; after obtaining the time series of the spatial distribution of the adhesive force by means of such as traction force microscopy [83], it would be doable to estimate r by finding the relation between the cell size and the difference of the adhesive strength between the front and rear. We can also estimate σ by calculating the standard deviation of the time series of the mean adhesive strength. After the estimation of these parameters, the formulas obtained in this study also can be tested.
Conclusion
In summary, we have investigated the influence of cell-substrate adhesivity on cell migration by analyzing the random migration driven by membrane tension and adhesive force. The model reproduces the experimental findings, and offers a unified picture of the emergence of multiple cellular responses induced by mechanical stimulation from the environment. Accordingly, cellular properties that may influence the migratory behavior are suggested. Because cell migration is ubiquitous and plays an important role in human health and disease, those cellular properties are expected to provide more information for physiological and pathological phenomena such as cancer cell invasiveness and metastasis, and may lead to better treatments.
Even though the model’s predictions are consistent with experiments, it has several limitations and can be extended in various ways. For example, extension to 2D or 3D space is in principle straightforward although the computation will be more complicated. Constant parameters can be regarded as variables to make the model more realistic. For example, cell speed [84] and membrane elasticity [85] are not constant during the movement, to be precise. Linear relations assumed in this study can be elaborated to derive more realistic nonlinear relations. Inclusion of the role of myosin should be another extension. Although in general incorporation of more parameters and fine-tuning of properties may improve the model’s performance, they are beyond the scope of this study and will be meaningful in the future when more experimental data become available.
Acknowledgments
The author would like to thank Dr. Shunji Hattori at Nippi Research Institute of Biomatrix for fruitful discussions.
Appendix: A
Theoretical studies referenced in the main text are those focusing on the influence of adhesivity and/or substrate stiffness on the morphology or migration behavior. To compare those studies with the present study, they are briefly reviewed in the below particularly from the viewpoint of model’s characteristics (dimension of the space, continuous or discrete, the number of parameters etc.), calculation procedure (numerical or analytical etc.), and the scope of the study (what is explored among the cell size, speed, persistence and random motility coefficient etc.).
Compared with those studies, the characteristics of the present study can be summarized as follows: The present study aims to investigate, with a single model, as many as three cellular responses, namely the cell length, persistence length, and random motility coefficient, as well as durotaxis and the response to shear stress. In the model, the cell migrates in a 1D space and is represented by its boundaries stochastically changing their positions. The number of parameters, five (Fave, r, K, L0, σ), is the least compared with those studies. Analytical calculation is fully performed to obtain the results represented by some formulae. Thanks to the formulae, we explicitly find the influence of the adhesivity (Fave) and the cellular properties (r, K, L0, σ) on the cellular responses (, ξ, μ) occurring in migration, which lead to the understanding of the mechanism underlying those responses.
The following provides the brief review.
The study [36] is a pioneering work that explores the effect of the adhesivity. The cell is described by coupled springs and dashpots moving in a 1D space. The model includes 13 parameters. The result is numerically obtained. The cell speed is explored.
In [37], the cell motion is described by three points moving in a 2D space. The dynamics is given by stochastic differential equations (SDEs). The model includes 16 parameters. The result is numerically obtained. The scope is the most similar to the present study. The cell speed, persistence and random motility coefficient are explored.
In [38], the cell is described by a continuous finite object in a 1D space. The dynamics is given by partial differential equations (PDEs). The model includes 11 parameters. The result is numerically obtained. The cell size and speed are explored.
In [39], the cell is described by a point moving in a 3D space. Its motion is provided by ordinary differential equations (ODEs). The model includes 9 parameters. The result is numerically obtained. The cell speed is explored.
In [40], the cell is described by a continuous finite object in a 3D space. The dynamics is given by PDEs. Since the PDEs are fully solved with the finite element method, any quantities would be obtained although none of them is explicitly shown. The numbers of parameters is not clearly written in the paper but should be numerous due to the model’s characteristics.
In [41], the cell is represented by the vertical cross section of the cell. The dynamics is given by PDEs. The model includes 10 parameters. While the calculation is proceeded analytically in part, the final results are obtained numerically by solving a system of algebraic equations. The cell speed is explored.
In [42], the cell is described by 95 nodes connected by springs and dashpots placed in a 2D space. Its motion is given by ODEs. The model includes 11 parameters. The results are numerically obtained. The cell speed and cell size are explored in addition to durotaxis.
In [43], the cell is described by an elastic element moving in a 3D space. Its motion is given by ODEs. The model includes 20 parameters. The results are numerically obtained. The effects of substrate stiffness on the traction force and cell speed are explored.
In [44], the cell and substrate are described by continuous substance in a 2D space. The finite element method is used to obtain the result. The model includes 11 parameters. The effects of substrate stiffness on the traction force and cell speed are explored.
In [45], the cell is described by a point in a 1D space. The intracellular processes are provided in detail to determine the motion. The dynamics is given by ODEs. The model includes 25 parameters. The results are numerically obtained. The cell speed is explored.
In [46], the cell is described by a continuous viscoelastic substance in a 1D space. The dynamics is given by PDEs. The model includes 8 parameters. The results are numerically obtained. The effects of the substrate stiffness on the traction force and cell speed are explored.
In [47], the cell is described by a phase field in a 2D space. The dynamics is given by PDEs. The model includes 24 parameters. The results are numerically obtained. The cell morphology is explored.
In [48], the cell is described by a point moving on a 2D space where matrix fibers are distributed. The dynamics is given by ODEs. The model includes 7 parameters. The results are numerically obtained. The effects of the substrate stiffness on the cell speed and persistence are explored as well as durotaxis.
In [49], the cell is described by a continuous active gel in a 1D space. The dynamics is given by PDEs. The model includes 7 parameters. While analytical calculation is performed to understand whether spontaneous movement will occur or not, the cell speed is obtained numerically.
In [50], the boundary of the cell is considered in a 2D space. Time evolution of the cell’s position is not calculated. Instead, the relations between the substrate stiffness, the cell shape and the anisotropy of the adhesive force are explored for the fixed cell. The model includes 14 parameters. The results are numerically obtained.
In [51], the cell is described by a continuous substance in a 2D space. The dynamics is given by PDEs. The model includes 23 parameters. The effect of the substrate stiffness on the cell spreading is explored.
In [52], the cell is described by two points representing the left edge and right edge in a 1D space, which is similar to the present model. The two points are connected with a spring, a dashpot and an active actuator. Periodic motion induced by the periodic attachment and detachment of the adhesion are assumed. The model includes 8 parameters. The result is numerically obtained. The influence of the phase differences of the periodic behavior on the cell velocity is explored.
In [53], 2D cross-section of the cell is considered and represented by a phase field. The dynamics is given by PDEs. The model includes 12 parameters. Results are obtained numerically except for some specific cell forms. The cell speed is explored.
Appendix: B
In the model, for simplicity, the cell is assumed to always switch the migration direction when adhesive force ff is less than membrane tension T, i.e., ff < T. Here, we consider a case where the switching does not always occur. In this case, we should analyze a random walk in which three actions are possible at each time step: 1) the cell keeps the migration direction and moves forward by unit length with probability p, 2) the cell is stationary, i.e., neither moves forward nor switches the migration direction with probability q, and 3) the cell switches the migration direction with probability r. Then the probability of migration forward without switching the migration direction is given by . Inversely, the probability of switching the migration direction without migrating forward is given by . Since p + q + r = 1 is satisfied, the ratio of the probability of migrating forward to the probability of switching the migration direction is equal to the ratio that does not involve the probability of the stationary state. Thus, the persistence length calculated in the main text does not change if we assume that switching of the migration direction does not always occur under the condition ff < T.
Appendix: C
Figure 8 shows representative cell trajectories obtained by numerical simulations for three values of mean adhesive force Fm. The cell tends to migrate persistently when it adheres strongly. This figure also shows the time evolution of cell length L(t). After a short period, the cell length reaches an equilibrium state in all cases.
Fig. 8.

Typical time evolutions of the position of the cell’s left edge (red) and right edge (blue) and the cell length (yellow) at three adhesivities: Fm = 200, 300, and 400 Pa. Stronger adhesion induces higher persistence and larger cell spreading. Other parameter values are r = 1.0 Pa/μ m, K = 20 Pa/μ m, L0 = 10 μ m, and σ = 10 Pa
Appendix: D
The analytical results derived in the main text and simulation results are compared under a specific combination of parameter values. Figure 9 shows the cell length L. The analytical results well describe the numerical results. Figure 10 shows the characteristic persistence length (CPL) ξ. Analytical results well describe numerical results. Comparison of the random motility coefficients (RMC) μ is not shown since it is proportional to CPL. We can notice a tendency that CPLs obtained numerically are a little smaller than the analytical one. The reason is, since the number of the samples of the simulation is finite, the probability distributions of the persistence length have to be truncated, and therefore the CPL estimated by simulation is smaller than that calculated from the formula obtained by the analysis.
Fig. 9.

The dependence of the cell length L on the adhesive force Fm at different membrane elasticity K and natural cell length L0. Points and lines are respectively obtained from the numerical simulation and the analysis. Error bars representing the standard deviation are short and invisible. Parameter values are r = 1.0 Pa/μ m, K = 20 Pa/μ m, L0 = 10 μ m, and σ = 10 Pa when fixed. The dependences on r and σ are not shown because no dependence is observed as inferred from the analytical results
Fig. 10.

The dependence of the characteristic persistence length (CPL) ξ on the adhesive force Fm at different polarizability r, membrane elasticity K, natural cell length L0, and adhesivity fluctuation σ. Points and lines are respectively obtained from the numerical simulation and the analysis. Error bars represent the standard deviations. Parameter values are r = 1.0 Pa/μ m, K = 20 Pa/μ m, L0 = 10 μ m, and σ = 10 Pa when fixed
Appendix: E
Figure 11 shows the probability distribution of persistence length Δx, the distance by which the cell moves between direction switches, constructed from the trajectories obtained in numerical simulations. Typical results for three values of adhesive force Fm are shown. All of them are described well by exponential functions, , where ξ a parameter referred to as characteristic persistence length.
Fig. 11.
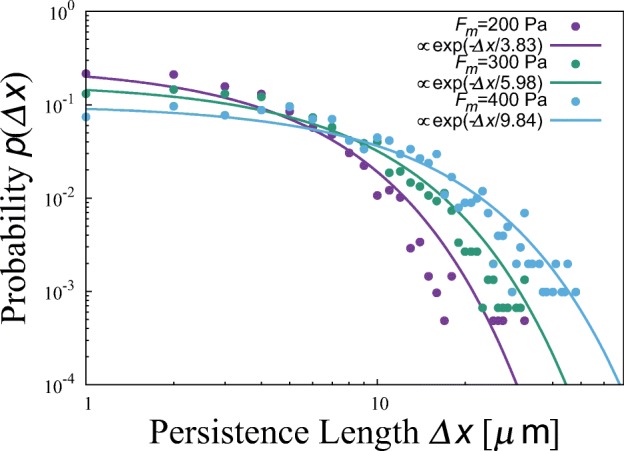
Probability distributions of persistence length Δx obtained by numerical simulations at three adhesivities: Fm = 200, 300, and 400 Pa. Other parameter values are r = 1.0 Pa/μ m, K = 20 Pa/μ m, L0 = 10 μ m, and σ = 10 Pa. All of them are well described by exponential functions, exp(-Δx/ξ), whose characteristic persistence lengths (CPL) ξ are 3.83, 5.98, 9.84 μ m
Appendix: F
Let us consider a random walk in which the probability of keeping the migration direction is p and the probability of switching the the migration direction is 1 − p. Let N be the number of steps immediately after which the probability of keeping the same migration direction becomes 1/2. Then N satisfies pN = 1/2, which reads . This means that the probability of keeping the migration direction for sequential N times is 1/2. As a result of this keeping the direction of N times, the distance by which the walker moves is Nξ where ξ denotes the step size of this random walk. Thus, as far as, we focus on the long-time behavior, this asymmetric random walk is equivalent to the symmetric random walk whose unit length is given by .
Appendix: G
Although the random motility coefficient shows a biphasic or monotonically decreasing dependence on increasing adhesive force in the main text, it also manifests an increasing dependence even when we slightly change the relation between adhesive force and cell speed. For example, when we use given in Fig. 12 instead of S[μ m/min] = − 0.025Fm[Pa] + 12.5 used in the main text, a monotonically increasing dependence is observed when r is large, K is small, and σ is small (Fig. 13).
Fig. 12.
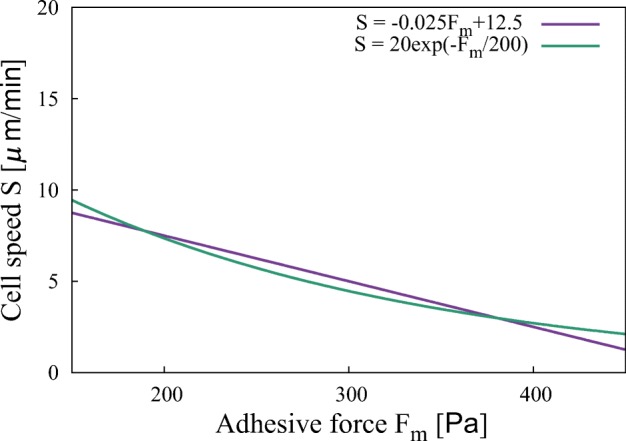
Two functions for cell speed that produce qualitatively different random motility coefficients. The linear function (violet line) results in Fig. 4 in the main text. The exponential function (green line) leads to Fig. 13
Fig. 13.

The dependence of random motility coefficient on mean adhesive force Fm at different values of polarizability r, membrane elasticity K, natural cell length L0, and adhesion fluctuation σ when an exponential function is used to describe the cell speed. Parameter values are r = 1.0 Pa/μ m, K = 20 Pa/μ m, L0 = 10 μ m, and σ = 10 Pa when fixed
Funding information
This work was financially supported by JSPS KAKENHI Grant Number 26800208.
Compliance with ethical standards
Conflict of interest
The author declares that he has no conflict of interest.
Footnotes
Publisher’s note
Springer Nature remains neutral with regard to jurisdictional claims in published maps and institutional affiliations.
References
- 1.Oakes PW, Patel DC, Morin NA, Zitterbart DP, Fabry B, Reichner JS, Tang JX. Neutrophil morphology and migration are affected by substrate elasticity. Blood. 2009;114:1387–1395. doi: 10.1182/blood-2008-11-191445. [DOI] [PMC free article] [PubMed] [Google Scholar]
- 2.Jannat RA, Dembo M, Hammer DA. Traction forces of neutrophils migrating on compliant substrates. Biophys. J. 2011;101:575–584. doi: 10.1016/j.bpj.2011.05.040. [DOI] [PMC free article] [PubMed] [Google Scholar]
- 3.Lo CM, Wang HB, Dembo M, Wang YL. Cell movement is guided by the rigidity of the substrate. Biophys. J. 2000;79:144–152. doi: 10.1016/S0006-3495(00)76279-5. [DOI] [PMC free article] [PubMed] [Google Scholar]
- 4.Wang HB, Dembo M, Wang YL. Substrate flexibility regulates growth and apoptosis of normal but not transformed cells. Am. J. Physiol. Cell Physiol. 2000;279:C1345–C1350. doi: 10.1152/ajpcell.2000.279.5.C1345. [DOI] [PubMed] [Google Scholar]
- 5.Paszek MJ, Zahir N, Johnson KR, Lakins JN, Rozenberg GI, Gefen A, Reinhart-King CA, Margulies SS, Dembo M, Boettiger D, Hammer DA, Weaver VM. Tensional homeostasis and the malignant phenotype. Cancer Cell. 2005;8:241–254. doi: 10.1016/j.ccr.2005.08.010. [DOI] [PubMed] [Google Scholar]
- 6.Guo WH, Frey MT, Burnham NA, Wang YL. Substrate rigidity regulates the formation and maintenance of tissues. Biophys. J. 2006;90:2213–2220. doi: 10.1529/biophysj.105.070144. [DOI] [PMC free article] [PubMed] [Google Scholar]
- 7.Ghosh K, Pan Z, Guan E, Ge S, Liu Y, Nakamura T, Ren XD, Rafailovich M, Clark RAF. Cell adaptation to a physiologically relevant ECM mimic with different viscoelastic properties. Biomaterials. 2007;28:671–679. doi: 10.1016/j.biomaterials.2006.09.038. [DOI] [PMC free article] [PubMed] [Google Scholar]
- 8.Engler AJ, Griffin MA, Sen S, Bönnemann CG, Sweeney HL, Discher DE. Myotubes differentiate optimally on substrates with tissue-like stiffness: Pathological implications for soft or stiff microenvironments. J. Cell Biol. 2004;166:877–887. doi: 10.1083/jcb.200405004. [DOI] [PMC free article] [PubMed] [Google Scholar]
- 9.Mitrossilis D, Fouchard J, Guiroy A, Desprat N, Rodriguez N, Fabry B, Asnacios A. Single-cell response to stiffness exhibits muscle-like behavior. Proc. Natl. Acad. Sci. USA. 2009;106:18243–18248. doi: 10.1073/pnas.0903994106. [DOI] [PMC free article] [PubMed] [Google Scholar]
- 10.Chan CE, Odde DJ. Traction dynamics of filopodia on compliant substrates. Science. 2008;322:1687–1691. doi: 10.1126/science.1163595. [DOI] [PubMed] [Google Scholar]
- 11.Yeung T, Georges PC, Flanagan LA, Marg B, Ortiz M, Funaki M, Zahir N, Ming W, Weaver V, Janmey PA. Effects of substrate stiffness on cell morphology, cytoskeletal structure, and adhesion. Cell Motil. Cytoskeleton. 2005;60:24–34. doi: 10.1002/cm.20041. [DOI] [PubMed] [Google Scholar]
- 12.Stroka KM, Aranda-Espinoza H. Neutrophils display biphasic relationship between migration and substrate stiffness. Cell Motil. Cytoskeleton. 2009;66:328–341. doi: 10.1002/cm.20363. [DOI] [PubMed] [Google Scholar]
- 13.Jannat RA, Robbins GP, Ricart BG, Dembo M, Hammer DA. Neutrophil adhesion and chemotaxis depend on substrate mechanics. J. Phys.: Condens. Matter. 2010;22:194117. doi: 10.1088/0953-8984/22/19/194117. [DOI] [PMC free article] [PubMed] [Google Scholar]
- 14.Pelham RJJr, Wang YL. Cell locomotion and focal adhesions are regulated by substrate flexibility. Proc. Natl. Acad. Sci. USA. 1997;94:13661–13665. doi: 10.1073/pnas.94.25.13661. [DOI] [PMC free article] [PubMed] [Google Scholar]
- 15.Jiang G, Huang AH, Cai Y, Tanase M, Sheetz MP. Rigidity sensing at the leading edge through ανβ3 integrins and RPTPα. Biophys. J. 2006;90:1804–1809. doi: 10.1529/biophysj.105.072462. [DOI] [PMC free article] [PubMed] [Google Scholar]
- 16.Solon J, Levental I, Sengupta K, Georges PC, Janmey PA. Fibroblast adaptation and stiffness matching to soft elastic substrates. Biophys. J. 2007;93:4453–4461. doi: 10.1529/biophysj.106.101386. [DOI] [PMC free article] [PubMed] [Google Scholar]
- 17.Tzvetkova-Chevolleau T, Steṕhanou A, Fuard D, Ohayon J, Schiavone P, Tracqui P. The motility of normal and cancer cells in response to the combined influence of the substrate rigidity and anisotropic microstructure. Biomaterials. 2008;29:1541–1551. doi: 10.1016/j.biomaterials.2007.12.016. [DOI] [PubMed] [Google Scholar]
- 18.Lovett DB, Shekhar N, Nickerson JA, Roux KJ, Lele TP. Modulation of nuclear shape by substrate rigidity. Cell Mol. Bioeng. 2013;6:230–238. doi: 10.1007/s12195-013-0270-2. [DOI] [PMC free article] [PubMed] [Google Scholar]
- 19.Kim DH, Wirtz D. Focal adhesion size uniquely predicts cell migration. FASEB J. 2013;27:1351–1361. doi: 10.1096/fj.12-220160. [DOI] [PMC free article] [PubMed] [Google Scholar]
- 20.Oakes PW, Bidone TC, Beckham Y, Skeeters AV, Ramirez-San Juan GR, Winter SP, Voth GA, Gardel ML. Lamellipodium is a myosin-independent mechanosensor. Proc. Natl. Acad. Sci. USA. 2018;115:2646–2651. doi: 10.1073/pnas.1715869115. [DOI] [PMC free article] [PubMed] [Google Scholar]
- 21.Wong JY, Velasco WJ, Rajagopalan A, Pham Q. Directed movement of vascular smooth muscle cells on gradient-compliant hydrogels. Langmuir. 2003;19:1908–1913. [Google Scholar]
- 22.Engler A, Bacakova L, Newman C, Hategan A, Griffin M, Discher D. Substrate compliance versus ligand density in cell on gel responses. Biophys. J. 2004;86:617–628. doi: 10.1016/S0006-3495(04)74140-5. [DOI] [PMC free article] [PubMed] [Google Scholar]
- 23.Peyton SR, Putnam AJ. Extracellular matrix rigidity governs smooth muscle cell motility in a biphasic fashion. J. Cell Physiol. 2005;204:198–209. doi: 10.1002/jcp.20274. [DOI] [PubMed] [Google Scholar]
- 24.Peyton SR, Raub CB, Keschrumrus VP, Putnam AJ. The use of poly(ethylene glycol) hydrogels to investigate the impact of ECM chemistry and mechanics on smooth muscle cells. Biomaterials. 2006;27:4881–4893. doi: 10.1016/j.biomaterials.2006.05.012. [DOI] [PubMed] [Google Scholar]
- 25.Engler AJ, Carag-Krieger C, Johnson CP, Raab M, Tang HY, Speicher DW, Sanger JW, Sanger JM, Discher DE. Embryonic cardiomyocytes beat best on a matrix with heart-like elasticity: scar-like rigidity inhibits beating. J. Cell Sci. 2008;121:3794–3802. doi: 10.1242/jcs.029678. [DOI] [PMC free article] [PubMed] [Google Scholar]
- 26.Califano JP, Reinhart-King CA. A balance of substrate mechanics and matrix chemistry regulates endothelial cell network assembly. Cell Mol. Bioeng. 2008;1:122–132. [Google Scholar]
- 27.Reinhart-King CA, Dembo M, Hammer DA. Cell-cell mechanical communication through compliant substrates. Biophys. J. 2008;95:6044–6051. doi: 10.1529/biophysj.107.127662. [DOI] [PMC free article] [PubMed] [Google Scholar]
- 28.Discher DE, Janmey P, Wang YL. Tissue cells feel and respond to the stiffness of their substrate. Science. 2005;310:1139–1143. doi: 10.1126/science.1116995. [DOI] [PubMed] [Google Scholar]
- 29.Nemir S, West JL. Synthetic materials in the study of cell response to substrate rigidity. Ann. Biomed. Eng. 2010;38:2–20. doi: 10.1007/s10439-009-9811-1. [DOI] [PubMed] [Google Scholar]
- 30.Gray DS, Tien J, Chen CS. Repositioning of cells by mechanotaxis on surfaces with micropatterned Young’ modulus. J. Biomed. Mater. Res. 2003;66A:605–614. doi: 10.1002/jbm.a.10585. [DOI] [PubMed] [Google Scholar]
- 31.Isenberg BC, DiMilla PA, Walker M, Kim S, Wong JY. Vascular smooth muscle cell durotaxis depends on substrate stiffness gradient strength. Biophys. J. 2009;97:1313–1322. doi: 10.1016/j.bpj.2009.06.021. [DOI] [PMC free article] [PubMed] [Google Scholar]
- 32.Hadjipanayi E, Mudera V, Brown RA. Guiding cell migration in 3D: A collagen matrix with graded directional stiffness. Cell Motil. Cytoskeleton. 2009;66:121–128. doi: 10.1002/cm.20331. [DOI] [PubMed] [Google Scholar]
- 33.Li S, Butler P, Wang Y, Hu Y, Han DC, Usami S, Guan JL, Chien S. The role of the dynamics of focal adhesion kinase in the mechanotaxis of endothelial cells. Proc. Natl. Acad. Sci. USA. 2002;99:3546–3551. doi: 10.1073/pnas.052018099. [DOI] [PMC free article] [PubMed] [Google Scholar]
- 34.Riehl BD, Lee JS, Ha L, Lim JY. Fluid-flow-induced mesenchymal stem cell migration: Role of focal adhesion kinase and RhoA kinase sensors. J. R. Soc. Interface. 2015;12:20141351. doi: 10.1098/rsif.2014.1351. [DOI] [PMC free article] [PubMed] [Google Scholar]
- 35.Valignat M-P, Neg̀re P, Cadra S, Lellouch AC, Gallet F, Heńon S, Theodoly O. Lymphocytes can self-steer passively with wind vane uropods. Nat. Comm. 2014;5:5213. doi: 10.1038/ncomms6213. [DOI] [PubMed] [Google Scholar]
- 36.DiMilla PA, Barbee K, Lauffenburger DA. Mathematical model for the effects of adhesion and mechanics on cell migration speed. Biophys. J. 1991;60:15–37. doi: 10.1016/S0006-3495(91)82027-6. [DOI] [PMC free article] [PubMed] [Google Scholar]
- 37.Dickinson RB, Tranquillo RT. A stochastic model for adhesion-mediated cell random motility and haptotaxis. J. Math. Biol. 1993;31:563–600. doi: 10.1007/BF00161199. [DOI] [PubMed] [Google Scholar]
- 38.Gracheva ME, Othmer HG. A continuum model of motility in ameboid cells. Bul. Math. Biol. 2004;66:167–193. doi: 10.1016/j.bulm.2003.08.007. [DOI] [PubMed] [Google Scholar]
- 39.Zaman MH, Kamm RD, Matsudaira P, Lauffenburger DA. Computational model for cell migration in three-dimensional matrices. Biophys. J. 2005;89:1389–1397. doi: 10.1529/biophysj.105.060723. [DOI] [PMC free article] [PubMed] [Google Scholar]
- 40.Liu WK, Liu Y, Farrell D, Zhang L, Wang XS, Fukui Y, Patankar N, Zhang Y, Bajaj C, Lee J, Hong J, Chen X, Hsu H. Immersed finite element method and its applications to biological systems. Comput. Methods Appl. Mech. Eng. 2006;195:1722–1749. doi: 10.1016/j.cma.2005.05.049. [DOI] [PMC free article] [PubMed] [Google Scholar]
- 41.Lin Y. A model of cell motility leading to biphasic dependence of transport speed on adhesive strength. J. Mech. Phys. Solids. 2010;58:502–514. [Google Scholar]
- 42.Dokukina IV, Gracheva ME. A model of fibroblast motility on substrates with different rigidities. Biophys. J. 2010;98:2794–2803. doi: 10.1016/j.bpj.2010.03.026. [DOI] [PMC free article] [PubMed] [Google Scholar]
- 43.Borau C, Kamm RD, García-Aznar JM. Mechano-sensing and cell migration: A 3D model approach. Phys. Biol. 2011;8:066008. doi: 10.1088/1478-3975/8/6/066008. [DOI] [PubMed] [Google Scholar]
- 44.Wong HC, Tang WC. Finite element analysis of the effects of focal adhesion mechanical properties and substrate stiffness on cell migration. J. Biomech. 2011;44:1046–1050. doi: 10.1016/j.jbiomech.2011.02.004. [DOI] [PubMed] [Google Scholar]
- 45.Pathak A, Kumar S. From molecular signal activation to locomotion: An integrated, multiscale analysis of cell motility on defined matrices. PLoS ONE. 2011;6:e18423. doi: 10.1371/journal.pone.0018423. [DOI] [PMC free article] [PubMed] [Google Scholar]
- 46.Sarvestani AS. A model for cell motility on soft bio-adhesive substrates. J. Biomech. 2011;44:755–758. doi: 10.1016/j.jbiomech.2010.11.012. [DOI] [PubMed] [Google Scholar]
- 47.Shao D, Levine H, Rappel W-J. Coupling actin flow, adhesion, and morphology in a computational cell motility model. Proc. Natl. Acad. Sci. USA. 2012;109:6851–6856. doi: 10.1073/pnas.1203252109. [DOI] [PMC free article] [PubMed] [Google Scholar]
- 48.Schlüter DK, Ramis-Conde I, Chaplain MAJ. Computational modeling of single-cell migration: The leading role of extracellular matrix fibers. Biophys. J. 2012;103:1141–1151. doi: 10.1016/j.bpj.2012.07.048. [DOI] [PMC free article] [PubMed] [Google Scholar]
- 49.Callan-Jones AC, Voituriez R. Active gel model of amoeboid cell motility. New J. Phys. 2013;15:025022. [Google Scholar]
- 50.Zhong Y, Ji B. Impact of cell shape on cell migration behavior on elastic substrate. Biofabrication. 2013;5:015011. doi: 10.1088/1758-5082/5/1/015011. [DOI] [PubMed] [Google Scholar]
- 51.Vernerey FJ, Farsad M. A mathematical model of the coupled mechanisms of cell adhesion, contraction and spreading. J. Math. Biol. 2014;68:989–1022. doi: 10.1007/s00285-013-0656-8. [DOI] [PMC free article] [PubMed] [Google Scholar]
- 52.Tarama M, Yamamoto R. Mechanics of cell crawling by means of force-free cyclic motion. J. Phys. Soc. Jpn. 2018;87:044803. [Google Scholar]
- 53.Cao Y, Karmakar R, Ghabache E, Gutierrez E, Zhao Y, Groisman A, Levine H, Camleyd BA, Rappel W-J. Cell motility dependence on adhesive wetting. Soft Matter. 2019;15:2043. doi: 10.1039/c8sm01832d. [DOI] [PubMed] [Google Scholar]
- 54.Flaherty B, McGarry JP, McHugh PE. Mathematical models of cell motility. Cell Biochem. Biophys. 2007;49:14–28. doi: 10.1007/s12013-007-0045-2. [DOI] [PubMed] [Google Scholar]
- 55.Holmes WR, Edelstein-Keshet L. A comparison of computational models for eukaryotic cell shape and motility. PLoS Comput. Biol. 2012;8:e1002793. doi: 10.1371/journal.pcbi.1002793. [DOI] [PMC free article] [PubMed] [Google Scholar]
- 56.Shi C, Huang C-H, Devreotes PN, Iglesias PA. Interaction of motility, directional sensing, and polarity modules recreates the behaviors of chemotaxing cells. PLoS Comput. Biol. 2013;9:e1003122. doi: 10.1371/journal.pcbi.1003122. [DOI] [PMC free article] [PubMed] [Google Scholar]
- 57.Danuser G, Allard J, Mogilner A. Mathematical modeling of eukaryotic cell migration: Insights beyond experiments. Annu. Rev. Cell Dev. Biol. 2013;29:501–28. doi: 10.1146/annurev-cellbio-101512-122308. [DOI] [PMC free article] [PubMed] [Google Scholar]
- 58.Ziebert F, Aranson IS. Computational approaches to substrate-based cell motility. Npj Comput. Mater. 2016;2:16019. [Google Scholar]
- 59.Lauffenburger DA, Horwitz AF. Cell migration: A physically integrated molecular process. Cell. 1996;84:359–69. doi: 10.1016/s0092-8674(00)81280-5. [DOI] [PubMed] [Google Scholar]
- 60.Gardel ML, Schneider IC, Aratyn-Schaus Y, Waterman CM. Mechanical Integration of Actin and Adhesion Dynamics in Cell Migration. Annu. Rev. Cell Dev. Biol. 2010;26:315–33. doi: 10.1146/annurev.cellbio.011209.122036. [DOI] [PMC free article] [PubMed] [Google Scholar]
- 61.Takagi H, Sato MJ, Yanagida T, Ueda M. Functional analysis of spontaneous cell movement under different physiological conditions. PLoS ONE. 2008;3:e2648. doi: 10.1371/journal.pone.0002648. [DOI] [PMC free article] [PubMed] [Google Scholar]
- 62.Huda S, Weigelin B, Wolf K, Tretiakov KV, Polev K, Wilk G, Iwasa M, Emami FS, Narojczyk JW, Banaszak M, Soh S, Pilans D, Vahid A, Makurath M, Friedl P, Borisy GG, Kandere-Grzybowska K, Grzybowski BA. Lévy-like movement patterns of metastatic cancercells revealed in microfabricated systems andimplicated in vivo. Nat. Comm. 2018;9:4539. doi: 10.1038/s41467-018-06563-w. [DOI] [PMC free article] [PubMed] [Google Scholar]
- 63.Stroka KM, Gu Z, Sun SX, Konstantopoulos K. Bioengineering paradigms for cell migration in confined microenvironment. Curr. Opin. Cell. Biol. 2014;30:41–50. doi: 10.1016/j.ceb.2014.06.001. [DOI] [PMC free article] [PubMed] [Google Scholar]
- 64.Pathak A, Kumar S. Independent regulation of tumor cell migration by matrix stiffness and confinement. Proc. Natl. Acad. Sci. USA. 2012;109:10334–10339. doi: 10.1073/pnas.1118073109. [DOI] [PMC free article] [PubMed] [Google Scholar]
- 65.Diz-Munõz A, Fletcher DA, Weiner OD. Use the force: Membrane tension as an organizer of cell shape and motility. Trends Cell Biol. 2013;23:47–53. doi: 10.1016/j.tcb.2012.09.006. [DOI] [PMC free article] [PubMed] [Google Scholar]
- 66.Houk AR, Jilkine A, Mejean CO, Boltyanskiy R, Dufresne ER, Angenent SB, Altschuler SJ, Wu LF, Weiner OD. Membrane tension maintains cell polarity by confining signals to the leading edge during neutrophil migration. Cell. 2012;148:175–188. doi: 10.1016/j.cell.2011.10.050. [DOI] [PMC free article] [PubMed] [Google Scholar]
- 67.Ji L, Lim M, Danuser G. Fluctuations of intracellular forces during cell protrusion. Nat. Cell Biol. 2008;10:1393–1400. doi: 10.1038/ncb1797. [DOI] [PMC free article] [PubMed] [Google Scholar]
- 68.Keren K. Cell motility: The integrating role of the plasma membrane. Eur. Biophys. J. 2011;40:1013–1027. doi: 10.1007/s00249-011-0741-0. [DOI] [PMC free article] [PubMed] [Google Scholar]
- 69.Dembo M, Wang YL. Stresses at the cell-to-substrate interface during locomotion of fibroblasts. Biophys. J. 1999;76:2307–2316. doi: 10.1016/S0006-3495(99)77386-8. [DOI] [PMC free article] [PubMed] [Google Scholar]
- 70.Goehring NW, Grill SW. Cell polarity: Mechanochemical patterning. Trend Cell Biol. 2012;23:72–80. doi: 10.1016/j.tcb.2012.10.009. [DOI] [PubMed] [Google Scholar]
- 71.Jilkine A, Edelstein-Keshet L. A comparison of mathematical models for polarization of single eukaryotic cells in response to guided cues. PLoS Comput. Biol. 2011;7:e1001121. doi: 10.1371/journal.pcbi.1001121. [DOI] [PMC free article] [PubMed] [Google Scholar]
- 72.Plotnikov SV, Pasapera AM, Sabass B, Waterman CM. Force fluctuations within focal adhesions mediate ECM-rigidity sensing to guide directed cell migration. Cell. 2012;151:1513–1527. doi: 10.1016/j.cell.2012.11.034. [DOI] [PMC free article] [PubMed] [Google Scholar]
- 73.Lozanne AD, Spudich JA. Disruption of the Dictyostelium myosin heavy chain gene by homologous recombination. Science. 1987;236:1086–1091. doi: 10.1126/science.3576222. [DOI] [PubMed] [Google Scholar]
- 74.Spudich JA. One path to understanding energy transduction in biological systems. Nat. Med. 2012;18:1478–1482. doi: 10.1038/nm.2924. [DOI] [PMC free article] [PubMed] [Google Scholar]
- 75.Nagel Oliver, Guven Can, Theves Matthias, Driscoll Meghan, Losert Wolfgang, Beta Carsten. Geometry-Driven Polarity in Motile Amoeboid Cells. PLoS ONE. 2014;9(12):e113382. doi: 10.1371/journal.pone.0113382. [DOI] [PMC free article] [PubMed] [Google Scholar]
- 76.Gov NS. Traction forces during collective cell motion. HFSP J. 2009;3:223–227. doi: 10.2976/1.3185785. [DOI] [PMC free article] [PubMed] [Google Scholar]
- 77.Stokes CL, Lauffenburger DA, Williams SK. Migration of individual microvessel endothelial cells: Stochastic model and parameter measurement. J. Cell Sci. 1991;99:419–430. doi: 10.1242/jcs.99.2.419. [DOI] [PubMed] [Google Scholar]
- 78.Liu YJ, Berre ML, Lautenschlaeger F, Maiuri P, Callan-Jones A, Heuzé M, Takaki T, Voituriez R, Piel M. Confinement and low adhesion induce fast amoeboid migration of slow mesenchymal cells. Cell. 2015;160:659–672. doi: 10.1016/j.cell.2015.01.007. [DOI] [PubMed] [Google Scholar]
- 79.Kuntz RM, Saltzman WM. Neutrophil motility in extracellular matrix gels: Mesh size and adhesion affect speed of migration. Biophys. J. 1997;72:1472. doi: 10.1016/S0006-3495(97)78793-9. [DOI] [PMC free article] [PubMed] [Google Scholar]
- 80.Wacker BK, Alford SK, Scott EA, Thakur MD, Longmore GD, Elbert DL. Endothelial cell migration on RGD-peptide-containing PEG hydrogels in the presence of sphingosine 1-phosphate. Biophys. J. 2008;94:273. doi: 10.1529/biophysj.107.109074. [DOI] [PMC free article] [PubMed] [Google Scholar]
- 81.Wu P, Hoying JB, Williams SK, Kozikowski BA, Lauffenburger DA. Integrin-binding peptide in solution inhibits or enhances endothelial cell migration, predictably from cell adhesion. Ann. Biochem. Eng. 1994;22:144. doi: 10.1007/BF02390372. [DOI] [PubMed] [Google Scholar]
- 82.Bergman AJ, Zygourakis K. Migration of lymphocytes on fibronectin-coated surfaces: temporal evolution of migratory parameters. Biomaterials. 1999;20:2235. doi: 10.1016/s0142-9612(99)00154-4. [DOI] [PubMed] [Google Scholar]
- 83.Harris AK, Wild P, Stopak D. Silicone rubber substrata: A new wrinkle in the study of cell locomotion. Science. 1980;208:177. doi: 10.1126/science.6987736. [DOI] [PubMed] [Google Scholar]
- 84.Maiuri P, Rupprecht JF, Wieser S, Ruprecht V, Bénichou O, Carpi M, Coppey M, Beco SD, Gov N, Heisenberg CP, Crespo CL, Lautenschlaeger F, Berre ML, Lennon-Dumenil AM, Raab M, Thiam HR, Piel M, Sixt M, Voituriez R. Actin flows mediate a universal coupling between cell speed and cell persistence. Cell. 2015;161:374–386. doi: 10.1016/j.cell.2015.01.056. [DOI] [PubMed] [Google Scholar]
- 85.Gauthier NC, Masters TA, Sheetz MP. Mechanical feedback between membrane tension and dynamics. Trend Cell Biol. 2012;22:527. doi: 10.1016/j.tcb.2012.07.005. [DOI] [PubMed] [Google Scholar]