Abstract
Histone post-translational modifications (PTMs) are essential for regulating chromatin and maintaining gene expression throughout cell differentiation. Despite the deep level of understanding of immunophenotypic differentiation pathway in hematopoietic cells, few studies have investigated global levels of histone PTMs required for differentiation and maintenance of these distinct cell types. Here, we describe an approach to couple fluorescence-activated cell sorting (FACS) with targeted mass spectrometry to define a global “epi-proteomic” signatures for primary leukocytes. FACS was used to sort closely and distantly related leukocytes from normal human peripheral blood for quantitation of histone PTMs with a multiple reaction monitoring LC-MS/MS method measuring histone PTMs on histones H3 and H4. We validate cell sorting directly into H2SO4 for immediate histone extraction to decrease time and number of steps after FACS to analyze histone PTMs. Relative histone PTM levels vary in T cells across healthy donors and the majority of PTMs remain stable up to two days following initial blood draw. Large differences in the levels of histone PTMs are observed across the mature lymphoid and myeloid lineages, as well as between different types within the same lineage, though no differences are observed in closely-related T cell subtypes. The results show a streamlined approach for quantifying global changes in histone PTMs in cell types separated by FACS that is poised for clinical deployment.
Keywords: Histones, post-translation modifications, fluorescence-activated cell sorting, proteomics, targeted LC-MS/MS
Graphical Abstract
Introduction
Fluorescence-activated cell sorting (FACS) is a flow cytometric approach that capitalizes on combinations of defined cell surface and/or intracellular markers to discriminate subtypes, allowing for isolation of cells based on the presence and level of antigen expression. This technique is widely used in both basic and clinical immunology and is routinely used to isolate distinct subpopulations of immune cells for downstream analysis of the genetic landscape through next-generation genomic technologies [1–3]. Despite arising from a common progenitor, leukocyte subsets in peripheral blood exhibit distinct gene expression signatures between the myeloid and lymphoid lineages [4], as well as the between cells further down the differentiation pathway [5, 6]. The drastic differences in gene expression are closely regulated by transcriptional programs which exert control over the differentiation process by regulating chromatin and histone post-translational modifications (PTMs).
Despite the significance of histone PTMs in regulating gene expression, little is known about the levels and changes in these PTMs during normal hematopoiesis. Previous studies in T cells have identified locus-specific changes in histone PTMs that facilitate the expression of certain cytokines or transcription factors associated with differentiation [7, 8]. In more recent work, ChIP-Seq has been used to tie histone PTMs to loci specific for each subtype [9, 10]. While these data have provided new information into the differentiation and regulation of T cells, an understanding of the global difference in histone PTMs across immune cell types could offer deeper insights into the underlying biology and be useful for clinical applications, such as assessing the response of an individual to epigenetic-modifying drugs such as the DOT1L inhibitor, pinometostat [11], the EZH2 inhibitor, tazemetostat [12, 13].
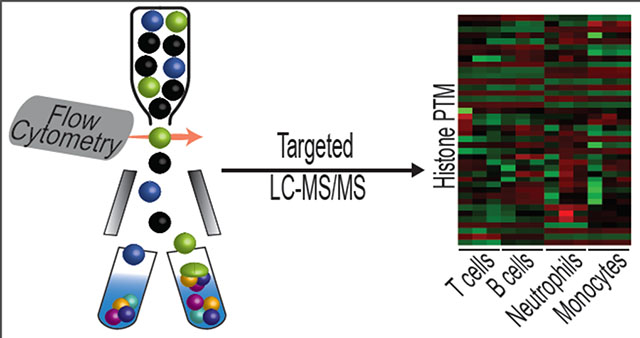
With the emergence of drugs targeting epigenetic-modifying enzymes, more precise techniques are needed to assess the resulting changes in histone PTMs. Antibody-based detections, such as western blot, have traditionally be used, but the growing issues surrounding lack of specificity and reproducibility of commercial antibodies creates the need for more accurate methods providing consistent quantitation over time and across labs [14]. Proteomics provides a possible option for more accurate representation of histone PTMs. Based on a classical technique developed by Ben Garcia in 2007 [15], our group has previously modified and applied methods for the quantitative analysis of histone PTMs using multiple reaction monitoring methods [16, 17]. Here, we describe a direct approach for sorting human immune cells by FACS and quantifying global changes in histone PTMs by targeted LC-MS/MS. Isolation of cells of interest by FACS represents a high-throughput approach for interrogating normal human blood cells and provides a future application for clinical and translational proteomics.
Methods
Reagents.
All reagents were purchased from Sigma-Aldrich (St. Louis, MO) unless otherwise noted. FACS antibodies were purchased from BD Biosciences (San Jose, CA): PerCP-Cy5.5 mouse anti-human CD3 (clone SK7), BUV395 mouse anti-human CD4 (clone SK3), APC-H7 mouse anti-human HLA-DR (clone L243), PE-Cy7 mouse anti-human CD45RA (clone HI100), BV421 mouse anti-human CD197 (CCR7, clone 150503), BV605 mouse anti-human CD38 (clone HB7), Alexa Fluor 700 mouse anti-human CD138 (clone 1C6/CXCR3), PE mouse anti-human CD194 (CCR4, clone 1G1), FITC mouse anti-human CD62L (clone DREG-56), PE-Cy7 mouse anti-human CD14 (clone M5E2), FITC mouse anti-human CD15 (clone HI96), PE mouse anti-human CD19 (clone HIB19), and APC-H7 mouse anti-human CD45 (clone 2D1).
Clinical specimens.
De-identified donor peripheral blood (PB) specimen were obtained from AllCells (Alameda, CA), Innovative Research (Novi, MI), or as clinical discards from the Clinical Flow Cytometry Laboratory at Northwestern Memorial Hospital. All procedures performed in studies involving human participants were in accordance with the ethical standards of the institutional and/or national research committee and with the 1964 Helsinki declaration and its later amendments or comparable ethical standards.
Sorting of CD4+ T cell subtypes.
CD4+ helper T-cells were isolated directly from peripheral blood with EasySep Direct Human CD4+ T Cell Isolation Kit (Stemcell Technologies, Cambridge, MA) according to the manufacture’s procedure. Cells were stained with pre-titered volumes of the following antibodies for 30 min. at RT in the dark: PerCP-Cy5.5 anti-CD3, AF700 anti-CD4, PE-Cy7 anti-CD45RO, BV421 anti-CD197, BUV395 anti-CXCR3, PE anti-CCR4, and APC anti-CD45RA. Appropriate single color compensation controls were also stained using antibody capture beads (AbC Total Antibody Compensation Bead Kit), per manufacturer’s protocol. These tubes were used for experiment setup to calculate the spill-over compensation matrix. Cells were washed twice with 2% BSA in PBS then sorted on a 6-laser BD FACSAria SORP cell sorter with 4-way sort purity mode. Naïve T (CD3+CD4+CD62L+CD45RA+CXCR3+CCR4’CCR7+), Th1 (CD3+CD4+CXCR3+CCR4−), and Th2 cells (CD3+CD4+CXCR3−CCR4+) were sorted into collection tubes containing either 2% BSA in PBS or 0.4 N, 1 N, or 2 N H2SO4 (initial concentration, 0.2 N final concentration for all following dilution with sheath buffer during cell sorting and collection) at 105 events each. Cells sorted into 2% BSA in PBS were centrifuged at 500 x g for 5 min. then flash frozen and stored at −80 °C until preparation. Cells sorted into H2SO4 were directly subjected to centrifugation and histone precipitation with TCA. Two separate collections were performed for each condition.
Time course for sorting of CD3+ T cells.
Peripheral blood (500 μL) was stained with PerCP-Cy5.5 anti-CD3 for 30 min at RT in the dark. Red blood cells were lysed with the addition of a freshly prepared hypotonic ammonium chloride solution (15 mM ammonium chloride, 1 mM sodium bicarbonate, 0.1 mM EDTA) for 10 min. Cells were pelleted at 280 x g for 5 min and washed twice with 2% BSA in PBS prior to sorting on a 6-laser BD FACSAria (BD Biosciences). CD3+ cells (105 events) were sorted using 4-way sort purity mode into 2 N H2SO4 (30 μL, diluted to 0.2 N final concentration) and subjected to the histone preparation protocol and targeted mass spectrometry as described below. Blood was stored at 4 °C between sorting experiments. A single sorting replicate was performed for each donor at the indicated time point.
Sorting of leukocytes.
Red blood cells in peripheral blood were lysed using freshly prepared hypotonic ammonium chloride, leukocytes pelleted by centrifugation at 280 x g for 5 min and washed twice with 2% BSA in PBS. Cells were then stained with PE anti-CD19, PerCP-Cy5.5 anti-CD3, PE-Cy7 anti-CD14, FITC anti-CD15, and APC-H7 anti-CD45 for 30 min at RT in the dark. After washing with 2% BSA in PBS, monocytes (CD45+CD14+), neutrophils (CD45+CD15+), B cells (CD45+CD19+), and T cells (CD45+CD3+) were sorted into 2 N H2SO4 (30 μL, 10X concentration) on a 6-laser BD FACSAria using 4-way purity and subjected to the histone preparation and targeted LC-MS/MS analysis described below. Three separate collections were performed for each cell type.
Histone extraction and preparation.
After cells were sorted into H2SO4 and histones were extracted, cellular debris was removed by centrifugation at 4,000 x g for 5 min. Trichloroacetic acid (TCA) was added to the supernatant to a final concentration of 20% (v/v) and incubated overnight at 4 °C to precipitate histone proteins. Histones were then pelleted at 10,000 x g for 5 min., washed once with 0.1% HCl in acetone then twice with 100% acetone with centrifugation at 15,000 x g for 5 min., then dried briefly in a fume hood. Histone derivatization and digestion was modified from Garcia et al. [18]. Dried histones were resuspended in 50 mM ammonium bicarbonate (10 μL). Sodium hydroxide (5 μL) was added immediately followed by the addition of propionic anhydride (20 μL, 1:3 dilution in isopropanol). The pH was adjusted to 8 with additional sodium hydroxide. Samples were incubated at 52°C for 1 h and dried to completion in a SpeedVac concentrator. Histones were resuspended in 50 mM ammonium bicarbonate (50 μL) and digested for 16 h with 1 μg trypsin. Peptide digested were dried in a Speedvac concentrator and subjected to a final propionylation as described above prior to targeted mass spectrometry.
Targeted mass spectrometry.
Histone peptides were resuspended in 0.1% trifluoroacetic acid (TFA) in water and analyzed by nano-LC (Dionex, Sunnyvale, CA) on a triple quadrupole mass spectrometer (TSQ Quantiva, ThermoFisher Scientific). Peptides (10% of the peptide mixture) were loaded onto a trapping column (3 cm×150 μm, packed with ProntoSIL C18-AQ, 3μm, 200Å resin (New Objective, Woburn, MA)) for 10 min. with 100% Solvent A (0.1% TFA in water) at a flow rate of 2.5 μL/min then eluted from the trapping column and separated on a PicoChip analytical capillary column (10 cm χ 75 μm packed with ProntoSIL C18-AQ, 3μm, 200Å resin (New Objective)) by increasing the percentage of Solvent B (0.1% formic acid in 95% acetonitrile) from 1 to 35% at a flow rate of 0.30 μL/min over 45 minutes. The peptides were eluted from the analytical column and introduced into the triple quadrupole mass spectrometer by electrospray from an emitter with a 10 μm tip (New Objective). The instrument settings were as follows: collision gas pressure of 1.5 mTorr; Q1 peak width of 0.7 (FWHM); cycle time of 3 s; skimmer offset of 10 V; electrospray voltage of 2.5 kV. All injections were performed in technical triplicate. Targeted analysis of unmodified and various modified histone peptides was performed with transitions specific to each peptide species (Supplementary Table 1) [16, 19].
Quantitation of histone modifications.
Raw MS files were imported and analyzed in Skyline with Savitzky-Golay smoothing [20]. All Skyline peak area assignments were manually confirmed. Total peak areas from SRM exported from Skyline were used to determine the relative abundances of distinct histone PTMs. The relative abundances were determined from the mean of three technical replicates with error bars representing standard deviation.
Statistical analysis.
All values represent the mean ± one standard deviation. Significance was determined using ANOVA with a Bonferroni correction with confident results reported at a p-value <0.05.
Results and Discussion
Optimization of cell sorting conditions.
Typical FACS methods require sorting into cell culture media and/or bovine serum albumin (BSA) to maintain cell viability for downstream experiments. While this method is very effective for culturing of sorted cells, it may not be optimal for analysis of histone PTMs due to known incompatibilities of BSA with MS approaches [21]. Further, many histone PTMs have short half-lives [22], and increased time in the collection tube following sorting increases the possibility of an altered epigenetic profile during long sorts. Improvements in the sorting conditions to eliminate BSA, reduce the possibility of PTM loss, and reduce sample handling are essential to develop a robust, general method.
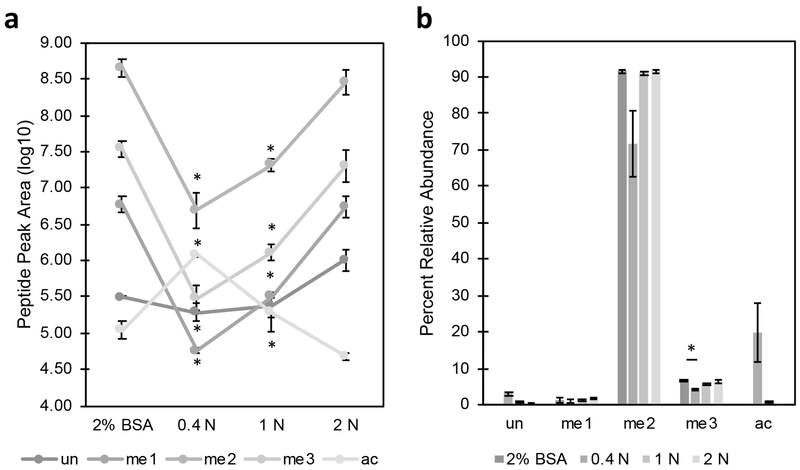
To optimize the approach, 0.4 N, 1 N, and 2 N H2SO4 (2X, 5X, or 10X concentration based on standard preparation protocols [18]) as the collection buffers were assessed alongside the standard 2% BSA in PBS for sorting Th1 cells. Significant decreases were observed in MS signal intensity between the 2% BSA control and the 0.4 N and 1 N H2SO4 collection conditions (Figure 1A). No significant differences were observed in the signal intensities between 2% BSA and 2 N H2SO4. PTMs on histone H4 K20 have a large dynamic range, with dimethylation typically representing >80% of PTM occupancy at that site with other methylations representing ~1–10% [23]. Comparison of the abundance of PTMs at this site across different collection conditions shows significant differences in the 0.4 N and 1 N H2SO4 compared to the 2% BSA control (Figure 1B). Similar to the observations in signal intensity, the 2 N H2SO4 showed no significant differences in the relative abundance of PTMs at this site compared to the 2% BSA. Direct sorting into concentrated H2SO4 reduces the amount of time cells are stored, helping to reduce post-sort biases and maintain PTMs, providing significant advantages over traditional collection buffers while yielding comparable results. Since the results obtained from 2 N H2SO4 were consistent with those acquired from 2% BSA and due to the advantages of sorting directly into acid, we chose to use 2 N H2SO4 as the collection buffer for all subsequent experiments.
Figure 1.
Direct sorting into acid for histone analysis. Th1 cells (105 events) were sorted in duplicate into 2% BSA in PBS, 0.4 N H2SO4, 1 N H2SO4, or 2 N H2SO4 and histones were extracted, derivatized, digested, and subjected to targeted LC-MS/MS with three technical replicates. A) Signal intensity (log10) for each collection condition shows significantly lower signal in 0.4 N and 1 N H2SO4. B) Analysis of H4 K20 PTMs shows no difference in each of the modification states between the BSA, 1 N, and 2 N H2SO4 collection conditions. Asterisk represents p < 0.05 by ANOVA with Bonferroni correction.
Ranges for histone modifications in healthy individuals.
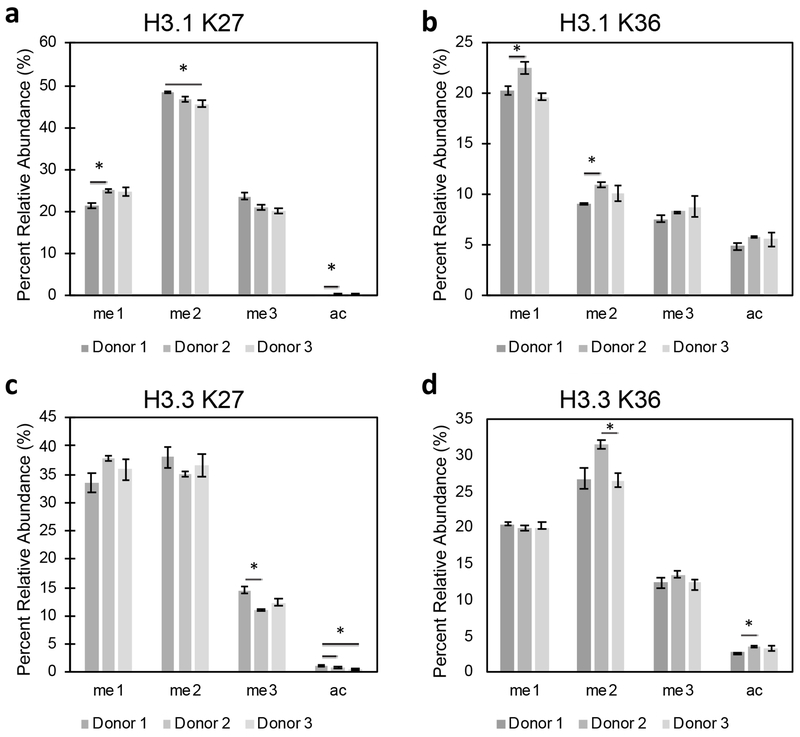
Previous work assessing gene expression patterns from cells in peripheral blood showed significant variability in expression between individuals, even in distinct cell types [24]. Given the variability in gene expression patterns, we anticipate variability in histone PTMs as well. To determine the levels histone PTMs across individuals, CD3+ T cells were sorted from three healthy donors according to the method optimized above and histone marks were quantified by targeted LC-MS/MS. PTMs at histone H3 K27 and K36 are of great interest in the literature due to the well-documented disruptions in modifications at these sites contributing to tumorigenesis [25–28]. Hence, we focused on these sites when assessing individual variation as they would provide useful in future disease studies.
Quantitation of the abundance of PTMs at H3 K27 and K36 showed small, but significant changes. At histone H3.1 K27, significant differences were observed in all modification states except trimethylation, with the differences in relative abundance being less than 4%, 3%, and 0.2% for mono-, di-methylation and acetylation, respectively (Figure 2A). Fewer differences were observed at histone H3.1 K36, where no significant differences were seen with trimethylation and acetylation and differences in relative abundance being less than 3% and 2% for mono- and di-methylation, respectively (Figure 2B). On histone H3.3, which is present within transcriptionally active genes and promoters [29], small, yet statistically significant differences were seen in both K27me3 (<4% difference) and K27ac (<0.5% difference) (Figure 2C) and K36me2 (~5% difference) and K36ac (~1% difference) (Figure 2D). Despite the significant differences measured between individuals, these variations were small, representing approximately 5% or less difference in relative abundance at all sites measured. The narrow ranges observed for these PTMs suggest that the global abundance of histone marks likely exhibit a “normal range,” which will prove useful to assess new epigenetic therapies using this approach.
Figure 2.
Individual variability in histone modifications in healthy donors. CD3+ cells (105 events) were sorted from total leukocytes collected from three healthy individuals. Targeted LC-MS/MS analysis shows small but significant differences between individuals at histone H3.1 A) K27 and B) K36 and H3.3 C) K27 and D) K36. Asterisk represents p < 0.05 by ANOVA with Bonferroni correction.
Histone modifications change with increased storage time.
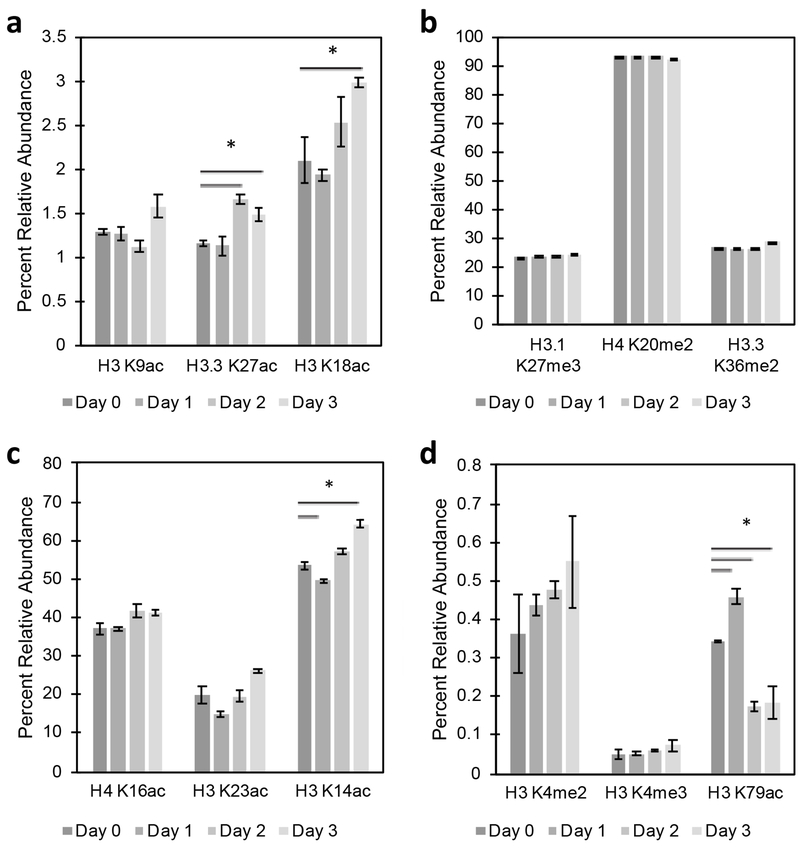
We then wanted to investigate the changes in histone PTMs that may occur over time following initial blood collection. Since histone PTMs can have fast turnover [19, 30], knowledge of potential alterations in PTMs during temporary storage, such as when analysis cannot be performed on the day of blood collection, may prove useful in future translational approaches. CD3+ were sorted from peripheral blood the day of blood draw (Day 0) and Day 1, Day 2, and Day 3 after the initial analysis. To eliminate variability caused by individual differences, analyses were performed with blood from a single donor. Based on previous work determining the kinetics and turnover of modifications in cell lines [19, 30], PTMs with turnovers greater than 0.6 h−1 were classified as rapidly turned over, whereas those with a turnover of less than 0.4 h−1 were classified as slowly turned over. Histone analysis showed statistically significant differences with increased storage time at sites that are low in abundance and rapidly turned over, such as H3.3 K27ac with ~0.5% increase and K18ac with ~1% increase (Figure 3A) following two days of storage. PTMs with slower turnover, such as H3.1 K27me3 and H4 K20me2 (Figure 3B), remained stable throughout the study period. Of those marks that are high in abundance and rapidly turned over, only K14ac showed a statistically significant decrease of 4% on Day 1 and increase of 10% on Day 4 (Figure 3C). Histone H3 K79ac, which is low in abundance and slowly turned over [31], showed significant differences at all time-points, whereas other low abundance with long half-life modifications showed no differences (Figure 3D).
Figure 3.
Alterations in histone modifications with storage time. Blood was drawn and red blood cells were stained and lysed on Day 0 (day of blood braw) and Day 1, Day 2, and Day 3 following initial analysis. CD3+ T cells (105 events) were sorted from total leukocytes into 2 N H2SO4. The percent relative abundance was determined for histone PTMs that are A) in low abundance and rapidly turned over, B) in high abundance and slowly turned over, C) in high abundance and rapidly turned over, and D) in low abundance and slowly turned over. Asterisk represent p < 0.05 by ANOVA with Bonferroni correction.
Little variation is observed between helper T cell subtypes.
To begin to investigate how an altered chromatin landscape can impact cell type and function, we desired to delve deeper into a defined branch of differentiation to assess the histone PTMs underlying for the biological differences. Currently, there is little knowledge of alterations in histone PTMs associated with differentiation beyond loci-specific changes. In CD4+ T cells, exposure of naïve T cells to antigen results in differentiation into a multitude of effector T cells, including Th1 and Th2 subtypes, depending on the stimulus [32]. Findings in the literature show that acetylation of K9 and K14 at different loci contributes to the differences in cytokine secretion between Th1 and Th2 cells [7, 8], as well as differing transcription factor activation and DNA methylation, though no studies have investigated the global differences in histone modifications between subtypes.
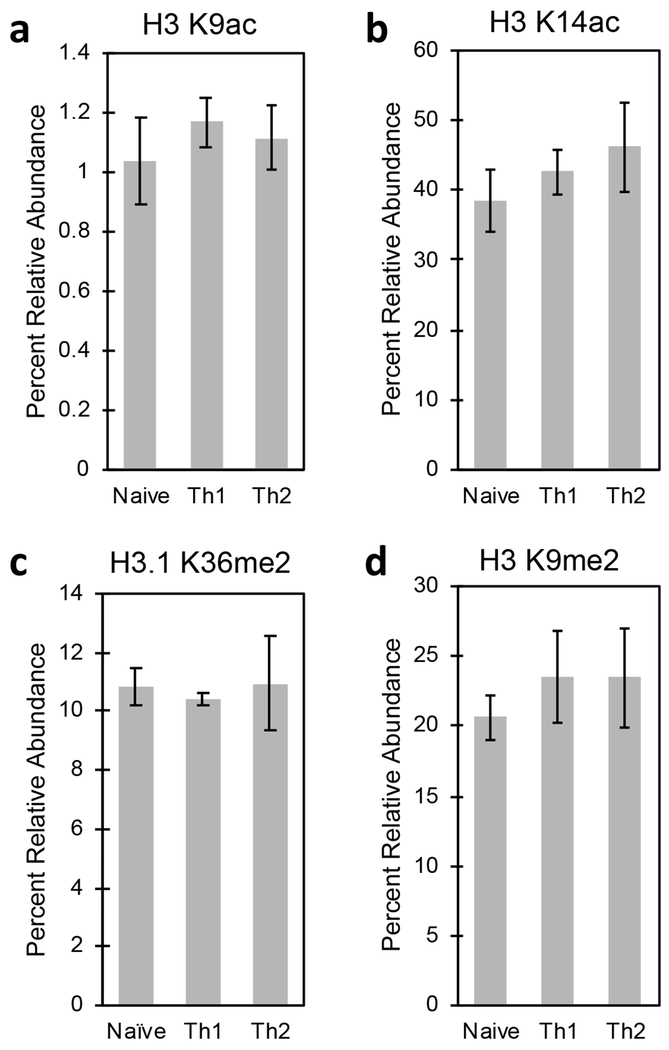
To measure the changes in histone marks between these closely-related cell subtypes, we sorted 105 CD4+ naïve T, Th1, and Th2 cells and performed histone analysis to measure the global differences in PTMs. Surprisingly, no global differences were observed between these three subtypes for acetylations on histone H3 K9 or K14 (Figure 4A and 4B), two PTMs known to play a role in gene regulation between Th1 and Th2 following differentiation, nor in PTMs known to play a role in active (Figure 4C) or repressed (Figure 4D) chromatin. These data are surprising given the vastly different roles these subtypes play in the immune system. The results suggest that local alterations in histone PTMs and chromatin at distinct loci, rather than global chromatin remodeling as detected by our assay, regulate the epigenetic difference in these three closely related subtypes.
Figure 4.
Histone profiles of T cell subtypes. CD4+ T cells were enriched with magnetic beads prior to sorting naïve T, Th1, and Th2 subtypes (105 events). Quantitation of histone H3 A) K9ac, B) K14ac, C) K36me2, and D) K9me2 show no significant differences between subtypes.
Large differences are seen across major cell lineages.
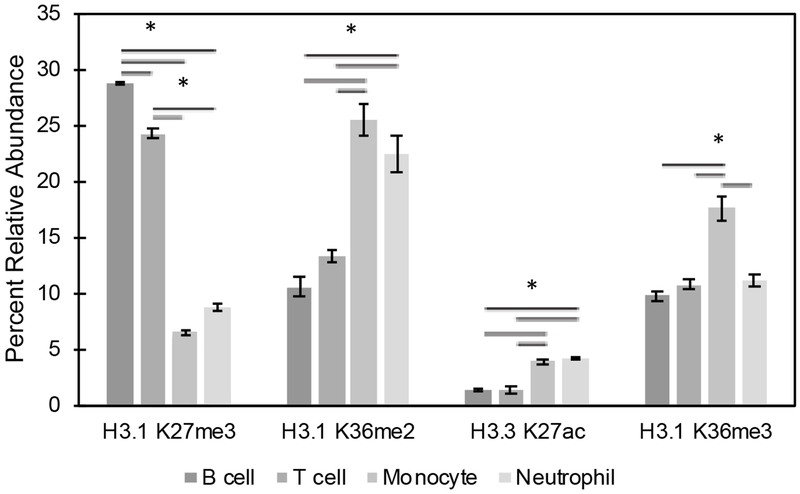
Since little variation was observed between the T cell subtypes studied above, we investigated if there were differences in the abundance of histone PTMs across these cell lineages. Analysis of histone marks from sorted lymphoid cells (B and T cells) and myeloid cells (neutrophils and monocytes) showed statistically significant differences between these two lineages at multiple sites 1 (Figure 5). Additionally, significant differences were seen between cell types within the same lineage, such as histone H3.1 K27me3 in B and T cells and histone H3.1 K36me3 in neutrophils and monocytes. These results were striking, most notably for the lineage-specific differences. Histone H3.3 K27ac, which resides within active enhancer regions [33], along with H3.1 K36me2, which borders open reading frames of active genes [34], are more than twice as abundant in myeloid cells (Figure 5). In contrast, lymphoid cells have levels of H3.1 K27me3 roughly four times higher than myeloid cells (~25% versus ~6%), indicative of repressed chromatin [35]. The biological implications of these differences are unknown, but future work using ChIP-Seq directed toward these particular marks will help distinguish the significance of these differences within cellular differentiation.
Figure 5.
Histone profile of leukocytes. Peripheral blood mononuclear cells were collected and sorted into neutrophils, monocytes, B cells, and T cells (105 events). Histone analysis shows significant differences between cell lineages and between cells types within a lineage. Asterisk represent p < 0.05 by ANOVA with Bonferroni correction.
Conclusions
Changes in global histone PTMs in hematopoiesis remain poorly understood despite the extensive studies of gene expression signatures at different stages of development and differentiation. Efforts have focused on enrichment of regions of DNA associated with histone PTMs by ChIP-Seq to reveal histone PTM profiles [36, 37], though these methods do not provide a direct measure of histone PTMs and their stoichiometry. We have developed a complementary approach for quantifying histone PTMs from cells sorted by FACS to quickly surveil their epigenetic landscape. PTMs remain stable during short periods of storage as whole blood, allowing this technique to be employed in future clinical research and the protocol should be directly extensible to far fewer number of cells than that reported in this study. In a small cohort of three donors, little variability is observed in histone PTMs between individuals. The large differences in PTMs are seen across cell lineages, likely exemplifying the underlying chromatin structure that proceeds through cellular differentiation. The methods developed here reveal an area of high potential growth in translational and clinical research. In an era of precision medicine and emerging epigenetic therapies, this approach can be leveraged to investigate dysregulation of histone PTMs in disease, inform treatments, and assess therapeutic response in human subjects.
Supplementary Material
Statement of human rights.
All procedures performed in studies involving human participants were in accordance with the ethical standards of the institutional and/or national research committee and with the 1964 Helsinki declaration and its later amendments or comparable ethical standards.
Acknowledgements
This work was carried out with a financial support from The Paul G. Allen Family Foundation (Award #11715), NCI CCSG P30CA060553 awarded to the Robert H. Lurie Comprehensive Cancer Center, and the National Resource for Translational and Developmental Proteomics supported by P41 GM108569.
Footnotes
Publisher's Disclaimer: This Author Accepted Manuscript is a PDF file of a an unedited peer-reviewed manuscript that has been accepted for publication but has not been copyedited or corrected. The official version of record that is published in the journal is kept up to date and so may therefore differ from this version.
Conflict of Interest
The authors declare that they have no conflict of interest.
References
- 1.Seumois G, Chavez L, Gerasimova A, Lienhard M, Omran N, Kalinke L, Vedanayagam M, Ganesan APV, Chawla A, Djukanović R, Ansel KM, Peters B, Rao A, Vijayanand P: Epigenomic analysis of primary human T cells reveals enhancers associated with TH2 memory cell differentiation and asthma susceptibility. Nat. Immunol. 15, 777 (2014) [DOI] [PMC free article] [PubMed] [Google Scholar]
- 2.Poropatich K, Fontanarosa J, Swaminathan S, Dittmann D, Chen S, Samant S, Zhang B: Comprehensive T-cell immunophenotyping and next-generation sequencing of human papillomavirus (HPV)-positive and HPV-negative head and neck squamous cell carcinomas. J. Pathol. 243, 354–365 (2017) [DOI] [PubMed] [Google Scholar]
- 3.Mikkelsen TS, Ku M, Jaffe DB, Issac B, Lieberman E, Giannoukos G, Alvarez P, Brockman W, Kim TK, Koche RP, Lee W, Mendenhall E, O’Donovan A, Presser A, Russ C, Xie X, Meissner A, Wernig M, Jaenisch R, Nusbaum C, Lander ES, Bernstein BE: Genome-wide maps of chromatin state in pluripotent and lineage-committed cells. Nature. 448, 553–560 (2007) [DOI] [PMC free article] [PubMed] [Google Scholar]
- 4.Terskikh AV, Miyamoto T, Chang C, Diatchenko L, Weissman IL: Gene expression analysis of purified hematopoietic stem cells and committed progenitors. Blood. 102, 94–101 (2003) [DOI] [PubMed] [Google Scholar]
- 5.Hystad ME, Myklebust JH, Bo TH, Sivertsen EA, Rian E, Forfang L, Munthe E, Rosenwald A, Chiorazzi M, Jonassen I, Staudt LM, Smeland EB: Characterization of early stages of human B cell development by gene expression profiling. J. Immunol. 179, 3662–3671 (2007) [DOI] [PubMed] [Google Scholar]
- 6.Durek P, Nordström K, Gasparoni G, Salhab A, Kressler C, de Almeida M, Bassler K, Ulas T, Schmidt F, Xiong J, Glažar P, Klironomos F, Sinha A, Kinkley S, Yang X, Arrigoni L, Amirabad Azim D., Ardakani Fatemeh B., Feuerbach L, Gorka O, Ebert P, Müller F, Li N, Frischbutter S, Schlickeiser S, Cendon C, Fröhler S, Felder B, Gasparoni N, Imbusch Charles D., Hutter B, Zipprich G, Tauchmann Y, Reinke S, Wassilew G, Hoffmann U, Richter Andreas S., Sieverling L, Chang H-D, Syrbe U, Kalus U, Eils J, Brors B, Manke T, Ruland J, Lengauer T, Rajewsky N, Chen W, Dong J, Sawitzki B, Chung H-R, Rosenstiel P, Schulz Marcel H., Schultze Joachim L., Radbruch A, Walter J, Hamann A, Polansky Julia K.: Epigenomic profiling of human CD4+ T cells supports a linear differentiation model and highlights molecular regulators of memory development. Immunity. 45, 1148–1161 [DOI] [PubMed] [Google Scholar]
- 7.Avni O, Lee D, Macian F, Szabo SJ, Glimcher LH, Rao A: T(H) cell differentiation is accompanied by dynamic changes in histone acetylation of cytokine genes. Nat. Immunol. 3, 643–651 (2002) [DOI] [PubMed] [Google Scholar]
- 8.Fields PE, Kim ST, Flavell RA: Cutting edge: changes in histone acetylation at the IL-4 and IFN-gamma loci accompany Th1/Th2 differentiation. J. Immunol. 169, 647–650 (2002) [DOI] [PubMed] [Google Scholar]
- 9.Ono C, Yu Z, Kasahara Y, Kikuchi Y, Ishii N, Tomita H: Fluorescently activated cell sorting followed by microarray profiling of helper T cell subtypes from human peripheral blood. PLoS ONE. 9, e111405 (2014) [DOI] [PMC free article] [PubMed] [Google Scholar]
- 10.Wei G, Wei L, Zhu J, Zang C, Hu-Li J, Yao Z, Cui K, Kanno Y, Roh TY, Watford WT, Schones DE, Peng W, Sun H. w., Paul WE, O’Shea JJ, Zhao K: Global mapping of H3K4me3 and H3K27me3 reveals specificity and plasticity in lineage fate determination of differentiating CD4+ T cells. Immunity. 30, 155–167 (2009) [DOI] [PMC free article] [PubMed] [Google Scholar]
- 11.Stein EM, Garcia-Manero G, Rizzieri DA, Tibes R, Berdeja JG, Savona MR, Jongen-Lavrenic M, Altman JK, Thomson B, Blakemore SJ, Daigle SR, Waters NJ, Suttle AB, Clawson A, Pollock R, Krivtsov A, Armstrong SA, DiMartino J, Hedrick E, Lowenberg B, Tallman MS: The DOT1L inhibitor pinometostat reduces H3K79 methylation and has modest clinical activity in adult acute leukemia. Blood. 131, 2661–2669 (2018) [DOI] [PMC free article] [PubMed] [Google Scholar]
- 12.Kurmasheva RT, Sammons M, Favours E, Wu J, Kurmashev D, Cosmopoulos K, Keilhack H, Klaus CR, Houghton PJ, Smith MA: Initial testing (stage 1) of tazemetostat (EPZ-6438), a novel EZH2 inhibitor, by the Pediatric Preclinical Testing Program. Pediatr. Blood Cancer. 64, (2017) [DOI] [PMC free article] [PubMed] [Google Scholar]
- 13.Italiano A, Soria JC, Toulmonde M, Michot JM, Lucchesi C, Varga A, Coindre JM, Blakemore SJ, Clawson A, Suttle B, McDonald AA, Woodruff M, Ribich S, Hedrick E, Keilhack H, Thomson B, Owa T, Copeland RA, Ho PTC, Ribrag V: Tazemetostat, an EZH2 inhibitor, in relapsed or refractory B-cell non-Hodgkin lymphoma and advanced solid tumours: a first-in-human, open-label, phase 1 study. Lancet Oncol. 19, 649–659 (2018) [DOI] [PubMed] [Google Scholar]
- 14.Peach SE, Rudomin EL, Udeshi ND, Carr SA, Jaffe JD: Quantitative assessment of chromatin immunoprecipitation grade antibodies directed against histone modifications reveals patterns of co-occurring marks on histone protein molecules. Mol. Cell Proteomics. 11, 128–137 (2012) [DOI] [PMC free article] [PubMed] [Google Scholar]
- 15.Garcia BA, Mollah S, Ueberheide BM, Busby SA, Muratore TL, Shabanowitz J, Hunt DF: Chemical derivatization of histones for facilitated analysis by mass spectrometry. Nat. Protocols. 2, 933–938 (2007) [DOI] [PMC free article] [PubMed] [Google Scholar]
- 16.Zheng Y, Sweet SM, Popovic R, Martinez-Garcia E, Tipton JD, Thomas PM, Licht JD, Kelleher NL: Total kinetic analysis reveals how combinatorial methylation patterns are established on lysines 27 and 36 of histone H3. Proc. Natl. Acad. Sci. U S A. 109, 13549–13554 (2012) [DOI] [PMC free article] [PubMed] [Google Scholar]
- 17.Zheng Y, Thomas PM, Kelleher NL: Measurement of acetylation turnover at distinct lysines in human histones identifies long-lived acetylation sites. Nat. Commun. 4, 2203 (2013) [DOI] [PMC free article] [PubMed] [Google Scholar]
- 18.Garcia BA, Mollah S, Ueberheide BM, Busby SA, Muratore TL, Shabanowitz J, Hunt DF: Chemical derivatization of histones for facilitated analysis by mass spectrometry. Nat. Protoc. 2, 933–938 (2007) [DOI] [PMC free article] [PubMed] [Google Scholar]
- 19.Zheng Y, Thomas PM, Kelleher NL: Measurement of acetylation turnover at distinct lysines in human histones identifies long-lived acetylation sites. Nat. Commun. 4, 2203 (2013) [DOI] [PMC free article] [PubMed] [Google Scholar]
- 20.MacLean B, Tomazela DM, Shulman N, Chambers M, Finney GL, Frewen B, Kern R, Tabb DL, Liebler DC, MacCoss MJ: Skyline: an open source document editor for creating and analyzing targeted proteomics experiments. Bioinformatics. 26, 966–968 (2010) [DOI] [PMC free article] [PubMed] [Google Scholar]
- 21.Bunkenborg J, Garcia GE, Paz MI, Andersen JS, Molina H: The minotaur proteome: avoiding cross-species identifications deriving from bovine serum in cell culture models. Proteomics. 10, 3040–3044 (2010) [DOI] [PubMed] [Google Scholar]
- 22.Zee BM, Levin RS, DiMaggio PA, Garcia BA: Global turnover of histone post-translational modifications and variants in human cells. Epigenetics Chromatin. 3, 22 (2010) [DOI] [PMC free article] [PubMed] [Google Scholar]
- 23.Pesavento JJ, Bullock CR, LeDuc RD, Mizzen CA, Kelleher NL: Combinatorial modification of human histone H4 quantitated by two-dimensional liquid chromatography coupled with top down mass spectrometry. J. Biol. Chem. 283, 14927–14937 (2008) [DOI] [PMC free article] [PubMed] [Google Scholar]
- 24.Whitney AR, Diehn M, Popper SJ, Alizadeh AA, Boldrick JC, Relman DA, Brown PO: Individuality and variation in gene expression patterns in human blood. Proc. Natl. Acad. Sci. U S A. 100, 1896–1901 (2003) [DOI] [PMC free article] [PubMed] [Google Scholar]
- 25.Beguelin W, Popovic R, Teater M, Jiang Y, Bunting KL, Rosen M, Shen H, Yang SN, Wang L, Ezponda T, Martinez-Garcia E, Zhang H, Zheng Y, Verma SK, McCabe MT, Ott HM, Van Aller GS, Kruger RG, Liu Y, McHugh CF, Scott DW, Chung YR, Kelleher N, Shaknovich R, Creasy CL, Gascoyne RD, Wong KK, Cerchietti L, Levine RL, Abdel-Wahab O, Licht JD, Elemento O, Melnick AM: EZH2 is required for germinal center formation and somatic EZH2 mutations promote lymphoid transformation. Cancer Cell. 23, 677–692 (2013) [DOI] [PMC free article] [PubMed] [Google Scholar]
- 26.Martinez-Garcia E, Popovic R, Min D-J, Sweet SMM, Thomas PM, Zamdborg L, Heffner A, Will C, Lamy L, Staudt LM, Levens DL, Kelleher NL, Licht JD: The MMSET histone methyl transferase switches global histone methylation and alters gene expression in t(4; 14) multiple myeloma cells. Blood. 117, 211–220 (2011) [DOI] [PMC free article] [PubMed] [Google Scholar]
- 27.Oyer JA, Huang X, Zheng Y, Shim J, Ezponda T, Carpenter Z, Allegretta M , Okot-Kotber CI, Patel JP, Melnick A, Levine RL, Ferrando A, Mackerell AD Jr., Kelleher NL, Licht JD, Popovic R: Point mutation E1099K in MMSET/NSD2 enhances its methyltranferase activity and leads to altered global chromatin methylation in lymphoid malignancies. Leukemia. 28, 198–201 (2014) [DOI] [PMC free article] [PubMed] [Google Scholar]
- 28.Souroullas GP, Jeck WR, Parker JS, Simon JM, Liu JY, Paulk J, Xiong J, Clark KS, Fedoriw Y, Qi J, Burd CE, Bradner JE, Sharpless NE: An oncogenic Ezh2 mutation induces tumors through global redistribution of histone 3 lysine 27 trimethylation. Nat. Med. 22, 632–640 (2016) [DOI] [PMC free article] [PubMed] [Google Scholar]
- 29.Elsaesser SJ, Goldberg AD, Allis CD: New functions for an old variant: no substitute for histone H3.3. Curr. Opin. Genet. Dev. 20, 110–117 (2010) [DOI] [PMC free article] [PubMed] [Google Scholar]
- 30.Zee BM, Levin RS, DiMaggio PA, Garcia BA: Global turnover of histone post-translational modifications and variants in human cells. Epigenetics Chromatin. 3, 22 (2010) [DOI] [PMC free article] [PubMed] [Google Scholar]
- 31.Sweet SM, Li M, Thomas PM, Durbin KR, Kelleher NL: Kinetics of reestablishing H3K79 methylation marks in global human chromatin. J. Biol. Chem. 285, 32778–32786 (2010) [DOI] [PMC free article] [PubMed] [Google Scholar]
- 32.Ansel KM, Lee DU, Rao A: An epigenetic view of helper T cell differentiation. Nat. Immunol. 4, 616–623 (2003) [DOI] [PubMed] [Google Scholar]
- 33.Creyghton MP, Cheng AW, Welstead GG, Kooistra T, Carey BW, Steine EJ, Hanna J, Lodato MA, Frampton GM, Sharp PA, Boyer LA, Young RA, Jaenisch R: Histone H3K27ac separates active from poised enhancers and predicts developmental state. Proc. Natl. Acad. Sci. U S A. 107, 21931–21936 (2010) [DOI] [PMC free article] [PubMed] [Google Scholar]
- 34.Li B, Carey M, Workman JL: The role of chromatin during transcription. Cell. 128, 707–719 (2007) [DOI] [PubMed] [Google Scholar]
- 35.Schuettengruber B, Chourrout D, Vervoort M, Leblanc B, Cavalli G: Genome regulation by polycomb and trithorax proteins. Cell. 128, 735–745 (2007) [DOI] [PubMed] [Google Scholar]
- 36.Schmidl C, Renner K, Peter K, Eder R, Lassmann T, Balwierz PJ, Itoh M, Nagao-Sato S, Kawaji H, Carninci P, Suzuki H, Hayashizaki Y, Andreesen R, Hume DA, Hoffmann P, Forrest ARR, Kreutz MP, Edinger M, Rehli M: Transcription and enhancer profiling in human monocyte subsets. Blood. 123, e90–e99 (2014) [DOI] [PubMed] [Google Scholar]
- 37.Barski A, Cuddapah S, Cui K, Roh T-Y, Schones DE, Wang Z, Wei G, Chepelev I, Zhao K: High-Resolution Profiling of Histone Methylations in the Human Genome. Cell. 129, 823–837 (2007) [DOI] [PubMed] [Google Scholar]
Associated Data
This section collects any data citations, data availability statements, or supplementary materials included in this article.


