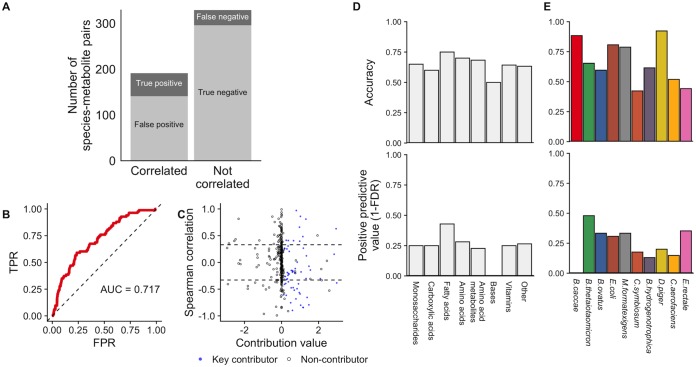
FIG 3.
Species-metabolite correlations poorly predict species contributions to metabolite variation. (A) The number of species-metabolite pairs that were significantly correlated (left bar) or not correlated (right bar) and its correspondence with true species-metabolite key contributors (indicated by gray shading). (B) Receiver operating characteristic (ROC) plot, showing the ability of absolute Spearman correlation values to classify key contributors among all species-metabolite pairs. FPR, false-positive rate; TPR, true positive rate. (C) Scatter plot of species-metabolite pairs, showing the poor correspondence between true contribution values (x axis) and Spearman correlation (y axis). Key contributors are plotted as blue points and others as hollow circles. Dashed lines show significant correlations (P < 0.01). Species-metabolite pairs with a contribution value greater than 3 in magnitude whose values are not shown. (D and E) Accuracy and positive predictive value of Spearman correlation analysis for detecting true key contributors across metabolite classes (D) and for each of the 10 species (E).

