Abstract
Fluorescence phase shift and demodulation methods were used in the analysis of excited-state reactions and to investigate solvent relaxation around fluorophores in viscous solvents. The chosen samples illustrate the results expected for fluorophores bound to biological macromolecules. These moderately simple samples served to test the theoretical predictions described in the preceding paper (J.R. Lakowicz and A.B. Balter, Biophys. Chem. 16 (1982) 99.) and to illustrate the characteristic features of phase-modulation data expected from samples which display time-dependent spectral shifts. The excited-state protonation of acridine and exciplex formation between anthracene and diethylaniline provided examples of one-step reactions in which the lifetimes of the initially excited and the reacted species were independent of emission wavelength. Using these samples we demonstrated the following: (1) Wavelength-dependent phase shift and demodulation values can be used to prove the occurrence of an excited-state process. Proof is obtained by observation of phase angles (ϕ) larger than 90° or by measurement of ratios of m/cos ϕ >l, where m is the modulation of the emission relative to that of the excitation. (2) For a two-state process the individual emission spectra of each state can be calculated from the wavelength-dependent phase and modulation data (3) The phase difference or demodulation factor between the initially excited and the reacted states reveals directly the fluorescence lifetime of the product of the reaction. (4) Phase-sensitive detection of fluorescence can be used to prove that the lifetimes of both the initially excited and the reacted states are independent of emission wavelength. (5) If steady-state spectra of the individual species are known, then phase-sensitive emission spectra can be used to measure the lifetimes of the individual components irrespective of the extent of spectral overlap. (6) Spectral regions of constant lifetime can be identified by the ratios of phase-sensitive emission spectra. In addition, we examined 6-propionyl-2-dimethylaminonaphthalene (PRODAN) and N-acetyl-l-tryptophanamide (NATA) in viscous solvents where the solvent relaxation times were comparable to the fluorescence lifetimes. Using PRODAN in n-butanol we used m/cos ϕ measurements, relative to the blue edge of the emission, to demonstrate that solvent relaxation requires more than a single step. For NATA in propylene glycol we used phase-sensitive detection of fluorescence to directly record the emission spectra of the initially excited and the solvent relaxed states. These measurements can be easily extended to fluorophores which are bound to proteins and membranes and are likely to be useful in studies of the dynamic properties of biopolymers.
Keywords: Fluorescence phase shift, Fluorescence demodulation, Excited-state process, Fluorophore
1. Introduction
In the preceding paper [1], we presented theory and model calculations which illustrated the characteristic features of fluorescence phase shift and demodulation data expected for fluorophores which display time-dependent spectral shifts. In the current paper, we present data obtained from samples which undergo a one-step reaction and from samples which display more complex time-dependent spectral shifts. Our objective was not to analyze the specific reactions in detail. Rather, we wished to compare data with the theoretical predictions made in the preceding paper and to determine the feasibility of the novel procedures suggested in this paper. Only a few reports [2–6] are available which describe phase shift or demodulation measurements on systems which undergo excited-state reactions or relaxation. Consequently, we examined several such cases to learn the general features of these data and we attempt to explain the physical significance of the data.
The first reaction examined was the excited-state protonation of acridine in the presence of ammonium nitrate [7]. In the excited state the pKa of neutral acridine increases from 5.45 to 10.7. The excited-state reaction is the removal of a proton from ammonium ions. The fluorescence emission of acridinium is considerably red shifted relative to the initially excited neutral acridine. This reaction provides an example of a one-step (two-state) reaction which appears to be irreversible at low ammonia concentrations. The lifetimes of the neutral and charged species are independent of emission wavelength. This simple system serves to illustrate many of the predictions described in the previous theoretical paper [1].
As a second example of a one-step irreversible reaction we examined exciplex formation between anthracene and diethylaniline. The emission spectra of the monomer and exciplex emission are widely separated, allowing one to assign the phase and modulation values observed on the blue and red sides of the emission to those of the monomer and exciplex, respectively. The wavelength-dependent phase and modulation values were used to calculate the emission spectrum of each species.
The third excited-state process we examined was solvent relaxation of n-butanol around the excited state dipole moment of 6-propionyl-2-dimethylaminonaphthalene (PRODAN). The emission spectrum of this fluorophore is highly sensitive to solvent polarity [8], probably as a result of interactions of the widely spaced carbonyl and amino residues with solvent dipoles. In the excited state it appears that negative and positive charges are localized on the carbonyl and amino residues, respectively [9]. Solvent relaxation around PRODAN was selected because it displayed more complexity than the two-state reactions described above. On the red and blue edge sides of the emission the apparent lifetimes approached constant values [5], suggesting that the relaxed and unrelaxed emission could be selectively observed to a reasonable extent. However, the existence of at least two steps (three states) in the relaxation process was suggested by the two sites (amino and carbonyl) of interaction with solvent dipoles, Thus, this reaction was favorable for the use of differential-wavelength m/cos ϕ values to determine if the excited-state process involves more than a single step [1]. The emission spectral properties of PRODAN and its analogues are sensitive to the dynamic properties of both proteins and membranes [5,8,10] and thus a further understanding of the details of spectral relaxation will be valuable in interpreting the data obtained using labeled biopolymers.
And finally we examined an uncharged tryptophan analogue, N-acetyl-l-tryptophanamide (NATA), in propylene glycol at various temperatures. We used phase-sensitive detection of fluorescence to resolve apparent spectra of the initially excited NATA molecules from the spectra of those molecules around which solvent relaxation is mostly complete. Of course, these results serve to model the fluorescence from tryptophan residues in proteins. Detailed interpretation of the spectral data is hindered by the strong overlap of the relaxed and the unrelaxed states. In addition, solvent relaxation around NATA is almost certainly more complex than a one-step process. Consequently, the resolution of spectra is not unique. Nonetheless, the results illustrate the potential of resolving relaxed and unrelaxed states of a tryptophan derivative and indicate the expected properties of tryptophan fluorescence in a viscous environment. Similar data obtained from proteins may yield further insights into the rates of spectral relaxation of tryptophan fluorescence from proteins and thus the dynamic properties of the peptide chains. In total these results illustrate the potential of phase-modulation fluorometry in the analysis of time-dependent spectral shifts on the nanosecond time scale.
2. Theory
The theory of phase-modulation analysis of excited-state processes was described in detail in the preceding paper. In this section we summarize the results and equations necessary for understanding the data presented in the current paper.
Consider an excited-state reaction in which an initially excited fluorophore (F) decays by return to the ground state with a rate constant ΓF and by reaction with a rate constant k1. Reaction yields a new species R whose emission is red shifted relative to F. The R state is assumed to decay with a rate constant . We assumed that the reaction is irreversible and that the lifetimes of the F and R states are individually independent of emission wavelength. Hence, in regions of nonoverlap between these emissions the phase and modulation values are expected to be constant. Because of the assumed irreversibility these values are only dependent upon the kinetic constants of the appropriate state. In regions of spectral overlap the phase and modulation values are dependent upon wavelength. For simplicity, we have not listed separately the rates of radiative (λ) and nonradiative (k) decay. The total decay rates are ΓF = λF + kF and ΓR = λR + kR.
The lifetime of the F state is given by τF = (ΓF + k1)−1. Under favorable circumstances emission from the F state may be separately observable on the blue side of the emission. This lifetime may be obtained from either the phase angle (ϕF) or the demodulation factor (mF) of its emission,
| (1) |
| (2) |
where ω is the circular frequency of the sinusoidally modulated exciting light.
The phase angle (ϕR) and the demodulation factor (mR) of the reacted state, when measured relative to the exciting light, do not directly yield the lifetimes by the usual expressions [13], which are similar to eqs. 1 and 2. These measured parameters are instead dependent upon the kinetic constants of both the F and R state [1].
| (3) |
| (4) |
However, the intrinsic properties of the R state can be measured directly by phase-modulation fluorometry. Wavelengths must be chosen which allow each state to be observed independently. Then the phase difference between the R and F states (Δϕ = ϕR – ϕF) and the demodulation factor between these states (mR/mF) can be used to calculate the intrinsic lifetime of the R state τR, assuming this state could be excited directly.
| (5) |
| (6) |
We note that similar expressions, which contain only the kinetic constants of the R state. apply for reversible excited-state reactions [1].
The relatively simple equations listed above allow one to quantify the rates of excited-state processes. The simple two-state model, in which the lifetimes of each state are independent of wavelengths, can be further analyzed by phase-modulation methods. The wavelength-dependent phase (ϕ(λ) and modulation (m(λ)) values permit calculation of the emission spectrum of the F and R states. Assume these states can be observed independently on the blue and red sides of the emission, respectively. Then the fractional intensity of each state can be calculated from
| (7) |
| (8) |
where m(λ) and ϕ(λ) are the wavelength-dependent modulations and phase angles, and mF, mR, and ϕF, ϕR are the modulation and phase values observed on the blue and red sides of the emission. These fractional intensities, and the steady-state emission spectrum wavelengths (λ), can be used to calculate the spectra of the unreacted (IF(λ)) and the reacted (IR(λ)) states using
| (9) |
| (10) |
where I(λ) is the steady-state emission spectrum.
Phase-modulation methods can also be used to distinguish between an excited-state process and ground-state heterogeneity. If the emission at a given wavelength results from an excited-state process then the apparent phase and modulation lifetimes increase with increased modulation frequency, phase angles can exceed 90°, and the ratio m/cos ϕ can exceed unity. Observation of any of these effects proves that the observed emission was not formed by direct excitation. These unique features are a result of the phase angles of each emitting species adding together and the total demodulation being the product of the individual demodulation factors. Use of trigonometric relations allows one to demonstrate from eqs. 1 and 3 that
| (11) |
where is the intrinsic phase angle of the R state, . Furthermore, eq. 4 yields
| (12) |
where
| (13) |
Using eqs. 11 and 12 one may readily show that the ratio mR/cos ϕR is larger than unity for nonzero values of ϕF and . Ratios larger than unity are equivalent to apparent phase lifetimes (τP) which are larger than the apparent modulation lifetimes (τm). In addition, the additive nature of the individual phase angles results in the increase in apparent lifetime with modulation frequency and the possibility of phase angles in excess of 90°. Eqs. 1–13 were used in our analysis of the two-state reactions, i.e., protonation of acridine and exciplex formation by anthracene.
We also examined solvent relaxation around the fluorophores PRODAN, TNS and NATA. In these instances it seems unlikely that spectral relaxation occurs in a single step. In fact, our data for PROCAN in butanol proved that more than a single step is involved in spectral relaxation. This proof involved measurement of the ratio m/cos ϕ relative to the blue edge of the emission, (m/cos ϕ)RF. For a single-step reaction (m/cos ϕ)RF is always less than or equal to unity. If (m/cos ϕ)RF ⩾ 1 then the long wavelength emission is not formed directly from the F state, but instead through an intermediate state [1].
It is instructive to note the effects of multiple-step relaxation on the iifetimes observed on the blue edge of the emission. These values are
| (14) |
| (15) |
where n is the number of steps. As n becomes large the spectral relaxation becomes continuous rather than stepwise [23]. If spectral overlap of the emission from the various states does not prevent observation of ϕF or mF, then ϕF approaches zero and mF approaches unity as n increases. Hence, both the apparent phase and modulation lifetimes approach zero. In contrast, for a one-step reaction, these lifetimes are constant values (eqs. 1 and 2). If spectral overlap is not dominant then the phase and modulation data on the blue edge of the spectrum can distinguish between a one-step and a continuous-relaxation process.
Phase-sensitive detection of fluorescence [15,21] was used for both our studies of excited-state reactions and of solvent relaxation. Assume emission occurs from two states (F and R). and that each state has a characteristic phase angle. Then for sinusoidally modulated excitation the fluorescence intensity is
| (16) |
where ki are constants which depend upon the sample. When examined with a phase-sensitive detector a nonmodulated signal is observed which is dependent upon the detector phase angle ϕD;
| (17) |
By variation of ϕD, the contribution of the F and R states can be varied. Choice of |ϕD – ϕi| = 90° allows the contribution of either species to be totally suppressed. Then the directly recorded emission spectrum is superimposable on the steady-state spectrum of the unsuppressed species.
3. Instrumentation and procedures
All fluorescence spectral data were obtained using a phase-modulation spectrofluorometer [13] from SLM Instruments, Inc. Steady-state data were obtained in this same instrument by disconnecting logic level signals which normally control the modulation tank and its amplifiers. The experiments required measurement of phase shifts and demodulation factors at various emission wavelengths. Such measurements are frequently complicated by the wavelength-dependent time response of the photomultiplier tubes. We minimized this potential problem by the use of reference solutions in place of the usual scattering solutions [20]. These reference solutions have known fluorescence lifetimes As a result, the phase angles and modulations observed for these solutions are readily transformed to yield the phase and modulation of the exciting light, now free of wavelength- and geometry-dependent effects. The reference solutions were either p-bis[2-(5-phenyloxazolyl)]benzene (POPOP) or 1,4-bis[2-(4methyl-5phenyloxazolyl)]benzene in ethanol. The reference lifetimes used for these solutions were 1.35 and 1.45 ns, respectively [20].
Phase-sensitive fluorescence spectra were obtained using a lock-in amplifier, as described previously [15,21]. Phase-sensitive detection is performed on the low frequency cross-correlation signals. The reference channel of the phase-modulation fluorometer is used as the reference signal for the lock-in amplifier. Details of the samples and the spectral conditions used can be found in the figure legends.
4. Results
4.1. Excited-state protonation of acridine
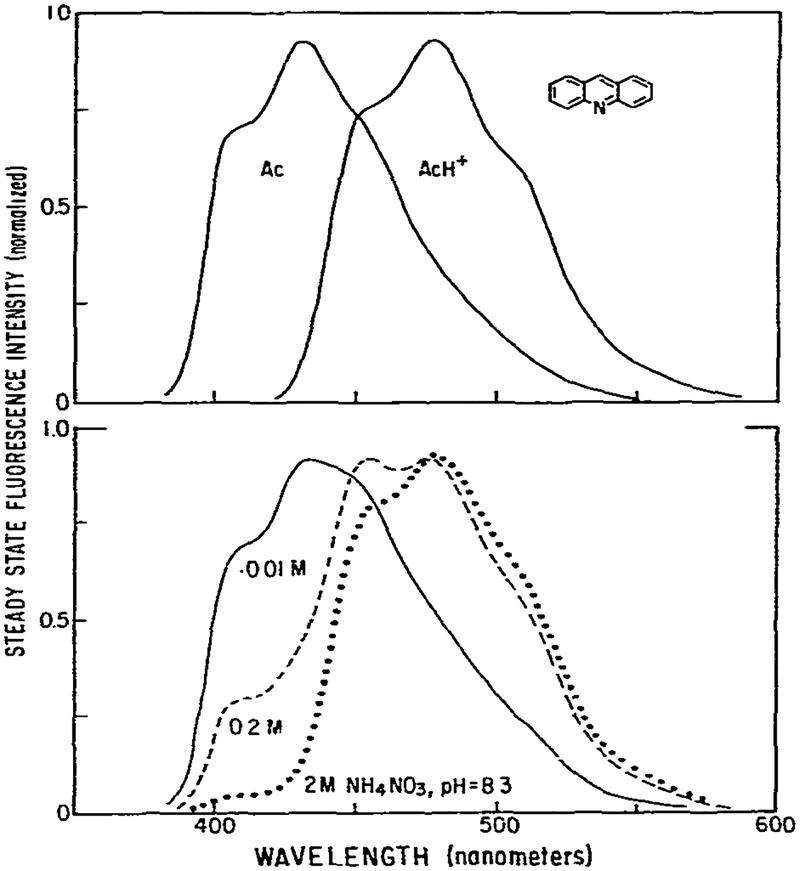
The fluorescence emission spectra of acridine in aqueous solution are highly dependent upon pH and the concentration of proton donors. In basic solution an emission maximum of 430 nm was observed (fig. 1). Upon acidification this spectrum was replaced by a red-shifted spectrum with an emission maximum of 475 nm. The former spectrum is due to neutral acridine (Ac) and the latter is due to the acridinium cation (AcH+). Since the ground-state pKa of acridine is 5.45, only the neutral species is present at pH 8.3. Nonetheless, increasing concentrations of ammonium ion, at pH 8.3, yield a progressive quenching of the short wavelength emission with concomitant appearance of the emission from the acridinium ion (fig. 1). These spectral shifts are results of protonation of the excited neutral acridine molecule by ammonium. Protonation occurs because excitation results in an increase in the pKa of acridine to 10.7 [7].
Fig. 1.
Fluorescence emission spectra of acridine. Spectra are shown of the neutral and protonated forms of acridine (top) and of acridine with increasing concentrations of ammonium ion (bottom). Excitation was at 340 nm using a 10 nm band pass interference filter. The emission band pass was 8 nm. The temperature was 20°C. Solutions were not purged with inert gas. The acridine concentration was 2 × 10⁻⁵ M.
This excited-state reaction is a useful model for testing the phase-modulation theory described in the previous paper [1]. It is a two-state process which is essentially irreversible. Time-resolved studies by Gafni and Brand [7] demonstrated that at 410 nm the decay is a single exponential. At 560 nm the fluorescence decay can be described with two lifetimes, one of which is the same as observed at 410 nm. Using a pulse fluorometer we obtained essentially identical results. The two lifetimes were independent of emission wavelength but the preexponential factors were dependent upon emission wavelength [11]. These data imply that the lifetime of each species (AC and AcH+) is constant across its emission spectrum, and that our irreversible two-state theory is adequate to describe this excited-state process. Hence, the excited-state protonation of acridine provides an ideal model system to verify the simplest case of our theory. In addition, a moderate degree of complexity is provided by the spectral overlap at wavelengths larger than 410 nm. Examination of the emission spectra (fig. 1) reveals a region where only the neutral species emits (390–410 nm), a region of strong overlap (440–500 nm), and a region of moderate overlap where the spectrum is dominated by the AcH+ emission (⩾ 500 nm).
4.2. Effects of the excited-state protonation upon the phase angles of the emission
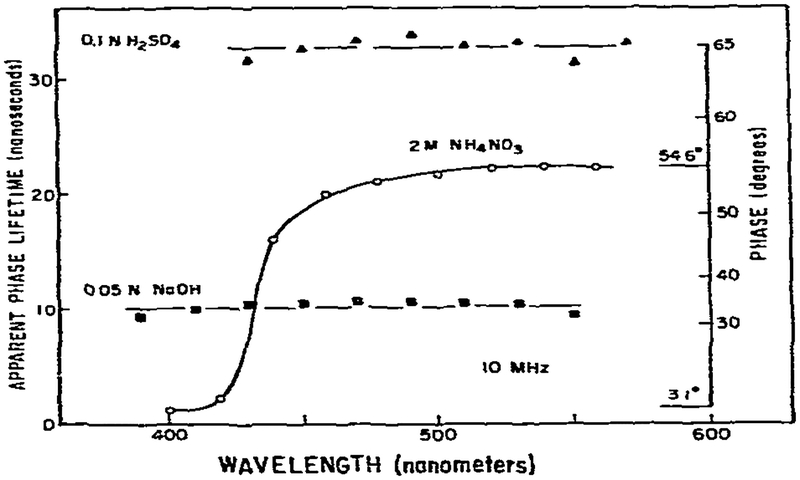
The apparent phase lifetimes (τP) for acridine in 0.05 N NaOH, 0.1 N H2SO4 and 2 M NH4NO3 as observed the phase method, are shown in fig. 2. In the acidic and basic solutions, where only one species is present in both the ground and excited states, the lifetimes (or phase angles) are independent of emission wavelength. In contrast, in 2M NH4NO3 the lifetimes are highly dependent upon wavelength because of protonation of acridine subsequent to excitation. At short wavelengths (410 nm) where neutral acridine emits we found that the lifetimes decrease according to the Stem-Volmer equation with a dynamic quenching constant for ammonium ion of 0.78 × 10⁹ M−1 s−1, in agreement with earlier reports [7]. For this calculation, we assumed equaled 8.51, as calculated from the pKa of ammonium ion (9.23). At longer wavelengths the apparent lifetime increased until a nearly constant value is reached for wavelengths longer than 500 nm. In this wavelength range the emission is dominated by the acridinium ion. The constant lifetime, or more correctly phase angle, on the red and blue sides of the emission may be regarded as evidence for the two-state model. In contrast, if the overall emission were shifting to longer wavelengths according to the continuous Bakhshiev model such constant regions are not expected [14,23]. Overall, the phase data for acridine may be regarded as typical for a two-state reaction with moderate spectral overlap. These characteristics are a decrease in lifetime on the blue side of the emission, an increase in lifetime with emission wavelength and nearly constant lifetimes on the blue and red sides of the emission.
Fig. 2.
Apparent phase lifetimes of acridine. The inserted axis indicates the phase angles relative to the exciting light. The phase angle difference between the red (ϕR) and blue (ϕF) regions of the emission reveals the lifetime of the acridinium cation. We note that measured phase angles. relative to the exciting light, do not yield true lifetimes For the acridinium cation (eq. 3 and ref. 1). Additional experimental details are given in the legend to fig. 1.
4.3. Direct measurement of the lifetime of the reaction products
An interesting potential of phase fluorometry is the ability to measure directly the intrinsic lifetime of the reacted species. Although the protonation of acridine is essentially irreversible the intrinsic lifetime of the reacted species can also be measured for reversible excited-state reactions [1]. By intrinsic we mean the lifetime which would be observed if this species were formed by direct excitation rather than by an excited-state reaction. The intrinsic lifetime of the reacted species is revealed by the phase difference (Δϕ) between the blue and red sides of the emission (Δϕ = ϕR – ϕF). Such measurements are readily performed using commercially available instrumentation, and this procedure is illustrated by the insert on fig. 3. For example, consider the phase difference between 400 and 560 nm shown on fig. 2. This phase angle difference (Δϕ = 51.5°) yields the lifetime of the acridine cation (τ(AcH+)) according to
| (18) |
One may understand this simple result by realizing that the excited neutral acridine population is in fact the origin of the excited acridinium molecules, and thus the excitation pumping function. The calculated lifetime in 2 M NH4NO3 is 20 ns, which is considerably shorter than that of acridinium in 0.1 N H2SO4 (30 ns). In this instance the shorter value is a result of quenching of the emission by NH4NO3, and not spectral overlap of the emission of acridine and acridinium (see below).
Fig. 3.
Fluorescences lifetime of acridinium as observed by the phase angle difference between the short- and long-wavelength regions of the emission. The wavelengths chosen for measurement of the F and R states were 400 and 560 nm. respectively. The phase difference between the F and R states reveals the intrinsic lifetime of the directly excited R state (eq. 5).
More detailed measurements of Δϕ are shown in fig. 3. Clearly, Δϕ is not constant, as might be expected for the emission of acridinium. At low concentrations of ammonium ion the apparent lifetimes of acridinium are shorter than the expected value of 30 ns. This is a result of the low emission intensity of acridinium, and the greater relative importance of the emission of neutral acridine at 560 nm. In this differential-wavelength phase measurement the emission at 560 nm of the directly excited neutral acridine acts as a zero-lifetime component, thereby shortening the apparent lifetime of the acridinium. At higher ammonium concentrations the measured lifetimes become longer, but a value of 30 ns is not observed due to quenching of the acridinium emission by NH4NO3. These results were confirmed by pulse measurements in which we deconvoluted the 560 nm emission using the time-response observed at 400 nm [11]. This differential-wavelength deconvolution method also reveals the lifetime of the reacted species, irrespective of the reversibility or irreversibility of the reaction. In addition, this deconvolution method yields the relative intensity of the initially excited state at the longer observation wavelengths [11]. These time-resolved measurements confirmed the presence of neutral acridine emission at 560 nm. We conclude that wavelength-differential phase measurements can provide reliable lifetimes of reacted species providing spectra1 overlap is corrected for or minimized.
4.4. Proof of an excited-state process by comparison of apparent phase and modulation lifetimes
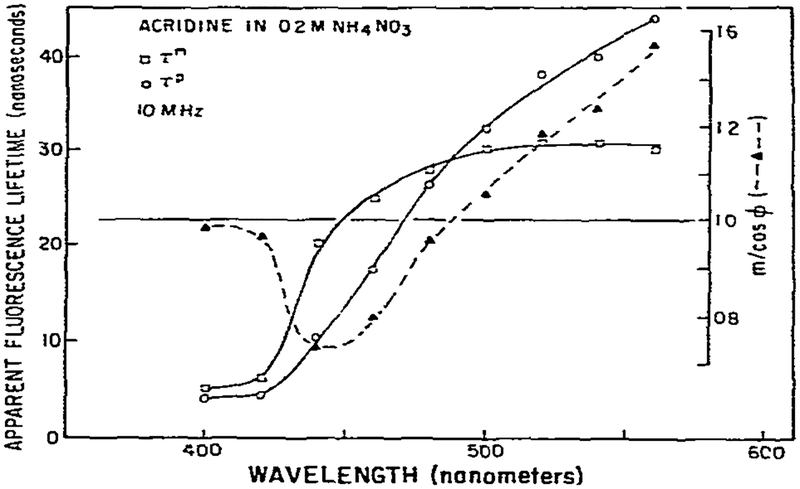
Phase measurements alone, at a single modulation frequency, cannot be used to calculate the individual lifetimes in samples which display more than a single lifetime. Hence, the increase in phase angle at long wavelengths shown in fig. 2 could also be attributed to a second directly excited fluorophore with a longer lifetime. Of course. the decrease in the phase lifetime at short wavelengths indicates a quenching process. A rigorous proof of the presence of an excited-state process is obtainable by comparison of the phase shift and demodulation data from the same sample. Fig. 4 shows apparent phase and modulation lifetimes for acridine in 0.2 M NH4NO3, and the ratio m/cos ϕ. On the blue edge τP ≃ τm and m/cos ϕ ≃ 1, indicative of a single-exponential decay [13] and thus, an irreversible reaction [12]. In the central overlap region, τP ⩽ τm and m/cos ϕ ⩽ 1, which is indicative of heterogeneous emission [13]. The most interesting and informative results were observed for wavelengths longer than 500 nm where τP ⩾ τm and m/cos ϕ ⩾ 1. Such results are impossible for an exponential decay or for any degree of heterogeneity. This observation proves that the emission at these longer wavelengths was not a result of direct excitation, but rather a result of an excited-state process [1,5,14].
Fig. 4.
Apparent phase and modulation lifetimes of acridine. Also shown is the wavelength dependence of m/cos ϕ.
For the species formed subsequent to excitation (R) the ratio m/cos ϕ is given by
| (19) |
where τF is the lifetime of the unrelaxed state (6 ns, fig. 4) and τR is the intrinsic lifetime of the relaxed state (23 ns, fig. 3). The calculated value of 2.20 is larger than the observed value of 1.4. The observed ratio is significantly less than the expected value. We note that m/cos ϕ and τP are not constant with increasing wavelength, but rather increase monotonically. This implies spectral overlap, since m/cos ϕ and τP would be constant if only single species were being observed [1]. Spectral overlap of the directly excited acridine fluorescence caused the decreased value of m/cos ϕ when compared with the value calculated from eq. 19. However, irrespective of the interference due to spectral overlap, the observation of m/cos ϕ greater than unity proves the occurrence of an excited-state process.
4.5. Differential-wavelength measurements of m/cos ϕ
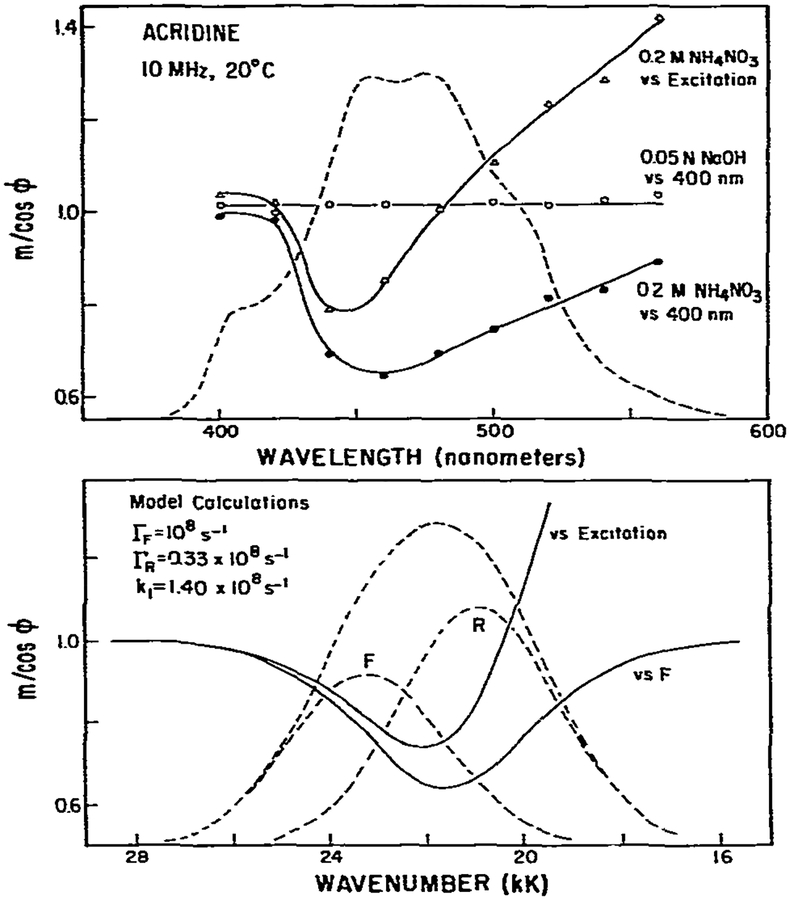
In the previous paper [1], we demonstrated that for a one-step excited-state process m/cos ϕ of the relaxed state, when measured relative to the initially excited state, is unity. We will call this measured value (m/cos ϕ)RF. In constrast, if spectral relaxation involves two or more steps, then (m/cos ϕ)RF can exceed unity. Since the acridine-acridinium system is a well documented one-step reaction, we used this model system to test these predictions. We measured m/cos ϕ relative to the emission at 400 nm (fig. 5). For neutral acridine (m/cos ϕ)RF is unity at all wavelengths, as is expected for a single-exponential decay. In contrast, for acridine in 0.2 M NH4NO3 (m/cos ϕ)RF is less than unity at wavelengths near 450 nm and approaches unity at longer wavelengths. The decrease in (m/cos ϕ)RF near 450 nm is due to spectral overlap of the emission from acridine and acridinium. The failure of (m/cos ϕ)RF to reach unity at longer wavelength is a result of the same spectral overlap, the extent of which is diminished at longer wavelengths.
Fig. 5.
Measurement and model calculations of m/cos ϕ. Measurements of m/cos ϕ were performed relative 10 the exciting light and relative to the emission at 400 nm. Also shown are model calculations using parameters comparable to the acridine-acridinium system. The emission of the F and R states was assumed to be centered at 430 and 478 nm, respectively, and the standard deviations of the assumed Gaussian distributions were both assumed equal to 1.6 kK (1 kK= 1000 cm−1).
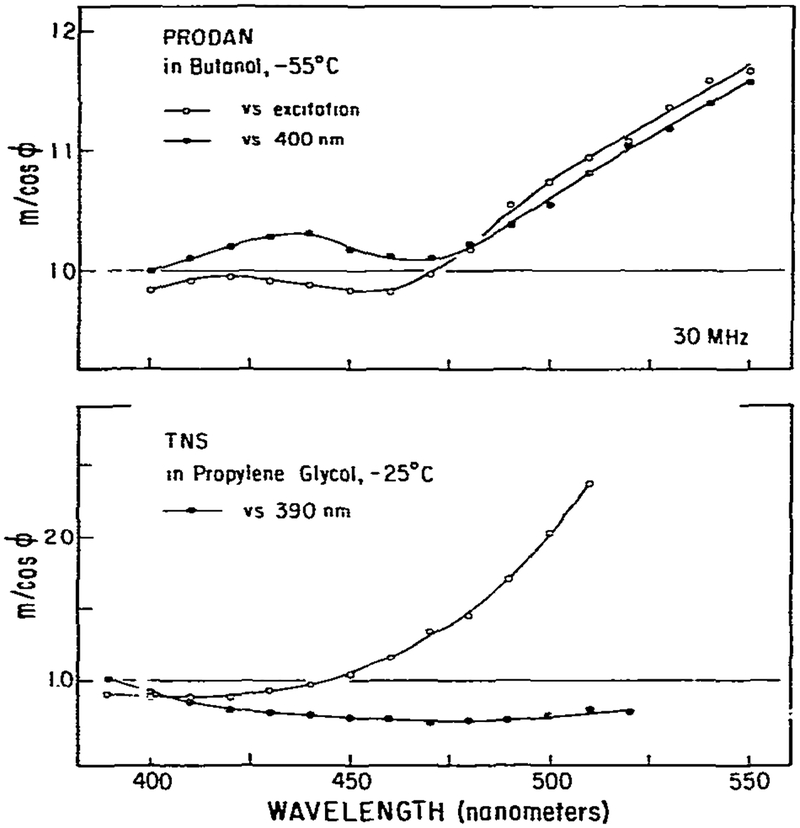
Also shown in fig. 5 are the results of model calculations. The rate constants were chosen to be similar to those known for acridine. The object of these model calculations was to illustrate the known origins of the (m/cos ϕ)RF values, not to model precisely the acridine data. Hence, we used Gaussian distributions to represent the emission from acridine and acridinium. On the high wave number side of the emission both m/cos ϕ and (m/cos ϕ)RF are unity, as was observed for acridine-acridinium. In the central overlap region m/cos ϕ and (m/cos ϕ)RF are both less than unity, and the minimum values are in good agreement with the observed values. On the low wave number side of the emission (m/cos ϕ)RF approaches unity and m/cos ϕ ⩾ 1, again comparable with the experimental data. In total, these data are consistent with a one-step reaction in which the emission of both states overlap at all usable wavelengths on the red side of the emission. If the excited-state reaction proceeded as a two-step process (m/cos ϕ)RF values could exceed unity. We observed such behavior for PRODAN in n-butanol due to solvent relaxation (fig. 13). It appears that measurements of m/cos ϕRF can be useful in indicating the complexity of excited-state processes.
Fig. 13.
Measurement of m/cos ϕ for PRODAN and TNS in viscous solvents. Excitation of PRODAN and TNS was at 340 nm. The concentrations were 2 × 10⁻⁵ and 5 × 10⁻⁵ M. respectively. The emission band pass was 8 nm.
4.6. Resolution of the individual emission spectra by phase-sensitive detection of fluorescence
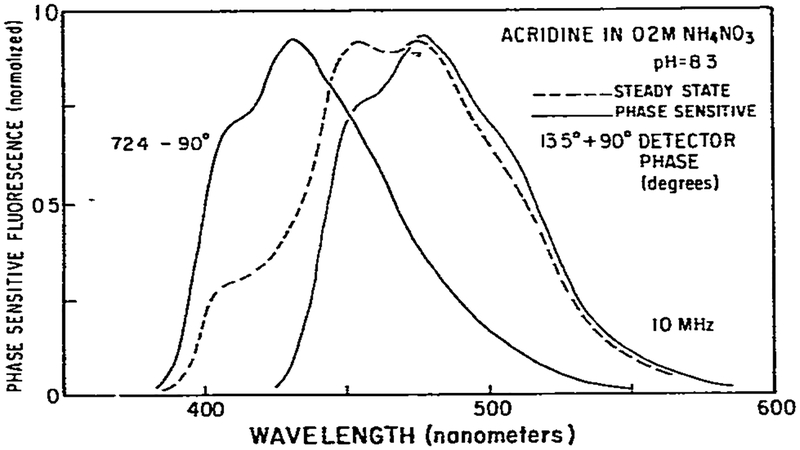
The above data indicated a simple two-state reaction in which each species displayed a wavelength-independent lifetime. Proof may be obtained by the use of phase-sensitive fluorescence spectroscopy [15]. Consider intensity-modulated excitation of a solution which contains two fluorescent components which have wavelength-independent lifetimes. Each emission will display wavelength-independent phase angles ϕF and ϕR. One cau choose the detector phase ϕD, to be 90° out of phase with either component, i.e., |ϕD – ϕi| = 90°. The phase-sensitive fluorescence spectrum then contains contributions only from the unsuppressed component, and the recorded phase-sensitive emission spectrum will superimpose on the steady-state spectrum of the unsuppressed component.
Fig. 6 shows such spectra for acridine in 0.2 M NH4NO3. We chose this concentration because the emission of each species is present in nearly equal amounts, as may be judged from the steady-state emission spectra (dashed line). By choice of the appropriate detector phase angle we were able to obtain phase-sensitive spectra which overlapped precisely with the steady-state spectra of either neutral or charged acridine. Similar results were obtained for ammonium concentrations ranging from 0.2 to 2 M (table 1). The ability to obtain overlap of steady-state and phase-sensitive spectra proves that only two species are present and that the lifetime of each species is not dependent upon emission wavelength. If the lifetime of either species were wavelength dependent then it would be impossible to suppress its entire emission spectrum using a single detector phase angle. Some portion of the emission would always be partially in phase with the detector. As a result, the unsuppressed part of the spectrum would distort the phase-sensitive spectrum of the second component and this phase-sensitive spectrum could not overlap with either steady-state emission spectrum. Thus, the results presented in fig. 6 prove that only two spectral components with wavelength-independent lifetimes are present.
Fig. 6.
Phase-sensitive fluorescence spectra of acridine in 0.2 M ammonium nitrate. These phase-sensitive spectra are identical to the steady-state spectra of acridine in 0.05 N NaOH (left) and in 0.1 N H2SO4 (right).
Table 1.
Detector phase angles required for phase suppression of neutral and protonated acridine
| Frequency (MHz) | [NH4NO3] | Phase angle (°)a of | |
|---|---|---|---|
| Ac | AcH+ | ||
| 10 | 0.2 | 13.5 | 72.4 |
| 0.5 | 8.0 | 65.0 | |
| 2.0 | 0.7 | 54.4 | |
| 30 | 0.2 | 37.8 | 112.9 |
| 0.5 | 18.4 | 107.0 | |
| 2.0 | 6.6 | 87.9 | |
These phase angles were calculated from the phase angles needed to suppress each component from the phase-sensitive emission spectrum.
4.7. Measuremeat of wavelength-dependent phase angles from phase-sensitive fluorescence spectra
Phase-sensitive fluorescence spectra can also reveal wavelength-dependent phase angles. Typical phase-sensitive spectra are shown in fig. 7. From the spectrum obtained with ϕD = 101° one may judge that the phase-sensitive intensities from 390 to 430 nm will all be zero at a similar detector phase angle. This result indicates that the phase of the emission is relatively constant from 390 to 430 nm. The spectra at ϕD = 131, 151 and 171° reveal the phase angles which increase continually at wavelengths longer than 450 nm, as indicated by phase-sensitive intensities of zero at longer wavelengths. This point is illustrated more dramatically in fig. 8, where we have plotted the phase-sensitive intensities vs. detector phase angle. The top panel illustrates the constant zero-crossing angle for wavelengths ranging from 395 to 420 nm. The lower panel illustrates how the spectral overlap in the long wavelength region results in increasing phase angles with increasing wavelength. Automated data storage and manipulation methods will facilitate the use of phase-sensitive fluorescence spectra to obtain the wavelength-dependent phase angles.
Fig. 7.
Phase-sensitive fluorescence spectra of acridine in 0.2 M ammonium nitrate.
Fig. 8.
Wavelength dependence of the phase angles and apparent fluorescence lifetime as revealed by the phase-sensitive fluorescence spectra The values in square brackets are the apparent lifetimes calculated from the zero crossing points.
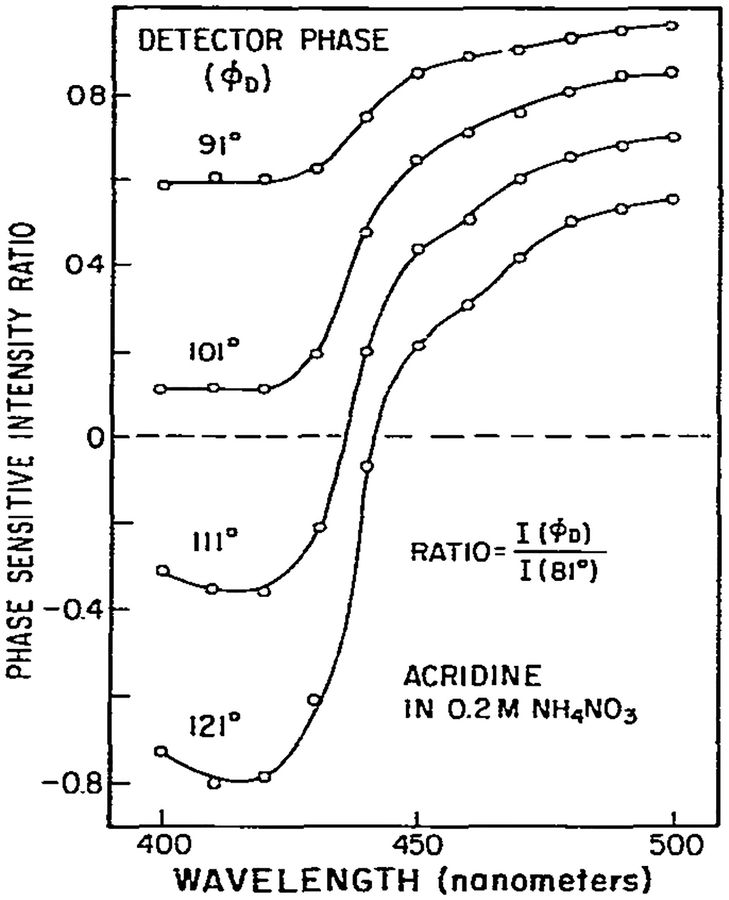
An alternative method for identifying regions of constant phase angle is to form ratios of phase-sensitive spectra at various detector phase angles (fig. 9). For regions of constant phase angles these ratios are also constant. This procedure may be of value in the analysis of unknown multicomponent samples. Once a region of constant phase is identified, one may remove this component from the entire spectrum, and then further analyze the remainder. A similar procedure was described for infrared spectra [16].
Fig. 9.
Wavelength dependence of the ratio of phase-sensitive fluorescence intensities at various detector phase angles. The spectrum obtained at ϕD = 81° was chosen as the reference spectrum.
4.8. Proof of an excited-state process by phase-sensitive detection of fluorescence
The decreasing intensity and lifetime of neutral acridine indicated an excited-state reaction with ammonium ion, and observation of m/cos ϕ ⩾ 1 proved the presence of an excited-state reaction. However, one may desire additional proof that the longer-lived or longer-wavelength species is formed by an excited-state reaction, and not from direct excitation. In favorable cases such proof may be provided by the observation of phase angles in excess of 90°. For directly excited species the phase angles cannot exceed 90°, even for infinitely long lifetimes. However, because of the additive nature of the individual phase angles, ϕR can exceed 90° (eq. 11). This was observed for acridine in NH4NO3 (table 1). For 0.2M NH4NO3 the phase angle of the acridinium emission was 113° at 30 MHz. This value was calculated from the phase angle required for suppression of this component (23°). These angles provide clear proof of an excited-state process.
We note an advantage of phase-sensitive detection of fluorescence for measurement of the phase angles of components in a mixture. Our ability to measure the phase angle of the acridinium emission was not compromised by the overlap of its emission spectrum with that of neutral acridine. Knowledge of the steady-state emission spectrum of the neutral species permitted selection of ϕD to completely suppress acridinium emission. In contrast, direct measurement of the phase angle of the emission at a given wavelength does not yield the actual phase of the emission from either species because of spectral overlap at most usable emission wavelengths.
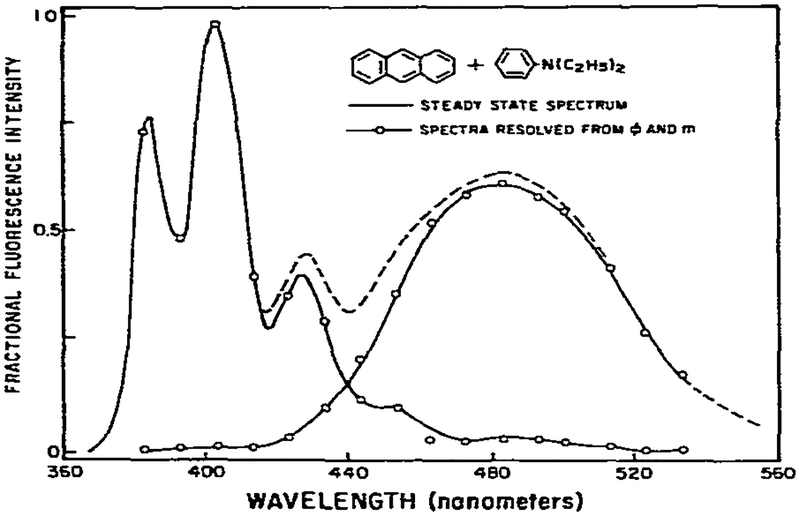
4.9. Resolution of the emission spectrum of anthracene and its exciplex with diethylaniline
In our studies of the excited-state protonation of acridine, we had available control samples which displayed the emission spectra of each species. This is not always the case, as is illustrated by the formation of a charge-transfer complex between anthracene and diethylaniline. In this instance, the long wavelength exciplex emission cannot be observed in the absence of the shorter wavelength anthracene emission. However, the individual spectra can be calculated from the phase-modulation data measured across the emission spectra (fig. 10). It is apparent that the values of ϕ and m are constant on the blue and red sides of the emission and these data are adequate to calculate the emission spectra of both the monomeric and complexed forms of anthracene (fig. 11). These calculated spectra agree precisely with those obtained previously using phase-sensitive detection of fluorescence [15]. The ability to decompose the steady-state spectra into two spectra which sum to match the steady-state spectrum demonstrates that the two-state model is adequate. If additional species were present, the decomposition would not be successful. We note that this experiment was not designed to detect minor components. Additional data acquisition and analysis would be required. Rather, our objective in this and all the above descriptions was to demonstrate the use and feasibility of using phase-modulation methods in the analysis of simple excited-state reactions.
Fig. 10.
Phase angles and demodulation factors for anthracene and its exciplex with diethylaniline. Anthracene was dissolved in toluene and the concentration of diethylaniline was 0.2 M. The excitation was at 357 nm. and the excitation and emission band passes were both 8 nm. The solution was not purged with inert gas. The temperature was 20°C.
Fig. 11.
Resolution of the monomer and exciplex emission of anthracene. The spectra were calculated using eqs. 7–10 and the data shown in fig. 10.
4.10. Spectral relaxation in viscous solvents
In the preceding sections we examined the excited-state protonation of acridine in detail. We described a variety of measurements, each easily performed using a phase fluorometer, which reveal the kinetics of excited-state processes. In the following sections we present similar measurements for the more complex case of solvent relaxation around the excited states of solvent-sensitive fluorophores. This process is an important determinant of the emission spectra of fluorophores bound to proteins and membranes [5,6,8,17,18].
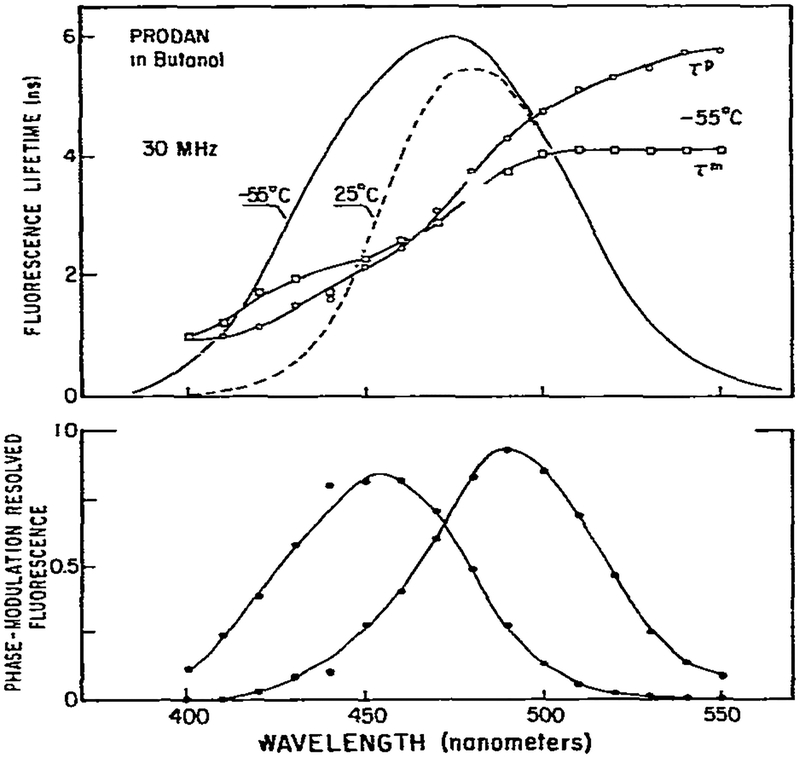
The emission spectrum of PRODAN is highly sensitive to the polarity and viscosity of the solvent [8]. For comparison purposes we show the spectra of PRODAN in n-butanol at −55°C where relaxation is incomplete and at 25°C where relaxation is essentially complete. At low temperature (−55°C), the apparent lifetimes are highly dependent upon emission wavelength (fig. 12) and these values increase with increasing wavelength. At wavelengths longer than 470 nm we found τP > τm. The observation of phase lifetimes which are larger than the modulation lifetimes at long emission wavelengths proves emission is preceded by an excited-state process.
Fig. 12.
Resolution of the initially excited and relaxed states of PRODAN from the wavelength-dependent phase and modulation lifetimes. The top panel shows the apparent phase and modulation Iifetimes at −55°C. Also shown are the steady-state emission spectra at −55 (–––) and 25°C (– – –). Exitation was through a 340 nm interference falter with a band pass of 10 nm. Emission was observed with monochromator and a bandwidth of 8 nm. Polarizers were placed in the excitation and emission beam to eliminate the effects of Brownian rotation [23]. The concentration of PRODAN was 2 × 10⁻⁵ M. The lower panel shows the spectra calculated using eqs. 7–10. We assumed the phase and modulation values measured at 400 and 550 nm were those of the F and R states, respectively.
We used the wavelength-dependent phase and modulation data to calculate the emission spectra of the relaxed and the unrelaxed states (eqs. 7–10). These calculated spectra are shown in the lower panel of fig. 12. The spectrum calculated for the relaxed state is comparable to the steady-state spectrum observed at 25°C. The spectrum calculated for the unrelaxed state has an emission maximum of 450 nm, which is considerably longer than the emission maximum of PRODAN in nonpolar solvents [8]. Probably, this spectrum represents an intermediate state in a complex relaxation process. In addition, we recognize that the spectra calculated from the phase and modulation data are not unique, since the relaxation is probably a multistep process and the red and blue edge phase and modulation values do not represent a single species. Under these conditions, a unique decomposition of spectra is not expected [19]. Nonetheless, these results demonstrate the feasibility of calculating such spectra from wavelength-dependent phase and modulation data. More detailed analysis of similar data from biopolymer-bound fluorophores should reveal information about relaxation processes in proteins and membranes.
An interesting property of PRODAN is its two well defined sites of interactions with the solvent [9]. As a result, we expect solvent relaxation to require at least two steps. In the previous theoretical paper we demonstrated that a multistep relaxation process could be proven by m/cos ϕ measurements relative to the blue edge of the emission, (m/cos ϕ)RF. If only a single step occurs then (m/cos ϕ)RF ⩽ 1. However, if there are two or more steps in the relaxation process then (m/cos ϕ)RF can be greater than unity. Measured values of (m/cos ϕ)RF are shown in fig. 13. Clearly, these values are in excess of unity for wavelengths greater than 475 nm, irrespective of whether the measurements are performed relative to the PRODAN emission at 400 nm or relative to the exciting light. These data prove that spectral relaxation of PRODAN requires more than a single step.
Contrasting data were obtained for TNS in propylene glycol at −25°C. When measured relative to the exciting light m/cos ϕ is well in excess of unity, proving the existence of an excited-state process. However, when measured relative to its own emission at 400 nm, (m/cos ϕ)RF, is less than unity at all emission wavelengths. This result is somewhat surprising, since it seems unlikely that relaxation around TNS is a one-step process. We attribute the disparate results for PRODAN and TNS to be a result of larger spectral overlap of the emission from the states for TNS than for PRODAN. Model calculations can easily simulate patterns of (m/cos ϕ)RF observed for both TNS and PRODAN.
4.11. Solvent relaxation around a tryptophan derivative detected by phase-sensitive detection of fluorescence
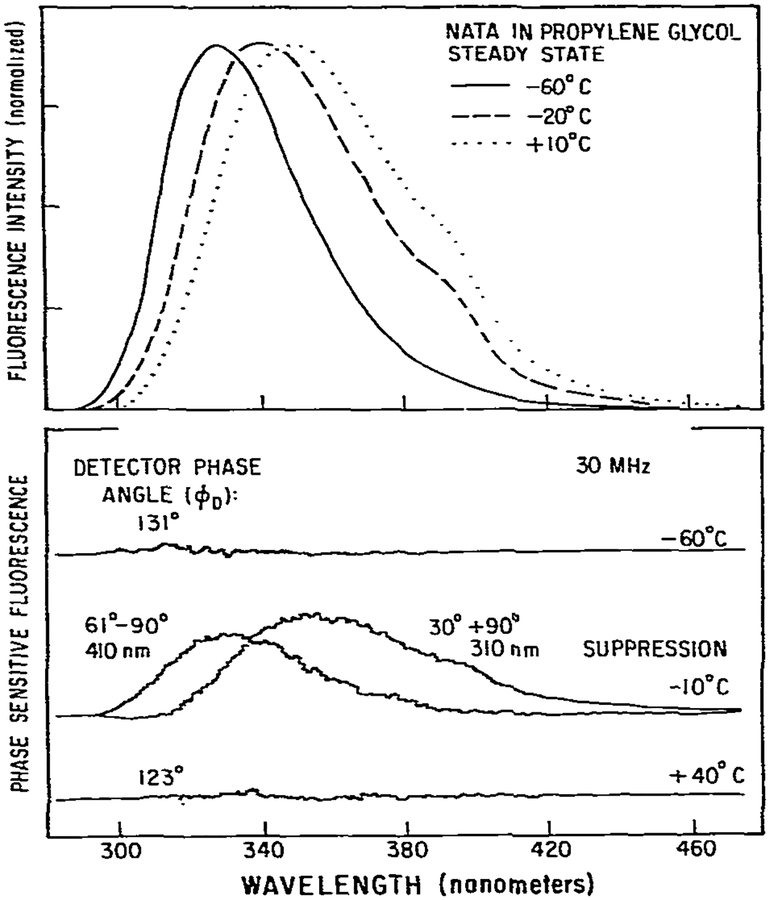
As a final illustration of the potential of phase-fluorometric methods we used phase-sensitive detection of fluorescence to resolve the apparent relaxed and unrelaxed emission of NATA in propylene glycol. At low temperature (−60°C) a blue-shifted emission is observed with maximum at 329 nm (fig. 14). As the temperature is increased the emission maximum shifted to 350 nm at 10°C. At −20°C an intermediate spectrum is observed. Previously, we demonstrated that under these conditions the spectral relaxation time was comparable to the fluorescence lifetime [5,24]. By comparison of these steady-state spectra one can observe that the emission at 310 nm is predominantly a result of the unrelaxed emission, and at 410 nm the emission is predominantly from the relaxed state. We used phase-sensitive detection of fluorescence [15,21] to suppress the emission at these wavelengths, and thus, record only the emission from the other state. At −60°C suppression at 310 nm results in total disappearance of the entire spectrum. At −60°C the emission from the relaxed state is small and is not detected with our current instrumentation. Similarly, at 40°C suppression at 410 nm also suppresses the entire emission, since the emission is dominated by the relaxed state. Substantially different results were obtained at −10°C. At this temperature suppression at 310 nm resulted in a phase-sensitive spectrum with an emission maximum of 352 nm. Suppression at 410 nm resulted in a phase-sensitive spectrum with an emission maximum of 327 nm. These phase-sensitive spectra are comparable to the relaxed (10°C) and unrelaxed (−60°C) spectra. We recognize that the resolution achieved in fig. 14 is not unique, but rather depends upon the wavelengths chosen for suppression. Nonetheless, the high precision of these results indicates that this technique will be useful in studies of dipolar relaxation in proteins which contain a single tryptophan residue.
Fig. 14.
Resolution of the initially excired and relaxed states of N-acetyl-l-tryptophanamide by phase-sensitive detection of fluorescence. Excitation was through a 280 nm interference filter with 10 nm band pass. Emission was observed through a monochromator with a band pass of 8 nm. The concentration of NATA was 5 × 10⁻⁵ M. For the spectra shown polarizers were nor used. Measurements with polarizers set at the magic angle [22] gave equivalent results with a decreased signal-to-noise raatic.
5. Discussion
In the preceding sections we described the results of phase-modulation studies of several excited-state processes. These excited-state processes are comparable to those frequently encountered in fluorescence spectroscopic studies of macromolecules. For example, the protonation of acridine and exciplex formation by anthracene were seen to be two-state reactions. in which the lifetime of the F and R states were independent of wavelength. A similar situation is likely to be found for excimer formation in membranes [25]. for excited-state ionization of protein-bound probes [26], for energy transfer [27] and for excited-state molecular rearrangements [28]. In addition, the simple two-state model may be adequate to analyze data resulting from fluorophores which undergo specific interactions with the solvent. such as exciplex formation by indole in nonpolar solvents [29] and hydrogen bond formation by 2-anilinonaphthalene [30]. Of course, depending upon the sensitivity of the fluorphore to its environment, and the dynamic properties of this environment, the lifetimes of the individual states may not be strictly independent of wavelength. Nonetheless, the model studies of acridine and anthracene serve to illustrate the expected phase-modulation data when similar reactions occur with fluorophores bound to macromolecules.
The emission spectra of fluorophores such as the naphthylaminesulfonic acids and PRODAN are known to be sensitive to solvent polarity. In addition, these spectra are sensitive to the solvent viscosity as a result of solvent reorientation around the dipole moment of the excited state [31]. Solvent reorientation results in time-dependent spectral shifts. Such shifts have been observed for protein- and membrane-bound fluorophores [5,6,17,18,24], and these data can be used to estimate the dynamics of thk probe-binding site on the macromolecule. The data presented for TNS and PRODAN in viscous solvents illustrate the expected phase-modulation data for these and similar fluorophores when bound to macromolecules.
And finally, we examined a tryptophan derivative, NATA, in viscous solvents. Of course these data model the phase-modulation data expected for tryptophan residues in proteins. In this instance we used phase-sensitive detection of fluorescence to resolve the initially excited and solvent relaxed states of NATA in propylene glycol. Spectral overlap of these states prevents an unambiguous spectral resolution. Nonetheless. these data illustrate the potential of phase-sensitive fluorescence methods for the relaxation processes even in this experimentally difficult instance.
In conclusion, the examples presented in this paper illustrate the potential of phase-modulation methods for studies of excited-state processes in macromolecules. Currently, most phase fluorometers are designed to measure phase angles and demodulation factors at a single wavelength. As a result it is somewhat tedious to obtain the wavelength-dependent data required for the analysis of excited-state processes. Relatively minor modification of the instrumentation will allow such data to be collected, stored and manipulated. Combination of these capabilities, with an ability to vary the modulation frequency, is likely to result in a greatly expanded usefulness of phase-fluorometric methods in studies of the dynamic properties of biopolymers.
Acknowledgements
This work was supported by Grant PCM 80-41320 from the National Science Foundation. J.R.L. is an Established Investigator of the American Heart Association. A.B. is on leave from Nicholas Copernicus University, Institute of Physics, Torun, Poland.
Abbreviations:
- PRODAN
6-propionyl-2-dimethylamino-naphthalene
- TNS
2-(p-toluidinyl)-6-naphthalenesulfonic acid
- NATA
N-acetyl-l-tryptophanamide
References
- 1.Lakowicz JR and Balter A. Biophys. Chem 16 (1982) 99. [DOI] [PMC free article] [PubMed] [Google Scholar]
- 2.Bakhshiev NG, Mazurenko Yu.T. and Pirerskaya IV, Optics Spectrosc. 21 (1966) 307. [Google Scholar]
- 3.Veselova TV, Obyknovennaya IE, Cherkasov AS and Shirokov VI, Optics Spectrosc. 33 (1972) 488. [Google Scholar]
- 4.Bauer RK, Kowalczyk A and Baiter A, Z. Naturforsch 32a (1977) 560. [Google Scholar]
- 5.Lakowicz JR Cherek H and Bevan DR, J. Biol. Chem 255 (1980) 4403. [PubMed] [Google Scholar]
- 6.Lakowicz JR and Cherek H, Biochem. Biophys. Res. Commun 99 (1981) 1173. [DOI] [PubMed] [Google Scholar]
- 7.Gafni A and Brand L, Chem. Phys. Lett 58 (1978) 346. [Google Scholar]
- 8.Weber G and Fanis FJ, Biochemistry 18 (1979) 3075. [DOI] [PubMed] [Google Scholar]
- 9.Macgregor RB and Weber G, Ann. N.Y. Acad. Sci 366 (1981) 140. [Google Scholar]
- 10.Lakowicz JR, Bevan DR, Cherek H and Baiter A, unpublished observations. [Google Scholar]
- 11.Lakowicz JR and Balter A, Biophys. Chem (1982) in the press. [Google Scholar]
- 12.R Laws W and Brand L, J. Phys. Chem 83 (1979) 795. [Google Scholar]
- 13.Spencer RD and Weber G, Ann. N.Y. Acad. Sci 158 (1969) 361. [Google Scholar]
- 14.Veselova TV, Limareva LA, Cherkasov AS and Shirokov VI. Optics Spectroscope. 19 (1965) 39. [Google Scholar]
- 15.Lakowicz JR and Cherek H, J. Biochem. Biophys. Methods 5 (1981) 19. [DOI] [PubMed] [Google Scholar]
- 16.Hirschfeld T, Ana. Chem 48 (1976) 721. [Google Scholar]
- 17.Brand L and Gholke JR, J. Biol. Chem 246 (1971) 2317. [PubMed] [Google Scholar]
- 18.Easter JH, De Toma RP and Brand L, Biophys. J 16 (1976) 571. [DOI] [PMC free article] [PubMed] [Google Scholar]
- 19.Veselova TV and Shirokov VI, Izv. Akad. Nauk S.S.S.R., Ser. Fiz 36 (1972) 1024. [Google Scholar]
- 20.Lakowicz JR, Cherek H and Baiter A, J. Biochem. Biophys. Methods 5 (1982) 131. [DOI] [PubMed] [Google Scholar]
- 21.Lakowicz JR and Cherek H, J. Biol. Chem 256 (1981) 6348. [PubMed] [Google Scholar]
- 22.Spencer RD and Weber G, J. Chem. Phys 52 (1970) 1654. [Google Scholar]
- 23.Bakhshiev NG, Mazurenko Yu.T. and Piterskaya IV, Optics Spectrosc. 21 (1966) 307. [Google Scholar]
- 24.Lakowicz JR and Cherek H, J. Biol. Chem 255 (1930) 831. [PubMed] [Google Scholar]
- 25.Galla HJ and Sachmann E, J. Am. Chem. Sot 97 (1975) 4114. [DOI] [PubMed] [Google Scholar]
- 26.Loken MR, Hayes JW, Gohlke JR and Brand I. Biochemistry 11 (1972) 4779. [DOI] [PubMed] [Google Scholar]
- 27.Stryer L, Annu. Rev. Biochcm 47 (1978) 819. [DOI] [PubMed] [Google Scholar]
- 28.Rotkiewicz K, Grabowski ZR and Jasny J, Chem. Phys. Lett 34 (1975) 55. [Google Scholar]
- 29.Walker MS, Bcdnar TW and Lumry R, J. Chem. Phys 45, (1966) 3455. [DOI] [PubMed] [Google Scholar]
- 30.De Toma RP and Brand L, Chem. Phys. Lett 47 (1977) 231. [Google Scholar]
- 31.R Lakowicz J, J. Biochem. Biophys. Methods 2 (1980) 91. [DOI] [PubMed] [Google Scholar]


