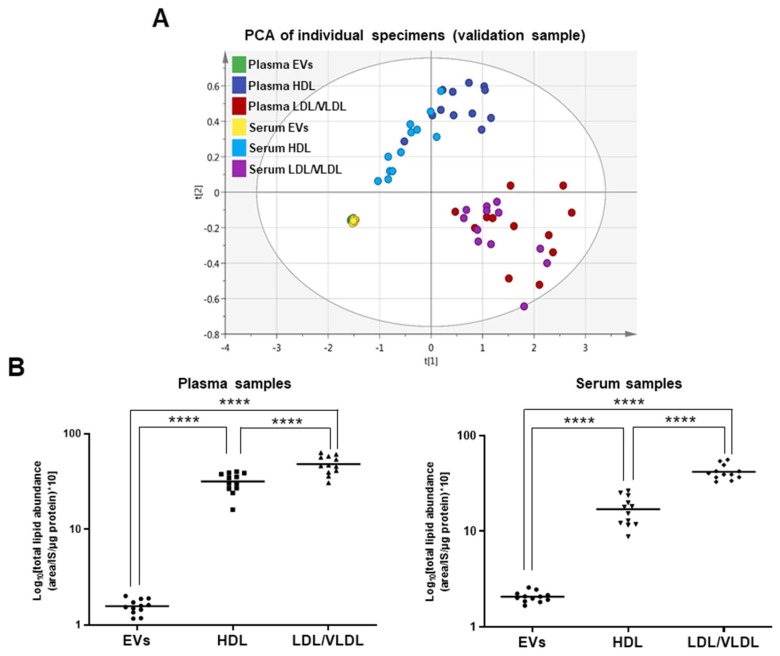
Figure 2.
Comparison of lipid abundance in EV, HDL, and LDL/VLDL fractions in validation sample. (A) Lipid profiles of EVs, HDL, and LDL/VLDL obtained from human plasma or serum (n = 12 per group) analyzed by PCA. Analysis was performed using absolute lipid abundance (area IS−1 μg−1 protein). Goodness-of-fit parameters R2X and Q2 were 0.911 and 0.892, respectively. (B) Differences in absolute lipid abundance per microgram protein among EVs, HDL, and LDL/VLDL isolated from plasma or serum (n = 12 per group) examined by one-way ANOVA followed by Tukey’s test. Solid line in each group indicates mean total lipid abundance. **** p < 0.0001.

