Correction to: J Exp Clin Cancer Res (2019) 38:436
https://doi.org/10.1186/s13046-019-1438-y
In the original publication of this article [1], the images of Figs. 4 and 5 were exchanged and the legends of the two figures did not correspond due to a typesetting error.
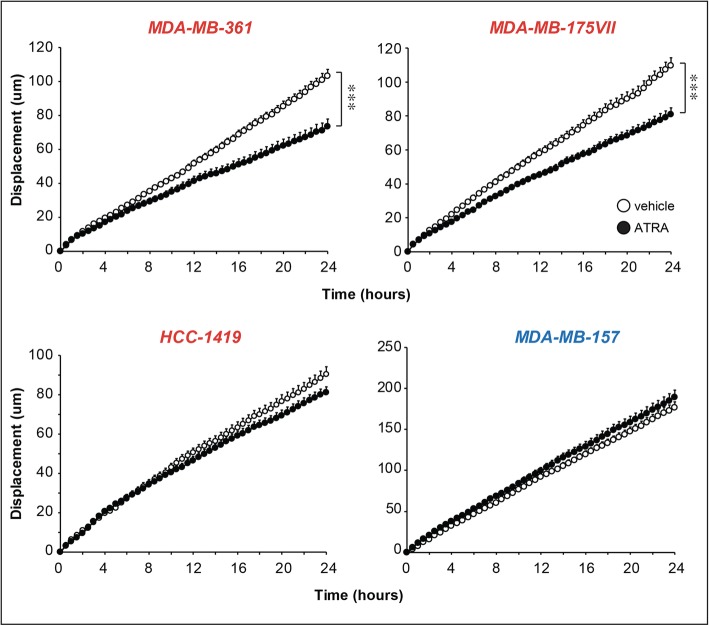
Fig. 4.
Effect of ATRA on the random motility of breast cancer cells. Biological triplicates of the indicated luminal (MDA-MB-361, MDA-MB-175VII and HCC-1419; marked in red) and basal (MDA-MB-157; marked in blue) cell lines. Cells were pre-treated with vehicle (DMSO) or ATRA. Each point is the Mean + SD of 40 cells. ***Significantly lower than the vehicle curve (p < 0.001 following two-way ANOVA Bonferroni post-test)
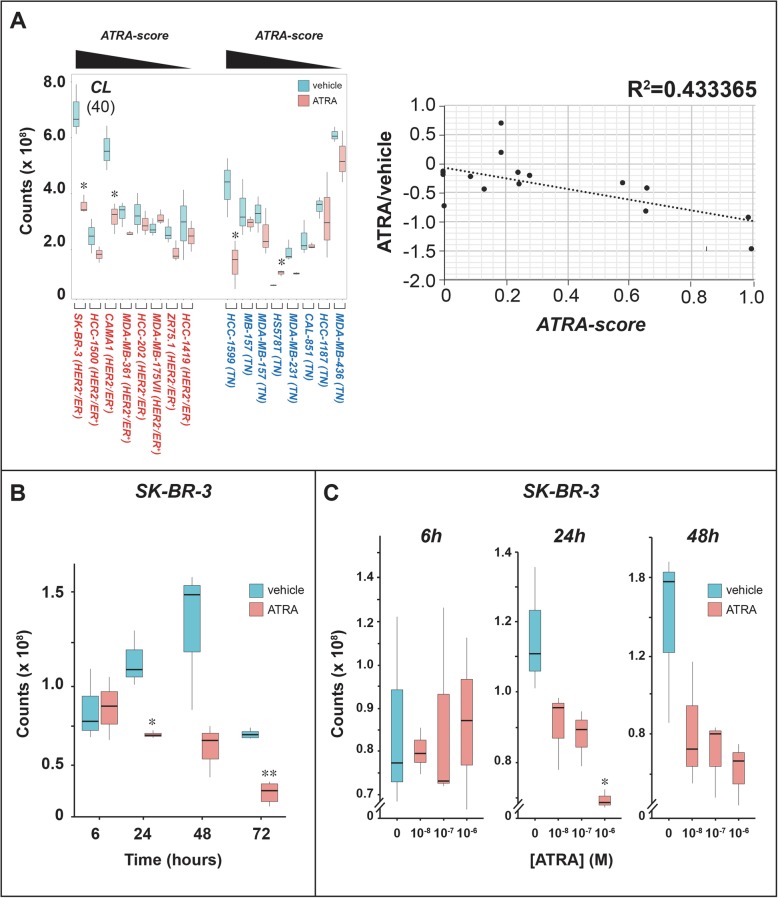
Fig. 5.
ATRA effects on the levels of cardiolipins. a Biological triplicates of the indicated breast cancer cells were treated with vehicle (DMSO) or ATRA (10- 6 M) for 48 h. Left: The box plots show the median ± SD levels of cardiolipins (CLs). The number of different CL molecules identified by mass-spectrometry is indicated in parenthesis. Luminal cell-lines are marked in red and basal cell-lines are marked in blue. The luminal and basal cell-lines are ordered according to decreasing sensitivity to the anti-proliferative effect of ATRA from left to right, as indicated (decreasing ATRA-score). Right: The diagram indicates the correlations between the ATRA/DMSO ratio of the mean values calculated for CLs in each cell-line and the corresponding ATRA-score. b Biological triplicates of SK-BR-3 cells were treated with vehicle (DMSO) or ATRA (10- 6 M) for the indicated amounts of time. The box plot shows the median ± SD levels of cardiolipins (CLs). c Biological triplicates of SK-BR-3 cells were treated with vehicle (DMSO) or the indicated concentrations of ATRA for 48 h. The box plot shows the median ± SD levels of cardiolipins (CLs). *Significantly different (p < 0.05) from the corresponding vehicle treated control using the Student’s t-test. **Significantly different (p < 0.01) from the corresponding vehicle treated control using the Student’s t-test
The publisher sincerely apologizes for the inconvenience caused to the readers.
The original article has been corrected.
Footnotes
The original article can be found online at 10.1186/s13046-019-1438-y
Mineko Terao, Laura Goracci and Valentina Celestini contributed equally to this work.
Reference
- 1.Terao M, et al. Role of mitochondria and cardiolipins in growth inhibition of breast cancer cells by retinoic acid. J Exp Clin Cancer Res. 2019;38:436. doi: 10.1186/s13046-019-1438-y. [DOI] [PMC free article] [PubMed] [Google Scholar]


