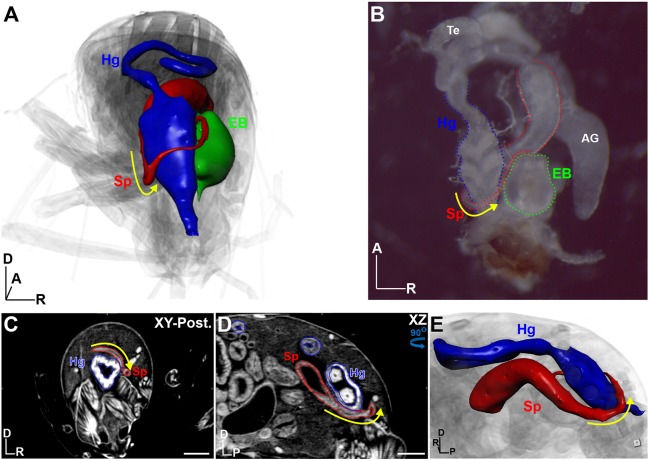
Fig. 6.
Left-right asymmetry as an example of inter-organ analysis. (A) 3D view from the posterior perspective of a male adult fly. The hindgut (Hg, blue), spermiduct (Sp, red) and ejaculatory bulb (EB, green) are rendered as surfaces. Yellow arrow indicates dextral (left-right) looping of the spermiduct over the hindgut into the ejaculatory bulb, located on the right side of the body axis. (B) Dissected version of the organs outlined in A; testes (Te) and accessory glands (AG) are also labeled. (C) xy view from the posterior of the fly shown in A; the Sp and Hg are outlined. (D) xz view of the male abdomen shown in C. (E) 3D view of the Sp and HG as shown in D, viewed from the left perspective. Yellow arrow denotes dextral looping. Body axes are indicated: A, anterior; D, dorsal; P, posterior; R, right. Scale bars: 100 µm. Flies were stained with 0.1 N iodine and scanned in slow mode at an image pixel size of 1.25 µm.

