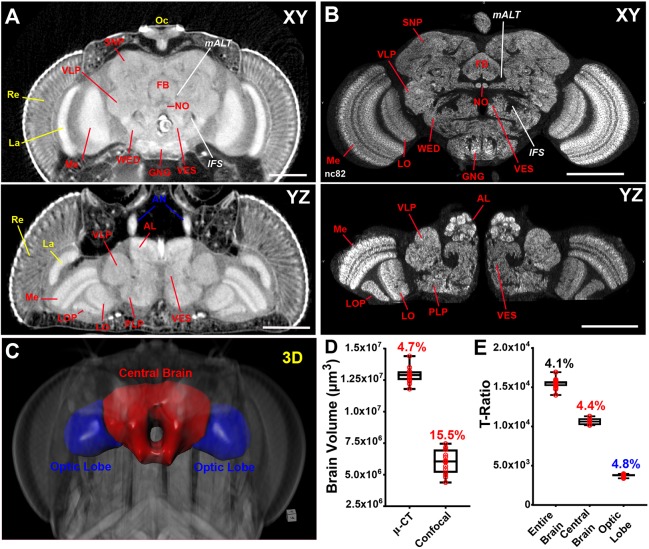
Fig. 7.
A comparison of µ-CT and confocal microscopy for quantitative and morphological analysis of the nervous system. (A) Anterior xy (top) and dorsal yz (bottom) view of an adult brain labeled with PTA and scanned in slow mode at an image pixel size of 700 nm. Locations of individual neuropil structures and fiber tracts are noted. (B) xy (top) and yz (bottom) view of an adult brain stained for the synapse marker nc82 (anti-Bruchpilot) and imaged by confocal. AL, antennal lobe; AN, antenna nerve; FB, fan-shaped body; GNG, gnathal ganglia; IFS, inferior fiber system; La, lamina; LO, lobula; LOP, lobula plate; mALT, medial antennal lobe tract; Me, medulla; NO, noduli; Oc, ocelli; PLP, posteriorlateral protocerebrum; Re, retina; SNP, superior neuropils; VES, vest; VLP, ventrolateral protocerebrum; WED, wedge. (C) 3D surface representation of the adult brain, indicating the optic lobes (blue) and central brain (red). (D) Comparison of brain volume measurements between µ-CT and confocal microscopy. Box and whisker plots are shown. Box values represent the 25th, 50th and 75th percentiles. Whiskers represent the minimum/maximum range. Coefficient of variation (CV%) is given. n=15 brains. (E) Measurements of entire brain, central brain and optic lobe volumes normalized to thorax width presented as a T-ratio (raw brain volume/thorax width). All µ-CT measurements were obtained from animals scanned in fast mode (20 min) at an image pixel size of 3 µm. Coefficient of variation (CV%) given. n=5 brains. Scale bars: 100 µm.

