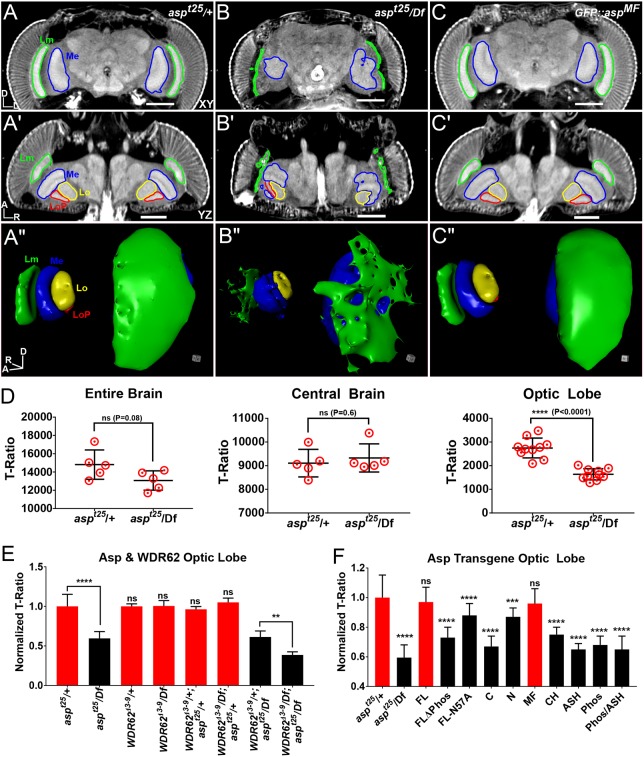
Fig. 8.
Autosomal recessive primary microcephaly (MCPH) modeled in the adult fly. (A-C″) µ-CT scans of adult heads labeled with PTA and scanned in slow mode at an image pixel size of 1.25 µm from heterozygous control (aspt25/+; A-A″), asp mutant (aspt25/Df; B-B″) and GFP::aspMF transgenic rescue (C-C″) flies. (A-C) Anterior xy view; (A′-C′) dorsal yz view; (A″-C″) 3D rendering of visual system. Medulla (Me), lamina (Lm), lobula (Lo) and lobula plate (LOP) neuropils outlined. (D) T-ratio analysis of asp brain volume for the entire brain, the central brain only, and the optic lobe only. (E) Optic lobe volume of asp and Wdr62 brains expressed as a T-ratio, normalized to Wdr62Δ3-9/+; aspt25/+, which was set to 1.0. (F) Optic lobe volume of each GFP::asp transgene in the aspt25/Df mutant background. All µ-CT measurements were obtained from animals scanned in fast mode (20 min) at an image pixel size of 3 µm. Data are expressed as T-ratios, normalized to the GFP::asp/+; aspt25/+ control, which was set to 1.0. n=5 brains, Welch's t-test. ns, P>0.05; **P≤0.01; ***P≤0.001; ****P≤0.0001. Error bars represent s.d. Significance levels shown were derived from direct pairwise comparison between the control (GFP::asp/+; aspt25/+) and the mutant (GFP::asp/+; aspt25/Df), as shown in Figs S8 and S9. Body axes are indicated: A, anterior; D, dorsal; L, left; R, right. Scale bars: 100 µm.

