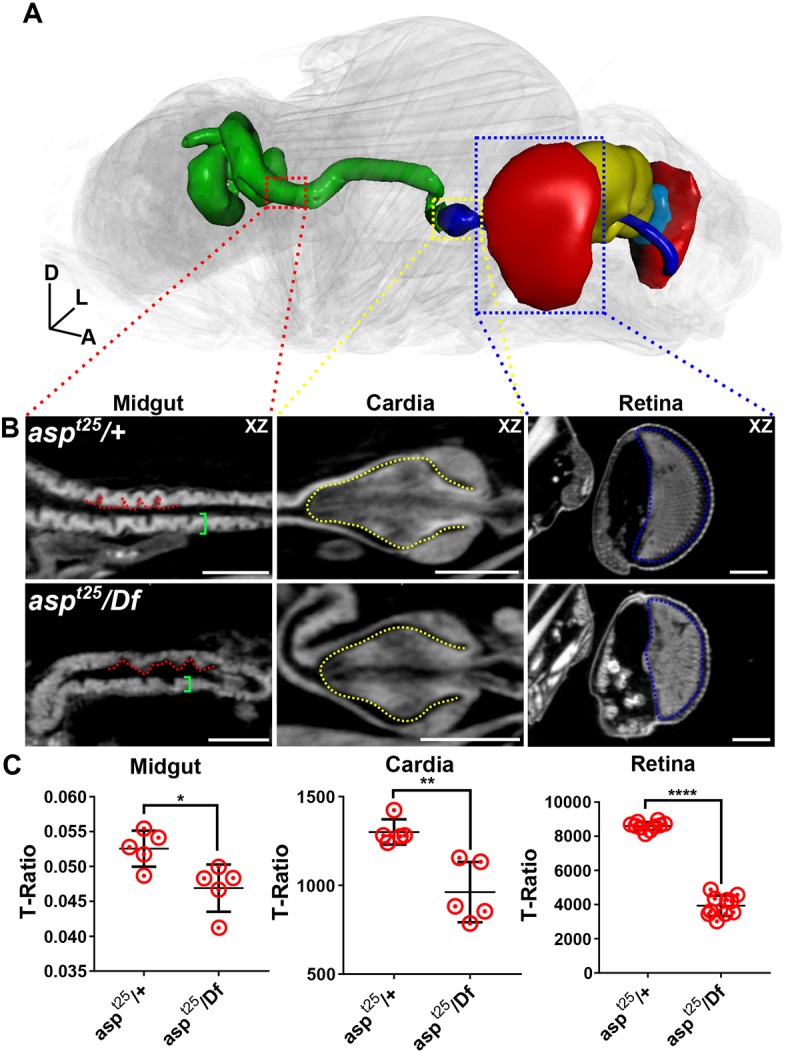
Fig. 9.

Phenotyping asp mutant animals with μ-CT. Morphometric analysis of additional tissues in heterozygous control (aspt25/+) and asp mutant (aspt25/Df) animals scanned in slow mode at an image pixel size of 1.25 µm. (A) 3D representation of an asp mutant with affected tissues shown: midgut (green); cardia and foregut (blue), retina (red), brain (yellow), lamina (aqua blue). (B) 2D xy views of the midgut, cardia and retina. Red dotted line outlines villi-like structures in the gut epithelium; green brackets highlight wall thickness. Yellow dotted line outlines the cardia. Blue dotted line outlines the retina. (C) T-ratio analysis of midgut epithelial thickness, cardia volume and retina volume. Error bars represent s.d. Body axes are indicated: A, anterior; D, dorsal; L, left. Scale bars: 100 µm. n=5, Welch's t-test. *P≤0.05; **P≤0.01; ****P≤0.0001.
