

SUMMARY
The mitogen-activated protein kinase (MAPK) pathway is a critical effector of oncogenic RAS signaling, and MAPK pathway inhibition may be an effective combination treatment strategy. We performed genome-scale loss-of-function CRISPR-Cas9 screens in the presence of a MEK1/2 inhibitor (MEKi) in KRAS-mutant pancreatic and lung cancer cell lines and identified genes that cooperate with MEK inhibition. While we observed heterogeneity in genetic modifiers of MEKi sensitivity across cell lines, several recurrent classes of synthetic lethal vulnerabilities emerged at the pathway level. Multiple members of receptor tyrosine kinase (RTK)-RAS-MAPK pathways scored as sensitizers to MEKi. In particular, we demonstrate that knockout, suppression, or degradation of SHOC2, a positive regulator of MAPK signaling, specifically cooperated with MEK inhibition to impair proliferation in RAS-driven cancer cells. The depletion of SHOC2 disrupted survival pathways triggered by feedback RTK signaling in response to MEK inhibition. Thus, these findings nominate SHOC2 as a potential target for combination therapy.
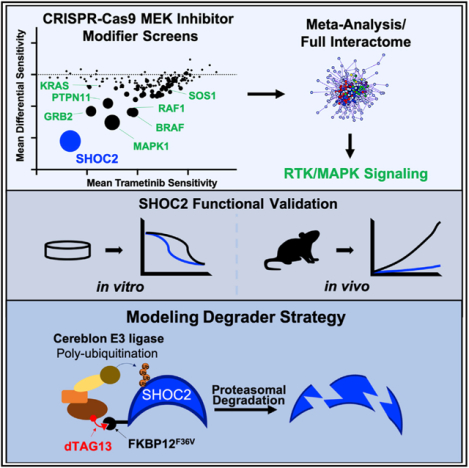
Graphical Abstract
In Brief
Sulahian, Kwon, and Walsh et al. performed several loss-of-function CRISPR-Cas9 screens in KRAS-mutant cancer cells treated with a MEK inhibitor and define the landscape of modifiers of MEK inhibitor sensitivity while highlighting that SHOC2 is a potent synthetic lethal target that serves as a critical signaling node to mediate MAP kinase pathway reactivation upon MEK inhibition.
INTRODUCTION
KRAS is a major oncogenic driver in a variety of tumor types, including pancreatic ductal adenocarcinoma, lung adenocarcinoma, and colorectal carcinoma. The KRAS protein itself has been challenging to target with small molecule inhibitors (Simanshu et al., 2017; Stephen et al., 2014). The RAF-MEK-ERK mitogen-activated protein kinase (MAPK) pathway is activated by oncogenic RAS signaling to promote cancer cell proliferation and survival (Aguirre and Hahn, 2018; Papke and Der, 2017). Although potent inhibitors have been developed for MEK1/2 and ERK1/2 in the MAPK pathway, single-agent efficacy of these inhibitors in the clinic has been limited (Aguirre and Hahn, 2018; Blumenschein et al., 2015; Chapman et al., 2014; Infante et al., 2012; Jänne et al., 2013). Major modes of intrinsic and acquired resistance to MEK or BRAF inhibitor monotherapy in RAS- or BRAF mutant cancers include the loss of feedback inhibition and upregulated RTK signaling (Corcoran et al., 2012; Duncan et al., 2012; Nazarian et al., 2010; Villanueva et al., 2010); NF1 inactivation (Whittaker et al., 2013); or increased NRAS (Nazarian et al., 2010), A/B/C-RAF (Das Thakur et al., 2013; Hatzivassiliou et al., 2010; Heidorn et al., 2010; Poulikakos et al., 2011; Villanueva et al., 2010), COT (Johannessen et al., 2010), or MEK1/2 activity (Nikolaev et al., 2011; Wagle et al., 2011). These studies highlight a key role for sustained RTK/MAPK signaling in mediating resistance to inhibition of this pathway in RAS- or BRAF mutant cancers.
An alternative strategy for directly targeting KRAS itself involves identifying co-dependent signaling pathways that are essential for cancer survival in the context of therapeutic inhibition of KRAS effector signaling pathways. Elucidating these synthetic lethal interactions will inform our understanding of KRAS biology and may provide additional opportunities for combination therapeutic development to treat KRAS-mutated cancers. Over the past several years, multiple groups have used RNA-interference screening with small molecule inhibition of oncogenic signaling pathways in RAS mutant cancers to identify several synthetic lethal targets for combination therapy, including BCL-XL (Corcoran et al., 2013), PTPN11 (Prahallad et al., 2015), YAP1 (Lin et al., 2015), ERBB3 (Sun et al., 2014), and FGFR1 (Manchado et al., 2016). Moreover, recent CRISPR-Cas9 screens utilizing single guide RNA (sgRNA) libraries targeting the “druggable” genome have nominated additional synthetic lethal targets for combination with MEK inhibition, such as MAPK7 (Dompe et al., 2018) and SRC (Anderson et al., 2017). We have also recently employed genome-scale CRISPR-Cas9 screening in the context of MEK inhibition to identify mediators of resistance to MAPK inhibition, including the ATXN1L-CIC-ETS axis and the KEAP1/NRF2 pathway (Krall et al., 2017; Wang et al., 2017a).
SHOC2 is a scaffold protein composed of leucine-rich repeats and is a positive regulator of the RAS-MAPK pathway (Simanshu et al., 2017). SHOC2 binds directly to MRAS and the catalytic subunit of PP1 (PP1c) leading to membrane localization and dephosphorylation of c-RAF at S259 to cause c-RAF activation (Rodriguez-Viciana et al., 2006; Simanshu et al., 2017). Activating mutations in SHOC2, MRAS, and PP1c are found in Noonan-like syndrome, a “RASopathy” syndrome characterized by congenital cardiac, skeletal, and cognitive deficits (Cordeddu et al., 2009; Gripp et al., 2016; Higgins et al., 2017; Young and Rodriguez-Viciana, 2018). Recent CRISPR-Cas9 screening data have shown that SHOC2 is essential for proliferation of RAS mutant leukemia lines but not RAS wild-type lines (Wang et al., 2017b).
Here, we performed genome-scale CRISPR-Cas9 loss-of-function screens in the setting of MEK inhibition (MEKi) to define the landscape of synthetic lethal interactors with MEKi. We provide a systematic view of modifiers of MEK inhibitor sensitivity and nominate multiple combination therapy targets. We found that additional perturbation of the RTK-RAS-MAPK pathway strongly cooperated with MEKi to inhibit proliferation and survival of RAS-driven cancer cells. In particular, we identified SHOC2 as a key regulator of KRAS mutant cancer cell proliferation and survival in the setting of MEKi.
RESULTS
Loss-of-Function Genetic Screens to Identify Modifiers of MEK Inhibitor Sensitivity
To identify modifiers of sensitivity to small molecule inhibition of the MAPK signaling pathway, we performed pooled genome-scale CRISPR-Cas9 screens in established KRAS-mutant pancreatic or lung cancer cell lines in the presence or absence of the MEK1/2 inhibitor trametinib (Gilmartin et al., 2011) (CRISPR-MEKi screens; Figure 1A). Using phosphorylated ERK (p-ERK) as a biomarker to assess the effectiveness of MEK inhibition, we identified a trametinib drug concentration that achieved pathway inhibition while still allowing cell proliferation to enable identification of negatively selected sgRNAs in these screens (Figures S1A–S1C). We introduced a genome-scale CRISPR-Cas9 sgRNA library (Doench et al., 2014) in three KRAS mutant cancer cell lines — CFPAC-1, A549, and NCI-H23 — and subsequently identified the differential abundance of sgRNAs in trametinib-treated or dimethyl sulfoxide (DMSO) control-treated cells after 14 days of treatment (Figure 1A; Table S1; STAR Methods).
Figure 1. Genome-Scale Loss-of-Function and Secondary Validation Screens Identify SHOC2 as a Potent Modifier of MEK Inhibitor Sensitivity in KRAS Mutant Cancer Cell Lines.

(A) Schematic of pooled CRISPR-Cas9 screening strategy.
(B–D) Genome-scale screen results in pancreatic cancer, CFPAC-1 (B), and lung cancer lines, A549 (C) and NCI-H23 (D). Red points have FDR < 0.25 (STARS algorithm). Mean trametinib sensitivity (x axis) is calculated as the difference in the log2(fold-change) in sgRNA representation between cells treated with trametinib for 14 days and the initial pool of sgRNAs. Differential sensitivity indicates the difference log2(fold-change) in sgRNA representation between the trametinib-treated and DMSO-treated arms of the screen. Scores represent the average of all guides for a given gene.
(E) Venn diagram summarizes the overlap of genes that are depleted in all three screens with an FDR < 0.25.
(F–H) Representative secondary screens performed with a focused CRISPR-Cas9 library in MIA PaCa-2 (F), NCI-H2009 (G), and Panc 10.05 (H). Red points, FDR < 0.25.
(I) Circos plot showing genes recurrently scoring as MEKi sensitizers across one or more of 10 different genome-scale (n = 3) and secondary-focused (n = 7) CRISPR-MEKi screens, with criteria for inclusion: (1) STARS FDR ≤ 0.25 for the trametinib versus Control comparison and (2) a trametinib sensitivity score of ≤ −0.5. Each arc represents a gene list. On the inner arc, dark orange color represents genes that appear in multiple lists and light orange color represents genes that are unique to that gene list. Purple lines link genes shared by multiple lists.
(J) Summary of all screens (genome scale and secondary), plotting the combined average of the mean differential sensitivity score (y axis) and the mean trametinib sensitivity score (x axis) across all lines screened. The size of the point is proportional to the number of times each gene scored in a screen with a differential sensitivity score having an FDR < 0.25.
To identify genes whose depletion modified the response to MEKi, we averaged the measured abundance of guides targeting each gene to calculate gene-level scores. Specifically, we calculated a “trametinib sensitivity score” and a “DMSO sensitivity score” reflecting the mean log2-fold change between the endpoint (14 days in trametinib or control) and initial library representation for all sgRNAs targeting each gene in the trametinib and control arms of the screen, respectively (STAR Methods). We then compared the trametinib-treated arm with the control DMSO-treated arm of each screen to yield a “differential sensitivity score,” reflecting the preferential dependence of each gene in the presence of trametinib. We prioritized candidates that showed enhanced depletion in the context of MEK inhibition and that were also strongly depleted in the trametinib arm of the screen, thus displaying highly negative differential sensitivity scores and trametinib sensitivity scores (Figures 1B–1D; Table S2). The genes targeted by these sgRNAs represented potential synthetic lethal interactors that, when depleted, cooperated with MEK inhibition in KRAS mutant cancer cells.
To examine the major mechanisms of sensitization to MEK inhibition across cell lines, we performed an integrative analysis of the genome-scale CRISPR-MEKi screens in CFPAC-1, A549, and NCI-H23. Using the STARS algorithm (STAR Methods) (Doench et al., 2016), we identified genes with statistically significant differential sensitivity scores reflecting differences between trametinib and control-treated arms of the screen. With a false discovery rate (FDR) threshold of ≤ 0.25, we identified a total of 184 genes that exhibited preferential essentiality with MEK inhibition in one or more cell lines. Confirming the robustness of our CRISPR-MEKi screens, several genes previously identified as synthetic lethal interactors with MEKi scored in these screens including BCL2L1 (Corcoran et al., 2013), RAF1 (Lito et al., 2014), and PTPN11 (Prahallad et al., 2015) (Figures 1B–1D).
We observed considerable gene-level heterogeneity across cell lines, with only 18 genes scoring in two or more lines and 4 genes observed in all three cell lines (Figure 1E). Both biological and technical features may contribute to this heterogeneity, including variation in underlying genetic and lineage characteristics of each cell line (Table S1), differential baseline essentiality of some of these cancer-relevant dependencies in the untreated state (Figures S1D–S1F). Despite variation in differential sensitivity at the gene level, examination of these synthetic lethal candidates using knowledge of known pathways indicated strong and consistent convergence on RTK-RAS-MAPK signaling pathways, with different members of these pathways (e.g., FGFR1 and RAF1) observed in all three screens (Figures S1G–S1J) (Tripathi et al., 2015).
Although our CRISPR-MEKi screens were designed as negative-selection screens, we also identified several genes whose depletion led to decreased sensitivity or resistance to MEK inhibition (Figures 1B–1D and S1K–S1N; Table S3). Using an FDR threshold of ≤ 0.25, we found a total of 614 unique genes in the three cell lines but only 58 genes observed as resistance factors in two or more screens, reminiscent of the heterogeneity that we observed for genes that synergize with MEKi. Within the compendium of resistance genes, we identified several tumor suppressor genes that activate PI3K-AKT-MTOR signaling, including PTEN, TSC1, and TSC2 (Table S3). We also identified genes encoding the negative regulators of the RAS-MAPK pathway, including DUSP6 and the GTPase-activating protein RASA2. Moreover, we identified several genes whose products regulate oncogenic transcription, such as the aryl hydrocarbon receptor (AHR) or regulators of the ATXN1L-CIC-ETS transcription factor axis (e.g., RFWD2 and DET1), which we had previously identified in a CRISPR-MEKi screen in the PA-TU-8988T pancreatic cancer cell line (Wang et al., 2017a).
To extend and validate the observations from these CRISPR-MEKi screens, we developed a focused secondary screening CRISPR-Cas9 sgRNA library to interrogate the top-scoring genes in a panel of KRAS mutant cancer cell lines. Using an all-in-one vector system encoding both Cas9 and an sgRNA, we created a library of 4831 reagents targeting control and experimental genes, including 527 synthetic lethal candidate genes that were nominated according to their differential sensitivity scores by the STARS algorithm (Doench et al., 2016) Table S4; STAR Methods). We screened seven additional KRAS mutant cancer cell lines, including four pancreatic cancer lines and three lung cancer cell lines (Figures 1F–1H). Thus, a total of ten CRISPR-MEKi screens were performed using either the genome-scale or focused secondary screening sgRNA libraries (Figure 1I; Table S1).
To evaluate the landscape of recurrent MEKi synthetic lethal candidate genes, we performed an integrative analysis of all primary genome-scale and secondary CRISPR-MEKi screens (n = 10 screens), prioritizing genes by (1) the most negative average differential sensitivity score and trametinib sensitivity score in all ten lines and (2) the number of cell lines in which each gene scored as a synthetic lethal candidate (Figure 1J). SHOC2 was the most recurrent and strongest scoring synthetic lethal dependency in the presence of MEK inhibition across all ten screens analyzed (Figure 1J).
RTK-RAS-MAPK Pathway Components Are Synthetic Lethal Interactors with MEK Inhibition
To understand common pathways and interactions among synthetic lethal candidates, we performed a meta-analysis of pathway and protein-protein interaction (PPI) enrichment among the synthetic lethal candidates scoring in two or more of the CRISPR-MEKi screens using the Metascape suite of tools (http://metascape.org; STAR Methods; Tripathi et al., 2015). We evaluated enrichment of genes within the MSigDB canonical pathways database and observed strong representation of members of the RTK-RAS-MAPK signaling pathways (Figure 2A). With the exception of KEAP1-mutant NCI-H2030 and NCI-H647, the other eight cell lines demonstrated strong dependence on several well-annotated RTK-RAS-MAPK pathways as well as the MTOR and CDC42 signaling pathways (Figure 2B).
Figure 2. Comprehensive Analysis of Screens Reveals Differential Dependence on RTK-RAS-MAPK Signaling in the Context of MEK Inhibition.

The metascape suite of tools(http://metascape.org) was used to analyze gene targets scoring as sensitizers to the trametinib in 10CRISPR-MEKi screens. Genes were included in the analysis if they scored with a differential sensitivity score having an FDR % 0.25 by the STARS algorithm and a trametinib sensitivity score of % −0.5 in one or more screens.
(A) Pathway enrichment of genes scoring in two or more screens within the MSigDB canonical pathways database.
(B) Top 20 enriched canonical pathways among cell lines screened.
(C) Protein-protein interaction meta-analysis. Input gene lists from all 10 CRISPR-MEKi screens were merged into one list and resulted in a single PPI network representing the full interactome (center network). Each MCODE component in the merged network is assigned a unique color and has been separated out and aligned radially around the full interactome. MCODE networks are labeled by representative members and displayed with nodes as pie charts. The color code for each pie sector represents a gene list from each CRISPR-MEKi screen, thus demonstrating which of the genes in the networks scored in each of the CRISPR-MEKi screens. Each node represents a protein that scored in one or more CRISPR-MEKi screens and edges represent interactions derived from the BioGrid, InWeb_IM, and OmniPath databases.
(D) Co-dependency plot for selected genes across the 10 CRISPR-MEKi screens. A black square indicates that the cell line is dependent on the gene with an FDR < 0.25 and a trametinib sensitivity score ≤ −0.5.
(E) Summary of differential dependence for RTK-RAS-MAPK-related genes in the context of MEK inhibition. Mean sensitivity score in DMSO (D) or trametinib (T) is shown for each gene.
To understand the potential PPI complexes represented among the MEKi synthetic lethal candidates, we compiled top synthetic lethal interactors from each of the screens into a single gene list and generated a single merged PPI network (Figure 2C). This network contains the subset of proteins that form physical interactions with at least one other member in the list, based on established interaction databases (STAR Methods). We applied the Molecular Complex Detection (MCODE) algorithm to identify densely connected network components. We observed PPI clusters involving a number of signaling pathways with most notable enrichment of interactions within several different RTK signaling components, RAS-RAF-MAPK pathway members, and CRK-related signaling partners.
We identified multiple genes encoding other MAPK pathway members recurrently scoring as potent sensitizers of MEK inhibition, including RAF1, BRAF, and MAPK1 (Figures 1J, 2D, and 2E). Examination of MEKi co-dependencies across all cell lines screened revealed a robust dependence on expression of multiple MAPK pathway signaling members, with the exception of NCI-H2030 and NCI-H647, which demonstrated more restricted dependence primarily on SHOC2 (Figure 2D). Notably, both of these cell lines harbor mutations in the KEAP1 gene which has been shown to confer resistance to MEK inhibition (Krall et al., 2017). We found other classes of genes that scored as preferential dependencies including the anti-apoptotic signaling proteins BCL2L1 and MCL1, integrin-related signaling proteins, and a class of genes involved in heparan sulfate biology, including EXT1, EXT2, EXTL3, and SLC35B2 (Figure 2D). Specific examination of DMSO and trametinib sensitivity scores for the MAPK pathway members revealed strongly recurrent differential sensitivity to knockout of these genes in the context of trametinib, with SHOC2 being the strongest synthetic lethal candidate identified in these screens (Figure 2E). While all cell lines demonstrated clear dependence on SHOC2 in the presence of trametinib, we observed an apparent bimodal dependency (Figure S2A) in trametinib sensitivity score that may relate to modest differences in Cas9 activity across the screens (Figure S2B) as well as underlying transcriptomic and functional features (Figures S2C and S2D).
Taken together, our CRISPR-MEKi screens have identified that KRAS mutant cancer cell lines treated with the MEK1/2 inhibitor trametinib demonstrate a striking sensitivity to additional loss-of-function perturbations within one or more RTK-RAS-MAPK signaling pathways. Across all ten CRISPR-MEKi screens, SHOC2 was the strongest MEKi synthetic lethal candidate; therefore, we have focused subsequent studies on validating and credentialing SHOC2 as a potential therapeutic target.
SHOC2 Suppression Specifically Cooperates with MEK Inhibition to Impair Proliferation and Survival of RAS-Driven Cancer Cells
To further investigate the preferential dependency on SHOC2 expression in the context of trametinib treatment, we performed knockdown of SHOC2 or control gene expression in PA-TU-8902 pancreatic cancer cells, an additional KRASG12V mutant cell line that was not used for CRISPR-MEKi screening. Using a doxycycline-regulatable short-hairpin RNA (shRNA), we achieved robust suppression of SHOC2 and potent sensitization to trametinib treatment compared with control DMSO treatment in both short- and long-term proliferation assays (Figures 3A–3C and S3A–S3D). In complementary experiments, we created single-cell clones (SCCs) that harbor SHOC2 knockout and complete loss of SHOC2 protein expression using CRISPR-Cas9 genome editing (Figures 3D and S3E). SHOC2 knockout (KO) SSCs demonstrated profound sensitivity to trametinib relative to the DMSO treatment condition (Figures 3E, 3F, and S3F–S3H). The proliferation and survival of SHOC2 SCCs was unimpaired at baseline, without trametinib treatment. To confirm that trametinib sensitization is a direct consequence of SHOC2 KO in these SCCs, we performed a rescue experiment whereby a SHOC2 cDNA was exogenously expressed in two different SCCs (Figures 3G–3I and S3I). Overexpression of SHOC2 restored the trametinib responsiveness of the PA-TU-8902 SCCs to that of the parental cell line, thus completely eliminating the sensitizing effect of SHOC2 KO. Lastly, using an in-cell western assay, we determined that loss of SHOC2 reduced the half maximal inhibitory concentration (IC50) for inhibition of phospho-ERK1/2 (p-ERK) levels by trametinib in SHOC2 KO SCCs of PA-TU-8902 and MIA PaCa-2 (Figures 3J, 3K, and S3J).
Figure 3. SHOC2 Depletion Sensitizes to MEK Inhibition.

(A) SHOC2 protein levels in PA-TU-8902 stable cell lines infected with SHOC2 doxycycline-inducible shRNA or control shRNA after 72 h of doxycycline (Dox) treatment.
(B) Proliferation assay of PA-TU-8902 cells after 6 days of trametinib treatment as measured by Cell-Titer-Glo (CTG).
(C) Quantification of clonogenic assay by crystal violet staining for each condition relative to cells expressing control shRNA treated with DMSO control (9 days of treatment).
(D) SHOC2 protein levels in single-cell clones with CRISPR-Cas9 KO of SHOC2.
(E) Proliferation assay of PA-TU-8902 cells after 6 days of trametinib treatment as measured by CTG.
(F) Quantification of clonogenic assay by crystal violet staining for each condition relative to cells expressing control shRNA treated with DMSO control (9 days of treatment).
(G) Western blot for SHOC2 protein expression in single-cell clones with or without introduction of a SHOC2-expressing open reading frame (ORF) cDNA.
(H) 6-day CTG proliferation assay in cells that express the SHOC2 ORF cDNA showing rescue of trametinib sensitivity.
(I) Clonogenic assay quantification in single-cell clones with or without expression of the SHOC2 ORF cDNA. Bars represent the average of three independent replicates ± SD.
(J) In-cell western quantification of relative p-ERK to total ERK at various doses of trametinib 48 h post-treatment, normalized to DMSO control.
(K) Representative in-cell western image.
Using the doxycycline inducible shRNA system, we further validated that SHOC2 knockdown sensitized the KRASG12A mutant NCI-H2009 non-small cell lung cancer line to trametinib (Figures 4A and S4A). We also observed that SHOC2 knockdown conferred sensitivity to other allosteric MEK1/2-inhibitors, including Selumetinib and the dual-mechanism MEKi CH5126766, which also prevents MEK phosphorylation by RAF (Figure 4A) (Ishii et al., 2013; Samatar and Poulikakos, 2014). In contrast, SHOC2 suppression failed to confer substantial sensitivity to treatment with a paradox-breaker BRAF inhibitor (Zhang et al., 2015) (PLX7904), an ATP-competitive BRAF inhibitor (Vemurafenib), or a pan-RAF inhibitor (LY3009120) (Figures 4A, S4E, and S4F). We detected very mild but less consistent sensitization to ERK inhibition upon SHOC2 suppression with variability observed between cell lines (NCI-H2009 and PA-TU-8902), different shRNA constructs, and three different ERK1/2 inhibitors (GDC-0994, SCH772984, and BVD523) (Figures 4A, S4E, and S4F). SHOC2 suppression did not sensitize to chemotherapy treatment with Gemcitabine (Figure 4A) and conferred no further sensitization of the KRASG12C mutant cancer cell line MIA PaCa-2 to a KRASG12C-specific inhibitor (Janes et al., 2018) (Figure S4G). These observations demonstrate that SHOC2 acts as a potent synthetic lethal partner, specifically with MEKi.
Figure 4. SHOC2 Suppression Potently Sensitizes RAS-Driven Cancer Cells Specifically to MEK Inhibition.

(A–D) 6-day CTG proliferation assay with parental and stable cell lines infected with SHOC2-inducible shRNA (or control).
(A) NCI-H2009 KRAS G12A mutant cell line treated with the MEK1/2 allosteric inhibitors trametinib and selumetinib, the nucleoside analog gemcitabine, the BRAF inhibitor PLX7904, the ERK inhibitor GDC-0994, and the dual RAF/MEK inhibitor CH5126766.
(B–D) HCC364 BRAF V600E mutant (B), NCI-H1975 EGFR L858R/T790M mutant (C), and NCI-H1299 NRAS Q61K mutant (D) cell lines treated with trametinib, selumetinib, or gemcitabine.
We next examined whether suppression of SHOC2 expression conferred sensitivity to trametinib in cancer cell lines with other oncogenic drivers. SHOC2 knockdown conferred modest trametinib sensitivity to the eGFRL858R/T790M mutant or NRASQ61K mutant cancer cells but not to a BRAFV600E mutant cancer cell line (Figures 4B–4D and S4B–S4D). SHOC2 knockdown also sensitized the EGFR- and NRAS mutant lines to Selumetinib but not to Gemcitabine (Figures 4C and 4D). Furthermore, we observed similar sensitization of SHOC2 suppression to MEK inhibition in MET-amplified and ERBB4 mutant lung cancer cell lines (data not shown). These observations demonstrate that suppression of SHOC2 cooperates with MEKi across a range of RAS-driven cancer cell contexts.
SHOC2 Suppression Cooperates with MEKi to Inhibit Proliferation in Three-Dimensional Culture and Impair In Vivo Tumorigenesis
We found that RAS-driven pancreatic and lung cancer cell lines do not require SHOC2 expression for growth under standard two-dimensional adherent culture conditions in the absence of MEKi treatment. However, Wang et al. reported that SHOC2 was essential for the baseline proliferation and survival of non-adherent NRAS- or KRAS mutant leukemia cell lines (Wang et al., 2017b). We investigated whether SHOC2 suppression or KO impairs baseline growth and MEKi sensitivity in the KRASG12V mutant PA-TU-8902 pancreatic cancer cell line grown in three-dimensional culture conditions. Short-term assays in ultra-low attachment conditions (Rotem et al., 2015) revealed that SHOC2 suppression in PA-TU-8902 cells led to an approximately 28% reduction in proliferation (average of SHOC2 sh1 and sh2) compared with control cells (Figure 5A). We observed a modest additive effect of trametinib treatment with concurrent SHOC2 suppression. Similarly, the PA-TU-8902 SHOC2 KO clones grown in three-dimensional organoid culture conditions demonstrated a mild baseline effect but a modest enhancement of trametinib sensitivity compared to controls (Figure 5B).
Figure 5. Impact of SHOC2 Suppression in Combination with MEKi on Proliferation in Three-Dimensional Culture and In Vivo Tumor Growth.

(A) Relative short-term viability (CTG) of PA-TU-8902 cells stably expressing control and SHOC2 targeting shRNAs via growth in low-attachment assays in combination with trametinib (10 nM) treatment for 6 days. Immunoblot of SHOC2 expression below. Error bars represent average relative CTG proliferation readings of three biological replicates (n = 3) ± SEM.
(B) Relative viability (CTG three-dimensional) of SHOC2 KO PA-TU-8902 single-cell clones (SCCs) and parental grown in 100% Matrigel domes in combination with trametinib (10 nM) treatment for 7 days. Immunoblot of SHOC2 expression below. Bars represent the average of three independent replicates ± SD.
(C) Tumor volume (mm3) growth kinetics of PA-TU-8902 sgRNA intergenic control cells subcutaneously injected (3 × 10⁶) in SHO-immunocompromised mice treated with or without trametinib.
(D) Tumor volume growth kinetics of PA-TU-8902 SHOC2 KO cells subcutaneously injected (3 × 10⁶) in SHO mice treated with or without trametinib.
(E) Tumor volume growth kinetics of PA-TU-8902 MAPK1 KO cells subcutaneously injected (3 × 10⁶) in SHO mice treated with or without trametinib.
(F) Combined tumor volume growth kinetics of PA-TU-8902. sgRNA intergenic control, SHOC2 KO, and MAPK1 KO tumors. Statistical significance ***p ≤ 0.001 and ****p ≤ 0.0001, and error bars represent ± SEM.
We next investigated whether SHOC2 KO cooperated with trametinib treatment in vivo using an immunocompromised mouse xenograft model. We implanted SHOC2 KO or control cells subcutaneously into immunodeficient mice and observed potent trametinib sensitization of both SHOC2 KO and MAPK1 KO control cells in comparison to cells harboring a negative control sgRNA (Figures 5C–5F). We noted that SHOC2 KO decreased average tumor growth in the absence of MEKi by 44% (p = 0.0015). However, the combination of SHOC2 KO and trametinib treatment led to complete impairment of subcutaneous tumor progression in this model. To investigate the levels of p-ERK in the PA-TU-8902 SHOC2 KO or control tumors, we harvested tissue from two treated tumors after the fourth dose of trametinib (1 mg/kg) or vehicle treatment at approximately 20 days post-implantation and observed that loss of SHOC2 alone caused a modest relative decrease (30%–50%) in p-ERK level (Figure S5).
SHOC2 Mediates RTK Feedback Signaling in Response to MEK Inhibition
To characterize RTK activation in response to MEK inhibition with trametinib, we investigated the activation state of 49 distinct RTKs in five KRAS-mutant cell lines (NCI-H23, A549, NCI-H2030, MIA PaCa-2, and PA-TU-8902) utilizing phosphorylated-RTK arrays (Figures 6A and 6B; STAR Methods). We consistently observed a concerted upregulation of multiple RTKs in each cell line in response to trametinib (Figures 6A and 6B). To infer functional dependence on these RTKs, we evaluated the differential sensitivity scores for the top-four activated RTKs upon trametinib treatment for each respective cell line. We found that most of the activated RTKs that we observed, such as MET/HGFR, HER3, IR, and IGF-IR, demonstrated correspondingly negative differential sensitivity scores for the cell lines in which they are activated (Figure 6C). We observed strong upregulation of the MET/HGFR activity in PA-TU-8902 after 48 h of trametinib treatment, as assessed by RTK array (Figures 6A and 6B), and we confirmed this finding by immunoblotting for activated p-MET in PA-TU-8902 cells following trametinib addition (Figure 6D).
Figure 6. Impact of SHOC2 in RTK-Mediated Adaptive Response to MEKi Treatment.

(A) Receptor Tyrosine Kinase (RTK) arrays of NCI-H23, A549, NCI-H2030, MIA PaCa-2, and PA-TU-8902, treated with vehicle control (DMSO) and trametinib (20 nM) for 48 h.
(B) Heatmap of average densitometric quantification of two replicate spots (mean pixel density) is represented for each RTK.
(C) Network analysis depicting top four RTKs differentially activated in each RTK array, with edges colored by the relative differential sensitivity score (trametinib [TRAM]/DMSO) for each RTK from each respective cell-line screen.
(D) Immunoblot showing levels of p-MET and total MET in a time course of PA-TU-8902 cells treated with trametinib (10 nM).
(E) Representative immunoblot showing levels of SHOC2, p-AKT (S473), and p-ERK levels in PA-TU-8902 in response to trametinib (10nM) treatment at various time points.
(F) Relative densitometry of p-ERK/ERK levels assessed by immunoblot (as in E) normalized to control PA-TU-8902 at 0-h time point.
(G) Representative immunoblot of PA-TU-8902 parental cells (P), SHOC2 single-cell KO clones (SCC1 and SCC2), and SCC1/2 overexpressing SHOC2-V5 treated with DMSO or trametinib (10 nM) for 24 h.
(H) Relative densitometry of p-ERK/ERK levels assessed by immunoblot normalized to control PA-TU-8902. Parental line treated with trametinib.
(I) Immunoblot showing levels of p-AKT (S473) and p-ERK in serum-starved PA-TU-8902 pulsed with FBS (10%).
(J) Relative densitometry quantification of p-ERK levels normalized to total ERK in PA-TU-8902 pulsed with FBS.
(K) Immunoblot showing levels of p-AKT (S473) and p-ERK in serum-starved PA-TU-8902 pulsed with recombinant human HGF (10 ng/mL).
(L) PA-TU-8902 parental cells (P), SHOC2 single-cell KO clones (SCC1 and SCC2), and SCC1/2 overexpressing SHOC2-V5 treated with rhHGF (10 ng/mL) for 1 h.
(M) Relative densitometry quantification of p-ERK/ERK levels normalized to trametinib-treated PA-TU-8902 parental cells (P). For all experiments, data are represented as the mean of three or more independent biological replicates ± SEM, and statistics were derived via two-tailed t test; *p < 0.05, **p < 0.01, and ***p<0.001.
Given that SHOC2 is a positive regulator of RAF1-mediated MAPK signaling, we investigated the impact of SHOC2 suppression on MAPK pathway reactivation upon MEK inhibition. We examined the kinetics of p-ERK suppression and reactivation after trametinib treatment and found robust reactivation of p-ERK levels out to 96 h after trametinib treatment in control cells compared to markedly reduced p-ERK reactivation in SHOC2 knockdown cells (Figures 6E and 6F). We did not observe a substantial difference in levels of p-AKTSer473 in SHOC2 KO or control cells. We further confirmed this reduction of p-ERK levels in SHOC2 KO cells upon trametinib treatment and also demonstrated that exogenous expression of a SHOC2 cDNA restores p-ERK levels to the baseline post-treatment levels seen in the parental-cell-line control (Figures 6G and 6H). To extend these findings, we suppressed SHOC2 with small interfering RNAs (siRNAs) in additional lines A549, NCI-H23, MIA PaCa-2, and NCI-H2009 (Figure S6). Although we observed a variable range of p-ERK reduction at baseline upon SHOC2 loss across cell lines, we found SHOC2 loss conferred a consistent blunting of p-ERK reactivation in response to trametinib (Figures S6A and S6B).
To further investigate the possible connection between growth-factor-mediated-RTK activation of RAS-RAF-MAPK signaling through SHOC2, we serum starved PA-TU-8902 cells with SHOC2 targeting or control shRNAs, and then performed a time course analysis after pulsing cells with fetal bovine serum (FBS), a rich source of growth factor ligands to activate multiple RTK signaling pathways (Figures 6I and 6J). In control cells, we observed a rapid and robust reactivation of p-ERK upon addition of FBS that was significantly blunted in SHOC2-suppressed cells (Figures 6I and 6J). Moreover, we observed a similar reduction of p-ERK levels in PA-TU-8902 SHOC2 KO cells that have been serum starved and pulsed with HGF, the ligand for the MET receptor (Figures 6K–6M).
Evaluation of differential sensitivity scores from the CRISPR-MEKi screens revealed that SHOC2 exhibits strong positive correlations with various members of the RTK signaling pathway, including PTPN11, GRB2, SOS1, KRAS, BRAF1, and RAF1 (Figures S7A–S7G). To further investigate the relationship to PTPN11/SHP2 dependency, we compared the impact of SHOC2 knockdown to that of SHP2 inhibition with SHP099 on differential trametinib sensitivity in KRAS mutant cells A549 and NCI-H2030, as well as an expanded panel of cell lines, including breast and colorectal carcinoma cell lines (Figure S7H). We found a striking correlation between the degree of sensitization mediated by SHOC2 knockdown and SHP099 sensitivity during co-treatment with trametinib, suggesting parallel functional roles for SHP2 and SHOC2 in mediating RKT-feedback signaling in response to trametinib. We conclude that RTK activation plays a key role in upstream signaling to reactivate p-ERK in response to MEK inhibition whereby SHOC2 functions as a central node to facilitate RAF-MAPK pathway reactivation.
Acute Proteasomal Degradation of SHOC2 in Combination with Trametinib Potently Suppresses MAPK Signaling and Proliferation in KRAS Mutant Cancer Cells
The SHOC2 protein does not contain enzymatic domains that would be targetable by conventional small molecule inhibitors. However, we hypothesized that SHOC2 may be amenable to ligand-mediated protein degradation as a potential therapeutic strategy. We modeled this therapeutic approach with SHOC2 by utilizing the dTAG system, a chemical biology system that leverages cell-permeable heterobifunctional degraders to study the consequences of target protein degradation (Nabet et al., 2018). In this system, treatment of cells expressing a target protein fused to FKBP12F36V with the degrader small molecule dTAG-13 causes rapid CRBN E3 ligase-mediated ubiquitination and proteasomal degradation of the protein with high specificity (Nabet et al., 2018) (Figure 7A). We generated a SHOC2 expression construct with an amino-terminal FKBP12F36V tag (FKBP12F36V-SHOC2) and stably expressed this gene in PA-TU-8902 and MIA PaCa-2 SHOC2 KO SCCs.
Figure 7. Selective Small-Molecule-Mediated SHOC2 Degradation in Combination with Trametinib Potently Suppresses MAPK Signaling and Proliferation in KRAS Mutant Cancer Cells.

(A) Schematic representation of dTAG13-mediated degradation of FKBP12F36V-SHOC2 via CRBN E3 ligase complex ubiquitination and proteasomal degradation.
(B) Representative immunoblot of SHOC2 single-cell KO clones of PA-TU-8902 and MIA PaCa-2 expressing FKBP12F36V-SHOC2 treated with trametinib (10 nM) for 24 h and subsequently treated with dTAG13 compound or DMSO in a time course experiment.
(C) Proliferation assay (CTG) of SHOC2 KO clone, SHOC2 KO clone overexpressing SHOC2-V5, or FKBP12F36V-SHOC2 (PA-TU-8902 and MIA PaCa-2) cells after 6 days of treatment of trametinib (10 nM), dTAG13 (50 nM), or in combination. Bars represent mean of six experimental replicates ± SD.
To determine the effect of acute SHOC2 loss in the context of MEKi treatment and adaptive reactivation of p-ERK, we pretreated PA-TU-8902 and MIA PaCa-2 FKBP12F36V-SHOC2 cells with trametinib for 24 h (Figure 7B) followed by treatment with dTAG13 compound for 48 h. We observed robust loss of p-ERK at 1 h post-trametinib treatment and rebound of p-ERK within 24 h. Subsequent dTAG13 compound addition led to the full loss of SHOC2 protein within 30–60 min. Concurrently, we observed a reduction in p-MEK and p-ERK following SHOC2 degradation in the presence of trametinib. SHOC2 has been shown to mediate dephosphorylation of the inhibitory phosphorylation site S259 on RAF1 (Rodriguez-Viciana et al., 2006). We found that acute loss of SHOC2 in the presence of trametinib resulted in a modest increase in RAF1 p-S259 levels in both PA-TU-8902 (18%) and MIA PaCa-2 (56%) at 48 h post-dTAG13 treatment (Figure 7B).
Finally, to model a SHOC2 degrader therapeutic strategy and to test the functional impact of acute SHOC2 degradation on cell viability, we treated PA-TU-8902 and MIA PaCa-2 SHOC2 KO SCCs expressing either SHOC2-V5 or FKBP12F36V-SHOC2 with trametinib, dTAG13, or in combination (Figure 7C). While SHOC2 KO cells demonstrated profound sensitivity to trametinib treatment relative to DMSO, the restoration of SHOC2 expression by FKBP12F36V-SHOC2 imparted an equivalent degree of rescue in viability as SHOC2-V5 expression. Upon treatment with dTAG13 (leading to SHOC2 degradation) in combination with trametinib, we observed a strong and selective sensitization of FKBP12F36V-SHOC2 cells to trametinib treatment. Taken together, our results provide proof of concept for a SHOC2 degrader strategy as a potential therapeutic approach.
DISCUSSION
Employing first genome-scale and then secondary-focused CRISPR-Cas9 screening libraries, we have defined a comprehensive landscape of synthetic lethal interactions with MEK inhibition. We identified several classes of synthetic lethal interactors that scored recurrently in our CRISPR-MEKi screens, including genes encoding other MAPK pathway members, anti-apoptotic signaling proteins, integrin-related signaling partners, and proteins involved in heparan sulfate biology. In aggregate, these data provide a compendium of possible targets highlighting potential therapeutic opportunities for vertical inhibition of the MAPK signaling pathway as well as disruption of orthogonal signaling pathways to enhance MEK inhibitor efficacy.
We identified recurrent co-dependencies with MEKi, such as SHOC2, RAF1, MAPK1, and PTPN11. We also found remarkable heterogeneity for other strong modifiers of MEKi sensitivity, including numerous pharmacologically tractable synthetic lethal targets that scored as potent sensitizers to trametinib in only a subset of lines, such as BCL2L1, MCL1, MTOR, PTK2, and FGFR1. While the cell lines subjected to genome-scale screens within our study all harbor KRAS mutations, they differ in numerous other ways that could drive biologic differences and context specificity, including differing lineage (2 lung, 1 pancreas) and genetic features (Table S1). The heterogeneous nature of such functional dependencies highlights the key challenge of proper patient selection for therapeutic strategies. Without identifiable genomic biomarkers for most of these dependencies, our observations also suggest the potential of functional profiling (genetic, pharmacologic, or other) of patient-derived samples to identify specific cancer cell dependencies for the design of combination therapy regimens.
Most notably, we demonstrate that multiple additional perturbations to the RTK-RAS-MAPK pathway strongly cooperated with MEKi to inhibit proliferation and survival of RAS-driven cancer cells. Certain members of the MAPK pathway that scored in our CRISPR-MEKi screens, such as RAF1, BRAF, or MAPK1, likely reflect the added effect of further vertical suppression of the RAF-MEK-ERK signaling cascade in the context of partial inhibition of the pathway with trametinib. However, another class of targets clearly reflect disruption of upstream RTK-mediated signaling, including MET, FGFR1, GRB2, SOS, PTPN11, and SHOC2. Indeed, an integrative meta-analysis of signaling pathways enriched in all recurrent scoring synthetic lethal candidates further highlighted the strong representation of the RTK-RAS-MAPK pathway in the CRISPR-MEKi screening data (Figure 2). Moreover, RTK reactivation has been shown to be a mechanism of resistance to RAS-MAPK pathway inhibition in several contexts, with RTKs such as EGFR (Corcoran et al., 2012; Prahallad et al., 2015), ERBB3 (Kitai et al., 2016; Sun et al., 2014), FGFRs (Kitai et al., 2016; Lee et al., 2014; Manchado et al., 2016), and others (Ahmed et al., 2019; Ruess et al., 2018) playing major roles. Therefore, these findings support the hypothesis that compensatory signaling through RTK-RAS-MAPK pathways is essential for survival in the context of trametinib treatment.
We identified SHOC2 as the most recurrent and strongest synthetic lethal target with MEKi in KRAS mutant lung and pancreatic cancer cell lines. Additionally, disruption of SHOC2 sensitizes other RAS-driven cancer cell contexts to MEK inhibition, including EGFR- and NRAS mutant lung cancers, but not BRAF mutant lung cancer. KO or suppression of SHOC2 expression was found to potently cooperate most specifically with MEK inhibition; yet, we observed a mild, less consistent sensitization to ERK inhibitor treatment. However, SHOC2 loss had no significant impact on dose response curves with a KRASG12C inhibitor, a range of RAF inhibitors (ATP-competitive BRAF, paradox-breaker BRAF, and pan-RAF), or chemotherapy treatment. During the revision of our manuscript, Jones et al. demonstrated SHOC2 is required for RAF dimerization induced by MEK inhibition (Jones et al., 2019), and in corroboration with our findings, they reported that the loss of SHOC2 confers a selectively potent sensitization of KRAS mutant lung cancer cells to MEKi. RAF inhibition has been previously shown to promote RAF dimerization (Hatzivassiliou et al., 2010; Jin et al., 2017; Peng et al., 2015), and this was not inhibited by SHOC2 loss (Jones et al., 2019). ERK inhibition has also been shown to promote RAF dimerization that is SHOC2 dependent (Jones et al., 2019). However, p-ERK levels were unaffected by SHOC2 loss in the context of ERK inhibition (Jones et al., 2019). Additional biochemical studies of RAS-MAPK pathway signaling flux in the context of pathway inhibition will be necessary to fully understand the differential impact of SHOC2 loss in the context of MEK inhibition as compared to RAF or ERK inhibition.
SHOC2 has been reported to bind exclusively with MRAS and directly with the PP1c leading to dephosphorylation of c-RAF at S259 and consequent MAPK pathway activation (Rodriguez-Viciana et al., 2006; Simanshu et al., 2017). The ternary complex formed by MRAS, SHOC2, and PP1c mediates c-RAF activation through dephosphorylation at the negative regulatory site S259, leading to subsequent displacement of 14-3-3 and increased membrane localization (Rodriguez-Viciana et al., 2006; Simanshu et al., 2017; Young and Rodriguez-Viciana, 2018). This membrane localization promotes c-RAF dimerization and activation of the RAS-RAF-MAPK signaling pathway. Indeed, we found a modest increase in p-S259 c-RAF following acute SHOC2 loss in the presence of trametinib. These findings corroborate those of Jones and colleagues, who similarly found that the loss of SHOC2 leads to an increase in the inhibitory “p-S259” site of RAF1 and the equivalent site of BRAF in response to trametinib treatment, preventing RAF dimerization and downstream signaling to reactivate ERK1/2 (Jones et al., 2019). MRAS itself is a weak activator of MAPK signaling (Kimmelman et al., 2002; Young and Rodriguez-Viciana, 2018), and in our genome-scale screens, we did not observe MRAS as a synthetic lethal partner with MEKi. Furthermore, unlike other pathway members of the RTK signaling pathway, the gene essentiality profile of MRAS failed to correlate with SHOC2 (data not shown). These observations suggest that SHOC2 may function outside of the Noonan-like-syndrome-associated MRAS/SHOC2/PP1C ternary complex in the context of MEKi treatment of KRAS mutant cancers. Li and colleagues had previously found that SHOC2 interacts with KRAS, HRAS, and NRAS G12V mutants with a high degree of specificity (Li et al., 2000); however, uncertainty remains regarding the interactions of SHOC2 and other RAS isoforms. Taken together, further studies are warranted to evaluate the specific RAS/SHOC2 complex that is involved in MEKi sensitivity of mutant KRAS cells.
Our observations suggest a critical role for SHOC2 in mediating the proliferation and survival of RAS-driven cancer cells in the context of MEK inhibition. We demonstrate that multiple heterogeneous RTKs are consistently activated in response to MEK inhibition across multiple KRAS mutant cancer cell lines and that SHOC2 depletion blunts the reactivation of MAPK signaling observed in control cells. Most of these RTKs showed modest synthetic lethal interactions within the screens of corresponding cell lines (Figure 6). The phenomenon of cancer cells exhibiting compensatory upregulation of multiple RTKs in response to MAPK inhibition motivated the rationale in targeting SHP2, a ubiquitous node downstream of multiple RTK signaling pathways, in combination with various MAPK inhibitors to prevent RTK-mediated adaptive resistance (Fedele et al., 2018; Mainardi et al., 2018; Nichols et al., 2018; Ruess et al., 2018). Indeed, we found parallel function of SHOC2 to be a central node in RTK signaling, as determined by strong positive correlation in gene essentiality profiles of SHOC2 and PTPN11 within our screens, as well as strongly correlated effects of SHP2 inhibitor treatment and SHOC2 loss in combination with MEKi treatment across an expanded panel of cell lines. SHOC2 may offer an additional therapeutic target as a critical node mediating feedback reactivation of p-ERK signaling.
Intriguingly, we found that depletion of SHOC2 had no effect on baseline proliferation in two-dimensional culture. In three-dimensional, non-adherent culture conditions, as well as in an in vivo subcutaneous xenograft model, we observed a modest dependency on SHOC2 in the absence of MEKi treatment, consistent with recent CRISPR-Cas9 screening data that showed SHOC2 is essential for proliferation of non-adherent RAS mutant leukemia lines (Wang et al., 2017b). These findings suggest that mechanisms of RAS-RAF-MAPK activation differ between two- and three-dimensional growth culture conditions. Indeed, recent studies that examined the consequences of pharmacologic inhibition of KRASG12C in lung cancer models demonstrated that RAS-pathway dependency appears to be more pronounced in three-dimensional culture compared with two-dimensional culture (Janes et al., 2018). In a recent study that was published during the review of this paper, Boned del Rio et al. describe a SHOC2-independent mechanism of sustained p-ERK activation mediated by internalization of palmitoylated H/NRAS and cRAF that requires FAK/PAK-mediated phosphorylation and activation of cRAF (Boned Del Río et al., 2019). Our CRISPR-MEKi screens conducted in two-dimensional culture demonstrate multiple integrins and integrin-related signaling pathway members as synthetic lethal candidates, including IT-GAV, ITGB1, CRKL, and RAC1. We surmise that the loss of integrin-mediated ERK phosphorylation in three-dimensional growth conditions may result in a preferential dependence on SHOC2-mediated ERK activation for sustained ERK signaling and survival. Furthermore, the interaction of SHOC2 and SCRIB may coordinate regulation of RAC1 signaling and other cell polarity pathways to impact ERK signaling (Young et al., 2013). Thus, integrin-related signaling may play a fundamental role in coordinating RAS-pathway activation independent of SHOC2, thus allowing SHOC2 to be dispensable in two-dimensional growth but dependent in three-dimensional culture conditions.
The SHOC2 protein is composed almost entirely of leucine-rich repeats and appears to be a challenging target for small molecule development. However, the ternary complex composed of MRAS, SHOC2, and PP1c plays a fundamental role in the dephosphorylation of S259 on RAF1, raising the possibility for development of small molecules that target novel ligand pockets in SHOC2 within this enzymatic complex. Achievement of small molecules that bind SHOC2 could enable ligand-mediated protein degradation approaches for therapeutic development (Lu et al., 2014; Olson et al., 2018; Winter et al., 2015). In proof-of-concept experiments using the dTAG system to model acute degradation of SHOC2 (Figure 7), we demonstrated the feasibility of small-molecule-mediated proteasomal degradation of the SHOC2 protein. Moreover, this approach blunted p-ERK reactivation and potently decreased the viability of KRAS mutant cells in the context of trametinib treatment. These data provide a compelling basis for future therapeutic efforts in developing degrader compounds that directly bind the SHOC2 protein and target it for degradation in combination with MEKi. While PP1c has numerous cellular targets, the specific PP1c conformation within the complex of MRAS and SHOC2 may also provide unique opportunities for targeting its RAF activation function (Rodriguez-Viciana et al., 2006). Further structural study of SHOC2 alone and within the MRAS: SHOC2:PP1 ternary complex will undoubtedly inform therapeutic development efforts.
STAR★METHODS
LEAD CONTACT AND MATERIALS AVAILABILITY
Further information and requests for resources and reagents may be directed to Andrew J. Aguirre (Lead Contact; andrew_aguirre@dfci.harvard.edu). Plasmids generated in this study (pLX311-SHOC2-V5 and pLEX305_FKBP12F36V-SHOC2) have been deposited to Addgene.
EXPERIMENTAL MODEL AND SUBJECT DETAILS
Cell Lines and Reagents
Cells were grown in the following media supplemented with 2 mM glutamine, 50 U/mL penicillin, 50 U/mL of streptomycin (GIBCO), and 10% fetal bovine serum (Sigma): DMEM (CFPAC-1, A549, NCI-H23, PA-TU-8902, KP4, MIA PaCa-2, NCI-H1975), RPMI 1640 (NCI-H2009, NCI-H2030, Panc 10.05, SU.86.86, HCC364, NCI-H1299, MDA-MB-157, MDA-MB-436), McCoy’s 5A (HCT116), Ham’s F-12 (LOVO) and incubated at 37°C in 5% CO2. Male derived cell lines: CFPAC-1, A549, NCI-H23, KP4, MIA PaCa-2, NCI-H2030, Panc 10.05, HCC364, NCI-H1299, HCT116, and LOVO. Female derived cell lines: PA-TU-8902, NCI-H1975, NCI-H2009, SU.86.86, MDA-MB-157, and MDA-MB-436. Cells stably expressing Cas9 were generated by lentiviral infection with pLX311-Cas9 virus. Infection was done at 1.5E6 cells/well of a 12 well plate. To confirm efficient Cas9 activity an sgRNA for EGFP was introduced using a lentivirus vector (pXPR_011-sgEGFP) that also contains EGFP as a target, and the percentage of GFP negative cells was assessed (Doench et al., 2014). Genome-wide screens were conducted in lines that displayed a minimum of 70% Cas9 activity.
Generation of Isogenic Cell Lines
PA-TU-8902 cells were infected with virus expressing SHOC2 sgRNA, MAPK1 sgRNA, or an intergenic non-cutting control. Guide sequences are indicated in above table. Infection protocol is the same as was used for the secondary screens. Following puromycin selection, cells were serially diluted and plated using a Combi Multidrop Dispenser (ThermoFisher) at 1 cell per well of a 96-well plate. Media was changed every 3–4 days, and wells were monitored for single colonies. As wells became confluent, cells were expanded to larger wells to permit expansion. These cells were eventually collected to freeze (in FBS + 10% DMSO) and to analyze SHOC2/MAPK1 protein levels via Immunoblot.
Generation of tet-Inducible shRNA Stable Cell Lines
SMARTvector Inducible shRNA Lentivirus (Dharmacon) were used to generate PA-TU-8902 and NCIH2009 stable lines with tet-inducible shRNA targeting SHOC2 (V3SH11252-228554809; V3SH11252-226496368) and non-targeting shRNA control (VSC11657; VSC11501). Following infection, cells were put under puromycin selection.
Mice
Studies were approved by the Broad Institute’s Institutional Animal Care and Use Committee (IACUC) under animal protocol 0035-01-15. IACUC guidelines on the ethical use and care of animals were followed. Female SCID Hairless Outbred (SHO) mice obtained from Charles River Laboratories
METHODS DETAILS
Trametinib Titration for CRISPR-Cas9 Screens
The doses of trametinib to use in these screens were determined by propagating cells in different concentrations of trametinib to determine the effect on cell proliferation. In parallel, the level of phospho-ERK depletion in cells treated with different concentrations of trametinib was determined. For the proliferation assay, 1.5 × 10e6 cells were seeded in 10 cm plates and cells were immediately treated with different concentrations of trametinib. Cells were passaged every 4 days, and cells were counted at each passage. Protein samples were harvested at each count and phospho-ERK levels were assessed by immunoblot analysis.
Determination of Infection Conditions for CRISPR Pooled Screens
Optimal infection conditions were determined in each cell line in order to achieve 30%–50% infection efficiency, corresponding to a multiplicity of infection (MOI) of ~0.5 – 1. Spin-infections were performed in 12-well plate format with 3 × 10e6 cells per well. Optimal conditions were determined by infecting cells with different virus volumes (0, 25, 50, 75, 150, 300 uL for NCI-H23 and 0, 25, 75, 150, 300, 500 uL for A549) with a final concentration of 4 ug/mL polybrene. Cells were spun for 2 hours at 930 g at 30°C. Approximately 24 hours after infection, cells were trypsinized and 1.5 × 10e5 cells from each infection were seeded in 2 wells of a 6-well plate, each with complete medium, one supplemented with the appropriate concentration of puromycin. Cells were counted 3 days post selection to determine the infection efficiency, comparing survival with and without puromycin selection. Volumes of virus that yielded ~30%–50% infection efficiency were used for screening.
Genome Scale CRISPR Resistance Screens
The Avana-4 barcoded sgRNA library contains 74,687 sgRNA, which includes an average of 4 guides per gene and 1000 non -targeting control guides (Doench et al., 2014). Screening-scale infections were performed with the pre-determined volume of virus in the same 12-well format as the viral titration described above and infected wells were pooled 24 hr post-centrifugation. Infections were performed with at least 1.1 × 10e8 cells per replicate, in order to achieve a representation of at least 500 cells per sgRNA following puromycin selection (~4 × 10E7 surviving cells). Approximately 24 hours after infection, all wells within a replicate were pooled and split into T225 flasks. Puromycin was added to remove uninfected cells and selection maintained for 4 days. After a 48-hour washout of puromycin, 4 × 10e7 cells were seeded in 2-Stack culture chambers (Corning #3269) in media with 10 nM trametinib or DMSO control on day 7 post-infection. Cells were passaged in fresh media containing drugs every 3–4 days. Cells were harvested 14 days after initiation of treatment.
For all screens, genomic DNA (gDNA) was isolated using Maxi (3 × 10e7−1 × 10e8 cells) kits according to the manufacturer’s protocol (QIAGEN). PCR and sequencing were performed as previously described (Doench et al., 2016; Piccioni et al., 2018). Samples were sequenced on a HiSeq2000 (Illumina). For analysis, the read counts were normalized to reads per million and then log2 transformed. The log2 fold-change of each sgRNA was determined relative to the initial time point for each biological replicate.
Secondary Focused Library and CRISPR-Cas9 Screens
The secondary screening sgRNA library was prepared as previously described (Doench et al., 2016). Top scoring genes with a Differential Sensitivity Score (trametinib versus DMSO control) having a rank score of 3 or higher by the STARS algorithm (Doench et al., 2016) were chosen from among the three genome-scale CRISPR-MEKi screens described here as well as a fourth previously published CRISPR-MEKi screen in the PA-TU-8988T cell line (Wang et al., 2017a) (Table S3). For library construction, we utilized the pXPR-BRD003 all-in-one vector expressing CAS9 and a single sgRNA targeting a gene of interest (Doench et al., 2016). In total, this library contained sgRNAs targeting 527 experimental genes and 116 positive control cell essential genes, with six sgRNAs per gene. Additionally, we included 1083 non-targeting and non-genic targeting sgRNAs. The total number of sgRNAs in the library was 4831. trametinib dose was determined in the same way as the genome-scale screens. The infection and screening protocols were similar to the genome-scale screen; cells were treated with puromycin 24 hours post-infection and remained under puromycin selection for 6 days before adding trametinib or DMSO. Screens were conducted with a representation of 1000 cells/sgRNA.
Analysis of Genome Scale and Secondary Focused CRISPR-MEKi Screens
For genome-scale screens, the log2(fold-change) (LFC) in sgRNA representation was calculated between the 14-day treatment endpoint for cells treated with trametinib or DMSO control and the initial pool of sgRNAs plasmid used to generate virus. For focused secondary screens, the LFC was calculated using the 14-day treatment endpoint and an early time point 7 days post-infection and immediately prior to initiation of treatment. To identify genes whose depletion modified the response to MEKi, we averaged the measured abundance of guides targeting each gene to calculate gene-level scores. Specifically, we calculated a “Trametinib Sensitivity Score” and a “DMSO Sensitivity Score” reflecting the mean log2-fold change between the endpoint (14 days in trametinib or control) and an early time point (immediately post-selection) for all sgRNAs targeting each gene in the trametinib and control arms of the screen, respectively (STAR Methods). We then compared the trametinib-treated arm with the control DMSO-treated arm of each screen to yield a “Differential Sensitivity Score,” reflecting the preferential dependence of each gene in the presence of trametinib. We prioritized candidates that showed enhanced depletion in the context of MEK inhibition and were also strongly depleted in the trametinib arm of the screen, thus displaying highly negative Differential Sensitivity Scores and Trametinib Sensitivity Scores.
STARS analysis v1.3 was performed in order to collapse guide-level data to genes. STARS analysis was performed as previously described (Doench et al., 2016). The code for STARS analysis is written in Python, and is available on the Broad Institute’s website: http://www.broadinstitute.org/rnai/public/software/index.
Meta-analysis of CRISPR-MEKi Screening Data
We used the Metascape suite of tools to perform a meta-analysis of pathway and protein-protein interaction (PPI) enrichment among these synthetic lethal candidates scoring in two or more of the CRISPR-MEKi screens. Metascape is a publicly available web-based pathway enrichment and clustering algorithm (http://metascape.org; STAR Methods)(Tripathi et al., 2015). Genes were included in the analysis if they scored in one or more screens with a Differential Sensitivity Score having an FDR ≤ 0.25 by the STARS algorithm and a Trametinib Sensitivity Score of ≤ −0.5 or ≥ 0.5 for the negative selection (MEKi sensitizer) or positive selection (MEKi resistance) analyses, respectively. To specifically interrogate known signaling pathways represented within the MEKi modifier screen data, we focused the enrichment analysis on the MSigDB Canonical Pathways database. For each given gene list, protein-protein interaction enrichment analysis was conducted with the BioGrid, InWeb_IM and OmniPath databases per the standard metascape algorithm. The resultant networks contain the subset of proteins that form physical interactions with at least one other member in the list. If the network contains between 3 and 500 proteins, the Molecular Complex Detection (MCODE) algorithm (Bader and Hogue, 2003) was been applied to identify densely connected network components. The network displays and integrated data representations for each figure were derived from standard plots generated by the Metascape software.
Generation of Expression Constructs
Wobble mutants were introduced into SHOC2 ORF (SHOC2 transcript NM007373.3) to allow for SHOC2 protein expression in the presence of SHOC2 sgRNAs. Both the NGG PAM sequence and the first amino acid in the guide sequence were mutated using the QuikChange Lightning Multi Site-Directed Mutagenesis Kit (Agilent Technologies, 210515). Original ORF sequence, mutated sequences, and FKBP12F36V tagged sequences are below.
Wild-Type SHOC2 ORF cDNA
ATGAGTAGTAGTTTAGGAAAAGAAAAAGACTCTAAAGAAAAAGATCCCAAAGTACCATCAGCCAAGGAAAGAGAAAAGGAGGCAAAAGCCTCTGGAGGTTTTGGGAAAGAGAGCAAAGAAAAAGAACCTAAGACCAAAGGGAAAGATGCCAAAGATGGAAAGAAGGACTCCAGTGCTGCCCAACCAGGGGTGGCATTTTCAGTTGACAATACGATCAAACGGCCAAACCCAGCACCTGGGACTAGAAAAAAATCCAGCAATGCAGAGGTGATTAAAGAGCTCAACAAATGCCGGGAAGAGAATTCAATGCGTTTGGACTTATCCAAGAGATCTATACACATATTGCCATCATCAATCAAAGAGTTGACTCAATTAACAGAACTTTATTTATACAGTAACAAATTGCAGTCCCTCCCAGCAGAGGTGGGATGTTTAGTAAATCTCATGACACTGGCTCTAAGTGAAAATTCACTTACCAGTTTGCCTGACTCTCTTGATAACTTGAAGAAGCTGCGGATGCTTGATTTACGGCATAATAAACTGAGAGAAATTCCTTCAGTGGTGTATAGGCTGGATTCTCTCACCACTCTTTACCTTCGCTTTAATCGTATAACTACTGTGGAAAAGGACATCAAAAACTTGTCAAAACTCAGCATGCTTAGCATTCGAGAGAACAAAATTAAACAACTACCTGCTGAAATTGGTGAATTATGTAACCTCATTACGCTGGATGTAGCTCACAATCAACTTGAACACCTTCCAAAGGAGATTGGAAACTGTACACAGATAACCAACCTTGACTTGCAGCACAATGAACTGCTAGACCTCCCAGATACTATAGGAAACCTGTCCAGTTTAAGTCGTCTTGGTCTGAGATATAACAGACTGTCAGCAATACCCAGATCATTAGCAAAATGCAGTGCACTTGAAGAATTAAATTTAGAGAACAATAACATTTCTACTTTACCAGAGAGTCTTTTATCAAGTCTTGTGAAACTGAATAGTTTGACCTTAGCTAGAAATTGCTTCCAGTTGTATCCAGTGGGTGGTCCATCTCAGTTTTCTACCATCTATTCCCTCAACATGGAACACAATCGAATCAACAAAATTCCATTTGGAATTTTCTCCAGAGCAAAAGTATTAAGTAAGCTGAATATGAAGGACAATCAGTTAACATCACTTCCCTTGGATTTTGGAACTTGGACCAGTATGGTAGAATTGAATTTAGCCACTAATCAGCTCACAAAGATCCCTGAGGATGTGTCTGGTCTCGTTTCTCTTGAGGTTCTTATCTTATCAAACAATCTTCTAAAGAAGCTTCCCCATGGTCTTGGAAACCTTAGGAAGTTAAGAGAGTTGGATCTAGAAGAGAACAAATTGGAATCCTTGCCAAATGAAATTGCATATCTTAAGGATTTACAGAAATTAGTCTTGACAAACAACCAGTTGACCACTCTTCCCAGAGGCATTGGTCACCTTACTAATCTCACACATCTGGGCCTTGGAGAGAACCTACTTACTCACCTTCCTGAAGAAATTGGTACACTGGAGAACCTAGAAGAACTGTATTTGAATGACAACCCCAACCTGCATAGCCTTCCCTTTGAGCTGGCACTCTGCAGCAAGCTTTCAATCATGAGTATTGAGAACTGTCCACTCAGTCACCTTCCACCTCAGATTGTTGCTGGGGGGCCTTCTTTCATCATTCAGTTCTTAAAGATGCAGGGTCCATATCGTGCCATGGTC
Mutagenized SHOC2 ORF: Guides 2 and 3 (Used to Make PA-TU-8902 Cell Lines SCC1, SCC2 and SSC3)
ATGAGTAGTAGTTTAGGAAAAGAAAAAGACTCTAAAGAAAAAGATCCCAAAGTACCATCAGCCAAGGAAAGAGAAAAGGAGGCAAAAGCCTCTGGAGGTTTTGGGAAAGAGAGCAAAGAAAAAGAACCTAAGACCAAAGGGAAAGATGCCAAAGATGGAAAGAAGGACTCCAGTGCTGCCCAACCAGGGGTGGCATTTTCAGTTGACAATACGATCAAACGGCCAAACCCAGCACCTGGGACTAGAAAAAAATCCAGCAATGCAGAGGTGATTAAAGAGCTCAACAAATGCCGGGAAGAGAATTCAATGCGTTTGGACTTATCCAAGAGATCTATACACATATTGCCATCATCAATCAAAGAGTTGACTCAATTAACAGAACTTTATTTATACAGTAACAAATTGCAGTCCCTCCCAGCAGAGGTGGGATGTTTAGTAAATCTCATGACACTGGCTCTAAGTGAAAATTCACTTACCAGTTTGCCTGACTCTCTTGATAACTTGAAGAAGCTGCGGATGCTTGATTTACGGCATAATAAACTGAGAGAAATTCCTTCAGTGGTGTATAGGCTGGATTCTCTCACCACTCTTTATCTTCGATTTAATCGTATAACTACTGTGGAAAAGGACATCAAAAACTTGTCAAAACTCAGCATGCTTAGCATTCGAGAGAACAAAATTAAACAACTACCTGCTGAAATTGGTGAATTATGTAATCTCATCACGCTGGATGTAGCTCACAATCAACTTGAACACCTTCCAAAGGAGATTGGAAACTGTACACAGATAACCAACCTTGACTTGCAGCACAATGAACTGCTAGACCTCCCAGATACTATAGGAAACCTGTCCAGTTTAAGTCGTCTTGGTCTGAGATATAACAGACTGTCAGCAATACCCAGATCATTAGCAAAATGCAGTGCACTTGAAGAATTAAATTTAGAGAACAATAACATTTCTACTTTACCAGAGAGTCTTTTATCAAGTCTTGTGAAACTGAATAGTTTGACCTTAGCTAGAAATTGCTTCCAGTTGTATCCAGTGGGTGGTCCATCTCAGTTTTCTACCATCTATTCCCTCAACATGGAACACAATCGAATCAACAAAATTCCATTTGGAATTTTCTCCAGAGCAAAAGTATTAAGTAAGCTGAATATGAAGGACAATCAGTTAACATCACTTCCCTTGGATTTTGGAACTTGGACCAGTATGGTAGAATTGAATTTAGCCACTAATCAGCTCACAAAGATCCCTGAGGATGTGTCTGGTCTCGTTTCTCTTGAGGTTCTTATCTTATCAAACAATCTTCTAAAGAAGCTTCCCCATGGTCTTGGAAACCTTAGGAAGTTAAGAGAGTTGGATCTAGAAGAGAACAAATTGGAATCCTTGCCAAATGAAATTGCATATCTTAAGGATTTACAGAAATTAGTCTTGACAAACAACCAGTTGACCACTCTTCCCAGAGGCATTGGTCACCTTACTAATCTCACACATCTGGGCCTTGGAGAGAACCTACTTACTCACCTTCCTGAAGAAATTGGTACACTGGAGAACCTAGAAGAACTGTATTTGAATGACAACCCCAACCTGCATAGCCTTCCCTTTGAGCTGGCACTCTGCAGCAAGCTTTCAATCATGAGTATTGAGAACTGTCCACTCAGTCACCTTCCACCTCAGATTGTTGCTGGGGGGCCTTCTTTCATCATTCAGTTCTTAAAGATGCAGGGTCCATATCGTGCCATGGTC
SHOC2 ORF N-term Tagged with FKBP12F36V (Used to Generate FKBP12F36V-SHOC2 PA-TU-8902 and MIA PaCa-2)
GGAGTGCAGGTGGAAACCATCTCCCCAGGAGACGGGCGCACCTTCCCCAAGCGCGGCCAGACCTGCGTGGTGCACTACACCGGGATGCTTGAAGATGGAAAGAAAGTTGATTCCTCCCGGGACAGAAACAAGCCCTTTAAGTTTATGCTAGGCAAGCAGGAGGTGATCCGAGGCTGGGAAGAAGGGGTTGCCCAGATGAGTGTGGGTCAGAGAGCCAAACTGACTATATCTCCAGATTATGCCTATGGTGCCACTGGGCACCCAGGCATCATCCCACCACATGCCACTCTCGTCTTCGATGTGGAGCTTCTAAAACTGGAAGGCGGCTACCCCTACGACGTGCCCGACTACGCCGGCTATCCGTATGATGTCCCGGACTATGCAGGCATCGATAGATCAACAAGTTTGTACAAAAAAGTTGGCATGAGTAGTAGTTTAGGAAAAGAAAAAGACTCTAAAGAAAAAGATCCCAAAGTACCATCAGCCAAGGAAAGAGAAAAGGAGGCAAAAGCCTCTGGAGGTTTTGGGAAAGAGAGCAAAGAAAAAGAACCTAAGACCAAAGGGAAAGATGCCAAAGATGGAAAGAAGGACTCCAGTGCTGCCCAACCAGGGGTGGCATTTTCAGTTGACAATACGATCAAACGGCCAAACCCAGCACCTGGGACTAGAAAAAAATCCAGCAATGCAGAGGTGATTAAAGAGCTCAACAAATGCCGGGAAGAGAATTCAATGCGTTTGGACTTATCCAAGAGATCTATACACATATTGCCATCATCAATCAAAGAGTTGACTCAATTAACAGAACTTTATTTATACAGTAACAAATTGCAGTCCCTCCCAGCAGAGGTGGGATGTTTAGTAAATCTCATGACACTGGCTCTAAGTGAAAATTCACTTACCAGTTTGCCTGACTCTCTTGATAACTTGAAGAAGCTGCGGATGCTTGATTTACGGCATAATAAACTGAGAGAAATTCCTTCAGTGGTGTATAGGCTGGATTCTCTCACCACTCTTTATCTTCGATTTAATCGTATAACTACTGTGGAAAAGGACATCAAAAACTTGTCAAAACTCAGCATGCTTAGCATTCGAGAGAACAAAATTAAACAACTACCTGCTGAAATTGGTGAATTATGTAATCTCATCACGCTGGATGTAGCTCACAATCAACTTGAACACCTTCCAAAGGAGATTGGAAACTGTACACAGATAACCAACCTTGACTTGCAGCACAATGAACTGCTAGACCTCCCAGATACTATAGGAAACCTGTCCAGTTTAAGTCGTCTTGGTCTGAGATATAACAGACTGTCAGCAATACCCAGATCATTAGCAAAATGCAGTGCACTTGAAGAATTAAATTTAGAGAACAATAACATTTCTACTTTACCAGAGAGTCTTTTATCAAGTCTTGTGAAACTGAATAGTTTGACCTTAGCTAGAAATTGCTTCCAGTTGTATCCAGTGGGTGGTCCATCTCAGTTTTCTACCATCTATTCCCTCAACATGGAACACAATCGAATCAACAAAATTCCATTTGGAATTTTCTCCAGAGCAAAAGTATTAAGTAAGCTGAATATGAAGGACAATCAGTTAACATCACTTCCCTTGGATTTTGGAACTTGGACCAGTATGGTAGAATTGAATTTAGCCACTAATCAGCTCACAAAGATCCCTGAGGATGTGTCTGGTCTCGTTTCTCTTGAGGTTCTTATCTTATCAAACAATCTTCTAAAGAAGCTTCCCCATGGTCTTGGAAACCTTAGGAAGTTAAGAGAGTTGGATCTAGAAGAGAACAAATTGGAATCCTTGCCAAATGAAATTGCATATCTTAAGGATTTACAGAAATTAGTCTTGACAAACAACCAGTTGACCACTCTTCCCAGAGGCATTGGTCACCTTACTAATCTCACACATCTGGGCCTTGGAGAGAACCTACTTACTCACCTTCCTGAAGAAATTGGTACACTGGAGAACCTAGAAGAACTGTATTTGAATGACAACCCCAACCTGCATAGCCTTCCCTTTGAGCTGGCACTCTGCAGCAAGCTTTCAATCATGAGTATTGAGAACTGTCCACTCAGTCACCTTCCACCTCAGATTGTTGCTGGGGGGCCTTCTTTCATCATTCAGTTCTTAAAGATGCAGGGTCCATATCGTGCCATGGTCTGC
siRNA Transfection
Cells were transfected with 25nM siRNA oligo mix utilizing DharmaFECT 1 Transfection Reagent (Horizon, T-2001) for 24hrs per manufacturer’s protocol. Following 24hr post-transfection, cells were seeded into indicated assays or total protein harvested.
Short-Term Proliferation Assays and Quantitative Analysis
Cells were seeded in black, opaque-bottom 384-well plates (Costar) and treated with DMSO or Drug using a Tecan D300e drug printer. 6 days after seeding, cell viability was assessed by Cell-Titer-Glo (CTG) (Promega) according to manufacturer’s protocol. All treated wells were normalized to the appropriate DMSO control wells in order to assess viability.
Clonogenic Assays
Cells were fixed with 4% paraformaldehyde in PBS for 15 min followed by one-time wash with water. 1 % Crystal violet solution (50 mg crystal violet powder dissolved in 5 mL ethanol and 45 mL water) was added for 20 min. The stain was washed 3 times with water and plates were left to dry overnight. 10% acetic acid was used for extraction and absorbance was measure at 590 nm.
Short-Term Growth In Low Attachment Assays
PA-TU-8902 stably expressing tet-inducible non-targeting shRNA control shSHOC2 were pre-treated with doxycycline for 72 hours and seeded into 96 well Ultra-Low Attachment plates (Corning; 3904) at 1,000 cells/well. Cells were subsequently treated with trametinib (10nM) or vehicle control (DMSO). 6 days following treatment, cell viability was determined by Cell-Titer-Glo (CTG) (Promega; G7570) utilizing EnVision Plate Reader (PerkinElmer).
Three-Dimensional (3D) Culture Assays
For 3D sensitivity testing with trametinib, PA-TU-8092 parental or SHOC2 knockout cell lines were trypsinized and dissociated to single cells, resuspended in 100% Matrigel domes at a density of 2000/ul, and seeded in 8 ul droplets into tissue-culture treated 96-well plates (Greiner Bio-one). After incubating the cell/Matrigel droplets at 37°C for 30 minutes, culture media was added to each well. After 24 hours, cells were treated with either 10 nM trametinib or DMSO vehicle control. Cells were cultured for 8 days in the presence trametinib before assessing viability by adding 50 uL of Cell-Titer-Glo 3D to each well, incubating for 1 hour at room temperature on a shaker, and measuring luminescence using an EnVision plate reader (PerkinElmer). Each condition was performed in triplicate, and each dose point was normalized to DMSO controls to estimate relative viability. At least 2 independent experiments were performed for each cell line.
In Vivo Xenograft Experiments
For each treatment group (intergenic, SHOC2 KO and MAPK1 KO), two PA-TU-8902 single cell clones were pooled at a 1:1 ratio (3e6 cells each for a total of 6e6 cells) and inoculated subcutaneously into the left and right hind flank of ~10-week old female SCID Hairless Outbred (SHO) mice. Tumors were measured twice weekly with calipers and the tumor volumes were calculated using the formula: pi/6 × (width2 × length). When primary tumor volumes reached ~100 mm3 (16 days post inoculation), the mice were randomized into different treatment groups and dosed with either vehicle control (0.5% w/w HPMC, 0.4% w/w Tween 80 in 0.05 N HCL) or 1 mg/kg trametinib PO daily for 4 weeks. Animal body weights were recorded twice weekly during the course of all studies.
Immunoblot Analysis
Cells were lysed using RIPA buffer (R0278; Sigma-Aldrich), quantified using BCA Protein Assay Kit (23227; Thermo Scientific), resolved on 4%–12% Bis-Tris gel, and transferred onto nitrocellulose membrane (IB23001; Thermo Scientific) utilizing iBlot 2 Dry Blotting System (IB21001; Thermo Scientific). All immunoblots were incubated with indicated primary antibodies and imaged using Odyssey CLx infrared imager (LICOR). Densitometry analysis was conducted using Fiji image-analysis software (Schindelin et al., 2012).
In-Cell Western Assay
Cells were seeded in black, clear bottom 96 well plate (Corning, 3904) and treated with indicated, varying doses of trametinib. 48 hours post-treatment, cells were fixed in Formalin 10%, permeabilized with PBST (.1% TritonX), blocked with Odyssey Blocking Buffer (LICOR,927-40000), and incubated in primary antibody overnight for p-ERK (Cell Signaling, 9101S) and total ERK (Cell Signaling, 9102S). Wells were washed, incubated with secondary antibodies anti-Mouse (926-32210) and anti-Rabbit (926-68071), and imaged using Odyssey CLx infrared imager (LICOR). Densitometry analysis was conducted using Fiji image-analysis software (Schindelin et al., 2012).
Receptor Tyrosine Kinase (RTK) Arrays
NCI-H23, A549, NCI-H2030, MIA PaCa-2, and PA-TU-8902 were treated with 20nM trametinib or DMSO control. Protein was harvested at 48 hours post-trametinib treatment. Lysates were quantified using BCA Protein Assay Kit (23227; Thermo Scientific), and 300ug of lysates were subjected to Human Phospho-Receptor Tyrosine Kinase Array Kit (ARY001B; R&D Systems) per manufacturer’s protocol. Densitometry analysis was conducted using Fiji image-analysis software (Schindelin et al., 2012).
FBS or HGF Pulse Experiments
PA-TU-8902 stably expressing tet-inducible non-targeting shRNA control or shSHOC2 were pre-treated with doxycycline for 72 hours. Cells were subsequently serum starved overnight in DMEM - 0% FBS and pulsed with DMEM - 10%FBS or 10 ng/mL h-rHGF. Total protein was harvested and 10ug of lysates were subjected to immunoblotting.
QUANTIFICATION AND STATISTICAL ANALYSIS
STARS algorithm v1.3 was utilized to determine differential sgRNA levels (TRAM – DMSO) for all screens (Avana and Secondary Validation Library) and False Discovery Rate (FDR) calculated for each gene. All line and bar graphs represent the mean of at least three independent experiments, unless indicated otherwise. Statistical analysis was calculated using 2-tailed Student’s t test using Excel and GraphPad Prism 8. For in vivo experiments, unpaired, two-tailed Student’s t tests were used to assess differences in tumor volumes between treatment groups.
DATA AND CODE AVAILABILITY
The datasets generated during this study are available at Figshare [https://doi.org/10.6084/m9.figshare.9544061.v1].
Supplementary Material
KEY RESOURCES TABLE
| REAGENT or RESOURCE | SOURCE | IDENTIFIER |
|---|---|---|
| Antibodies | ||
| SHOC2 | Cell Signaling Technology | Cat# 53600S; RRID: AB_2799440 |
| MAPK1 | Cell Signaling Technology | Cat# 4695; RRID: AB_390779 |
| P-ERK1/2 | Cell Signaling Technology | Cat# 9101S; RRID: AB_331646 |
| ERK1/2 | Cell Signaling Technology | Cat# 9102S; RRID: AB_330744 |
| p-MEK | Cell Signaling Technology | Cat# 9121S; RRID: AB_331648 |
| MEK | Cell Signaling Technology | Cat# 4694S; RRID: AB_10695868 |
| p-cRAF (S259) | Cell Signaling Technology | Cat# 9421; RRID: AB_330759 |
| cRAF | Cell Signaling Technology | Cat# 9422; RRID: AB_390808 |
| p-AKT | Cell Signaling Technology | Cat #4060S; RRID: AB_2315049 |
| AKT | Cell Signaling Technology | Cat# 2920; RRID: AB_1147620 |
| p-MET | Cell Signaling Technology | Cat# 3077S; RRID: AB_2143884 |
| MET | Cell Signaling Technology | Cat#3148S; RRID: AB_1031042 |
| ACTIN | Santa Cruz | Cat# SC47778; RRID: AB_2714189 |
| Bacterial and Virus Strains | ||
| non-targeting shRNA control SMARTvector Inducible shRNA Lentivirus | Dharmacon | VSC11657 |
| non-targeting shRNA control SMARTvector Inducible shRNA Lentivirus | Dharmacon | VSC11501 |
| cRAF shRNA-1 SMARTvector Inducible shRNA Lentivirus | Dharmacon | V3SH11252–225355921 |
| cRAF shRNA-2 SMARTvector Inducible shRNA Lentivirus | Dharmacon | V3SH11252–224887321 |
| SHOC2 shRNA-1 SMARTvector Inducible shRNA Lentivirus | Dharmacon | V3SH11252–228554809 |
| SHOC2 shRNA-2 SMARTvector Inducible shRNA Lentivirus | Dharmacon | V3SH11252–226496368 |
| Chemicals, Peptides, and Recombinant Proteins | ||
| trametinib (GSK1120212) | Selleckchem | S2673 |
| Selumetinib (AZD6244) | Selleckchem | S1008 |
| PLX7904 | Selleckchem | S7964 |
| GDC-0994 | Selleckchem | S7554 |
| CH5126766 | Selleckchem | S7170 |
| Gemcitabine | Selleckchem | S1714 |
| SCH772984 | Selleckchem | S7101 |
| LY3009120 | Selleckchem | S7842 |
| Vemurafinib | Selleckchem | S1267 |
| Ulixertinib (BVD-523) | Selleckchem | S7854 |
| Ravoxertinib (GDC-0994) | Selleckchem | S7554 |
| ARS-1620 | Selleckchem | S8707 |
| Doxycycline | Sigma-Aldrich | D3072 |
| dTAG13 | Erb et al., 2017 | N/A |
| rhHGF | PeproTech | 100–39H |
| Critical Commercial Assays | ||
| Blood and Cell Culture DNA Maxi Kit | QIAGEN | 13362 |
| Cell-Titer-Glo (CTG) | Promega | G7570 |
| Cell-Titer-Glo 3D | Promega | G9681 |
| Human Phospho-Receptor Tyrosine Kinase Array Kit | R&D Systems | ARY001B |
| Deposited Data | ||
| Raw data | This paper | https://figshare.com/articles/2019_Synthetic_lethal_interaction_of_SHOC2_depletion_with_MEK_inhibition_in_RAS_driven_cancers/9544061/1 |
| Experimental Models: Cell Lines | ||
| CFPAC-1 | ATCC | CRL-1918 |
| A549 | ATCC | CCL-185 |
| NCI-H23 | ATCC | CRL-5800 |
| PA-TU-8902 | DSMZ | ACC 179 |
| KP4 | Riken Bioresource | RCB1005 |
| MIA PaCa-2 | ATCC | CRM-CRL-1420 |
| NCI-H2009 | ATCC | CRL-5911 |
| NCI-H2030 | ATCC | CRL-5914 |
| Panc 10.05 | ATCC | CRL-2547 |
| SU.86.86 | ATCC | CRL-1837 |
| NCI-H1975 | ATCC | CRL-5908 |
| HCC364 | Adi Gazdar lab | N/A |
| NCI-H1299 | ATCC | CRL-5803 |
| MDA-MB-157 | ATCC | HTB-24 |
| MDA-MB-436 | ATCC | HTB-130 |
| HCT116 | ATCC | CCL-247 |
| LOVO | ATCC | CCL-229 |
| Experimental Models: Organisms/Strains | ||
| SCID Hairless Outbred (SHO) mice | Charles River Laboratories | 474 |
| Oligonucleotides | ||
| siRNA Neg Ctrl ON-TARGETplus Non-targeting Pool: UGGUUUACAUG UCGACUAA, UGGUUUACAUGU UGUGUGA, UGGUUUACAUGUUU UCUGA, UGGUUUACAUGUUUUCCUA | Dharmacon | D-001810-10-05 |
| siSHOC2 ON-TARGETplus Human: GAAGAGAAUUCAAUGCGUU, CGUCUUGGUCUGAGAUAUA, UCGUAUAACUACUGUGGAA, GAGGUAGUAUAGUUAGAUA | Dharmacon | L-019524-01-0005 |
| SHOC2 sgRNA 1: TAGTTATACGATTAAAGCGA | This paper | N/A |
| SHOC2 sgRNA 2: GAGCTACATCCAGCGTAATG | This paper | N/A |
| MAPK1 sgRNA 1: CAACCTCTCGTACATCGGCG | This paper | N/A |
| MAPK1 sgRNA 2:ATCCAGACCATGATCACACA | This paper | N/A |
| Intergenic sgRNA: GAATGGAATTGCTATCACAG | This paper | N/A |
| Table S4 | This paper | N/A |
| Recombinant DNA | ||
| Avana CRISPR Lentivirus Library | Broad Institute | N/A |
| pXPR_011 | Addgene | 59702 |
| pLX311-Cas9 | Addgene | 118018 |
| pLX311-SHOC2-V5 | This paper | N/A |
| pLEX305_FKBP12F36V-SHOC2 | This paper | N/A |
| Software and Algorithms | ||
| STARS v1.3 | Doench et al., 2014 | https://www.broadinstitute.org/rnai/public/software/index |
| ImageJ | Schneider et al., 2012 | https://imagej.nih.gov/ij// |
| GraphPad Prism 8 | GraphPad Software | https://www.graphpad.com/scientific-software/prism/ |
Highlights.
RTK-RAS-MAPK pathway members score strongly in genome-scale MEKi modifier screens
Depletion of SHOC2 potently sensitizes RAS-driven cells to MEK inhibition
SHOC2 loss impairs RTK-mediated adaptive reactivation of MAPK signaling induced by MEKi
A model of SHOC2 degradation suggests a combination therapeutic strategy with MEKi
ACKNOWLEDGMENTS
This work was supported in part by funds from Calico Life Sciences (A.J.A., K.H.W., R.S., A.J.F., J.S., and W.C.H.); the NIH-National Cancer Institute (NCI) F32CA243290 (J.J.K.); the Fondation pour la Recherche Médicale SPE2018035027 (E.P.); the Lustgarten Foundation (A.J.A.); the Dana-Farber Cancer Institute Hale Center for Pancreatic Cancer Research (N.S.G., A.J.A., and W.C.H.); NIH-NCI K00CA212221 (J.R.); the Hope Funds for Cancer Research (A.J.A and S.R.); the Doris Duke Charitable Foundation (A.J.A.); the Pancreatic Cancer Action Network (A.J.A.); American Cancer Society Postdoctoral Fellowship PF-17-010-01-CDD (B.N.); a Conquer Cancer Foundation of ASCO Young Investigator Award (A.J.A. and S.R.); NIH-NCI K08 CA218420-02 (A.J.A.), P50CA127003 (A.J.A. and W.C.H.), U01 CA224146 (W.C.H. and A.J.A.), and U01 CA199253 (W.C.H.); and the Harvard Clinical and Translational Science Center UL1 TR001102 (A.J.A. and S.R.).
DECLARATION OF INTERESTS
A.J.F. and J.S. are full-time employees of Calico Life Sciences. J.S. is a scientific advisor to Foghorn Therapeutics. N.S.G. is a scientific founder and member of the Scientific Advisory Board (SAB) and equity holder in Gatekeeper, Syros, Petra, C4, B2S, and Soltego. N.S.G. has received research funding from Novartis, Takeda, Astellas, Taiho, Janssen, Kinogen, Voronoi, Her2llc, Deerfield, and Sanofi. W.C.H. is a consultant for Thermo Fisher, AjuIB, Parexel, Frontier Biomedicines, and MPM Capital. W.C.H. is a founder and advisor to KSQ Therapeutics. A.J.A. has consulted for Oncorus, Inc., Arrakis Therapeutics, and Merck & Co., Inc., and has research funding from Mirati Therapeutics.
Footnotes
SUPPLEMENTAL INFORMATION
Supplemental Information can be found online at https://doi.org/10.1016/j.celrep.2019.08.090.
REFERENCES
- Aguirre AJ, and Hahn WC (2018). Synthetic Lethal Vulnerabilities in KRAS-Mutant Cancers. Cold Spring Harb. Perspect. Med 8, a031518. [DOI] [PMC free article] [PubMed] [Google Scholar]
- Ahmed TA, Adamopoulos C, Karoulia Z, Wu X, Sachidanandam R, Aaronson SA, and Poulikakos PI (2019). SHP2 Drives Adaptive Resistance to ERK Signaling Inhibition in Molecularly Defined Subsets of ERK-Dependent Tumors. Cell Rep. 26, 65–78.e5. [DOI] [PMC free article] [PubMed] [Google Scholar]
- Anderson GR, Winter PS, Lin KH, Nussbaum DP, Cakir M, Stein EM, Soderquist RS, Crawford L, Leeds JC, Newcomb R, et al. (2017). A Landscape of Therapeutic Cooperativity in KRAS Mutant Cancers Reveals Principles for Controlling Tumor Evolution. Cell Rep. 20, 999–1015. [DOI] [PMC free article] [PubMed] [Google Scholar]
- Bader GD, and Hogue CW (2003). An automated method forfinding molecular complexes in large protein interaction networks. BMC Bioinformatics 4,2. [DOI] [PMC free article] [PubMed] [Google Scholar]
- Blumenschein GR Jr., Smit EF, Planchard D, Kim DW, Cadranel J, De Pas T, Dunphy F, Udud K, Ahn MJ, Hanna NH, et al. (2015). A randomized phase II study of the MEK1/MEK2 inhibitor trametinib (GSK1120212) compared with docetaxel in KRAS-mutant advanced non-small-cell lung cancer (NSCLC). Ann. Oncol 26, 894–901. [DOI] [PMC free article] [PubMed] [Google Scholar]
- Boned Del Río I, Young LC, Sari S, Jones GG, Ringham-Terry B, Hartig N, Rejnowicz E, Lei W, Bhamra A, Surinova S, and Rodriguez-Viciana P (2019). SHOC2 complex-driven RAF dimerization selectively contributes to ERK pathway dynamics. Proc. Natl. Acad. Sci. USA 116, 13330–13339. [DOI] [PMC free article] [PubMed] [Google Scholar]
- Chapman PB, Solit DB, and Rosen N (2014). Combination of RAF and MEK inhibition for the treatment of BRAF-mutated melanoma: feedback is not encouraged. Cancer Cell 26, 603–604. [DOI] [PubMed] [Google Scholar]
- Corcoran RB, Ebi H, Turke AB, Coffee EM, Nishino M, Cogdill AP, Brown RD, Della Pelle P, Dias-Santagata D, Hung KE, et al. (2012). EGFR-mediated re-activation of MAPK signaling contributes to insensitivity of BRAF mutant colorectal cancers to RAF inhibition with vemurafenib. Cancer Discov. 2, 227–235. [DOI] [PMC free article] [PubMed] [Google Scholar]
- Corcoran RB, Cheng KA, Hata AN, Faber AC, Ebi H, Coffee EM, Greninger P, Brown RD, Godfrey JT, Cohoon TJ, et al. (2013). Synthetic lethal interaction of combined BCL-XL and MEK inhibition promotes tumor regressions in KRAS mutant cancer models. Cancer Cell 23, 121–128. [DOI] [PMC free article] [PubMed] [Google Scholar]
- Cordeddu V, Di Schiavi E, Pennacchio LA, Ma’ayan A, Sarkozy A, Fodale V, Cecchetti S, Cardinale A, Martin J, Schackwitz W, et al. (2009). Mutation of SHOC2 promotes aberrant protein N-myristoylation and causes Noonan-like syndrome with loose anagen hair. Nat. Genet 41, 1022–1026. [DOI] [PMC free article] [PubMed] [Google Scholar]
- Das Thakur M, Salangsang F, Landman AS, Sellers WR, Pryer NK, Levesque MP, Dummer R, McMahon M, and Stuart DD (2013). Modelling vemurafenib resistance in melanoma reveals a strategy to forestall drug resistance. Nature 494, 251–255. [DOI] [PMC free article] [PubMed] [Google Scholar]
- Doench JG, Hartenian E, Graham DB, Tothova Z, Hegde M, Smith I, Sullender M, Ebert BL, Xavier RJ, and Root DE (2014). Rational design of highly active sgRNAs for CRISPR-Cas9-mediated gene inactivation. Nat. Biotechnol 32, 1262–1267. [DOI] [PMC free article] [PubMed] [Google Scholar]
- Doench JG, Fusi N, Sullender M, Hegde M, Vaimberg EW, Donovan KF, Smith I, Tothova Z, Wilen C, Orchard R, et al. (2016). Optimized sgRNA design to maximize activity and minimize off-target effects of CRISPR-Cas9. Nat. Biotechnol 34, 184–191. [DOI] [PMC free article] [PubMed] [Google Scholar]
- Dompe N, Klijn C, Watson SA, Leng K, Port J, Cuellar T, Watanabe C, Haley B, Neve R, Evangelista M, and Stokoe D (2018). ACRISPR screen identifies MAPK7 as a target for combination with MEK inhibition in KRAS mutant NSCLC. PLoS ONE 13, e0199264. [DOI] [PMC free article] [PubMed] [Google Scholar]
- Duncan JS, Whittle MC, Nakamura K, Abell AN, Midland AA, Zawistowski JS, Johnson NL, Granger DA, Jordan NV, Darr DB, et al. (2012). Dynamic reprogramming of the kinome in response to targeted MEK inhibition in triple-negative breast cancer. Cell 149, 307–321. [DOI] [PMC free article] [PubMed] [Google Scholar]
- Erb MA, Scott TG, Li BE, Xie H, Paulk J, Seo HS, Souza A, Roberts JM, Dastjerdi S, Buckley DL, et al. (2017). Transcription control by the ENL YEATS domain in acute leukemia. Nature 543, 270–274. [DOI] [PMC free article] [PubMed] [Google Scholar]
- Fedele C, Ran H, Diskin B, Wei W, Jen J, Geer MJ, Araki K, Ozerdem U, Simeone DM, Miller G, et al. (2018). SHP2 Inhibition Prevents Adaptive Resistance to MEK Inhibitors in Multiple Cancer Models. Cancer Discov. 8, 1237–1249. [DOI] [PMC free article] [PubMed] [Google Scholar]
- Gilmartin AG, Bleam MR, Groy A, Moss KG, Minthorn EA, Kulkarni SG, Rominger CM, Erskine S, Fisher KE, Yang J, et al. (2011). GSK1120212 (JTP-74057) is an inhibitor of MEK activity and activation with favorable pharmacokinetic properties for sustained in vivo pathway inhibition. Clin. Cancer Res 17, 989–1000. [DOI] [PubMed] [Google Scholar]
- Gripp KW, Aldinger KA, Bennett JT, Baker L, Tusi J, Powell-Hamilton N, Stabley D, Sol-Church K, Timms AE, and Dobyns WB (2016). A novel rasopathy caused by recurrent de novo missense mutations in PPP1CB closely resembles Noonan syndrome with loose anagen hair. Am. J. Med. Genet. A 170, 2237–2247. [DOI] [PMC free article] [PubMed] [Google Scholar]
- Hatzivassiliou G, Song K, Yen I, Brandhuber BJ, Anderson DJ, Alvarado R, Ludlam MJ, Stokoe D, Gloor SL, Vigers G, et al. (2010). RAF inhibitors prime wild-type RAF to activate the MAPK pathway and enhance growth. Nature 464, 431–435. [DOI] [PubMed] [Google Scholar]
- Heidorn SJ, Milagre C, Whittaker S, Nourry A, Niculescu-Duvas I, Dhomen N, Hussain J, Reis-Filho JS, Springer CJ, Pritchard C, and Marais R (2010). Kinase-dead BRAF and oncogenic RAS cooperate to drive tumor progression through CRAF. Cell 140, 209–221. [DOI] [PMC free article] [PubMed] [Google Scholar]
- Higgins EM, Bos JM, Mason-Suares H, Tester DJ, Ackerman JP, MacRae CA, Sol-Church K, Gripp KW, Urrutia R, and Ackerman MJ (2017). Elucidation of MRAS-mediated Noonan syndrome with cardiac hypertrophy. JCI Insight 2, e91225. [DOI] [PMC free article] [PubMed] [Google Scholar]
- Infante JR, Fecher LA, Falchook GS, Nallapareddy S, Gordon MS, Becerra C, DeMarini DJ, Cox DS, Xu Y, Morris SR, et al. (2012). Safety, pharmacokinetic, pharmacodynamic, and efficacy data for the oral MEK inhibitor trametinib: a phase 1 dose-escalation trial. Lancet Oncol. 13, 773–781. [DOI] [PubMed] [Google Scholar]
- Ishii N, Harada N, Joseph EW, Ohara K, Miura T, Sakamoto H, Matsuda Y, Tomii Y, Tachibana-Kondo Y, Iikura H, et al. (2013). Enhanced inhibition of ERK signaling by a novel allosteric MEK inhibitor, CH5126766, that suppresses feedback reactivation of RAF activity. Cancer Res. 73,4050–4060. [DOI] [PMC free article] [PubMed] [Google Scholar]
- Janes MR, Zhang J, Li LS, Hansen R, Peters U, Guo X, Chen Y, Babbar A, Firdaus SJ, Darjania L, et al. (2018). Targeting KRAS Mutant Cancers with a Covalent G12C-Specific Inhibitor. Cell 172, 578–589.e17. [DOI] [PubMed] [Google Scholar]
- Jänne PA, Shaw AT, Pereira JR, Jeannin G, Vansteenkiste J, Barrios C, Franke FA, Grinsted L, Zazulina V, Smith P, et al. (2013). Selumetinib plus docetaxel for KRAS-mutant advanced non-small-cell lung cancer: a randomised, multicentre, placebo-controlled, phase 2 study. Lancet Oncol. 14, 38–47. [DOI] [PubMed] [Google Scholar]
- Jin T, Lavoie H, Sahmi M, David M, Hilt C, Hammell A, and Therrien M (2017). RAF inhibitors promote RAS-RAF interaction by allosterically disrupting RAF autoinhibition. Nat. Commun 8, 1211. [DOI] [PMC free article] [PubMed] [Google Scholar]
- Johannessen CM, Boehm JS, Kim SY, Thomas SR, Wardwell L, Johnson LA, Emery CM, Stransky N, Cogdill AP, Barretina J, et al. (2010). COT drives resistance to RAF inhibition through MAP kinase pathway reactivation. Nature 468, 968–972. [DOI] [PMC free article] [PubMed] [Google Scholar]
- Jones GG, Del Río IB, Sari S, Sekerim A, Young LC, Hartig N, Areso Zubiaur I, El-Bahrawy MA, Hynds RE, Lei W, et al. (2019). SHOC2 phosphatase-dependent RAF dimerization mediates resistance to MEK inhibition in RAS-mutant cancers. Nat. Commun 10, 2532. [DOI] [PMC free article] [PubMed] [Google Scholar]
- Kimmelman AC, Nuñez Rodriguez N, and Chan AM (2002). R-Ras3/M-Ras induces neuronal differentiation of PC12 cells through cell-type-specific activation of the mitogen-activated protein kinase cascade. Mol. Cell. Biol 22, 5946–5961. [DOI] [PMC free article] [PubMed] [Google Scholar]
- Kitai H, Ebi H, Tomida S, Floros KV, Kotani H, Adachi Y, Oizumi S, Nishimura M, Faber AC, and Yano S (2016). Epithelial-to-Mesenchymal Transition Defines Feedback Activation of Receptor Tyrosine Kinase Signaling Induced by MEK Inhibition in KRAS-Mutant Lung Cancer. Cancer Discov. 6, 754–769. [DOI] [PMC free article] [PubMed] [Google Scholar]
- Krall EB, Wang B, Munoz DM, Ilic N, Raghavan S, Niederst MJ, Yu K, Ruddy DA, Aguirre AJ, Kim JW, et al. (2017). KEAP1 loss modulates sensitivity to kinase targeted therapy in lung cancer. eLife 6, e18970. [DOI] [PMC free article] [PubMed] [Google Scholar]
- Lee HJ, Zhuang G, Cao Y, Du P, Kim HJ, and Settleman J (2014). Drug resistance via feedback activation of Stat3 in oncogene-addicted cancer cells. Cancer Cell 26, 207–221. [DOI] [PubMed] [Google Scholar]
- Li W, Han M, and Guan KL (2000). The leucine-rich repeat protein SUR-8 enhances MAP kinase activation and forms a complex with Ras and Raf. Genes Dev. 14, 895–900. [PMC free article] [PubMed] [Google Scholar]
- Lin L, Sabnis AJ, Chan E, Olivas V, Cade L, Pazarentzos E, Asthana S, Neel D, Yan JJ, Lu X, et al. (2015). The Hippo effector YAP promotes resistance to RAF- and MEK-targeted cancer therapies. Nat. Genet 47, 250–256. [DOI] [PMC free article] [PubMed] [Google Scholar]
- Lito P, Saborowski A, Yue J, Solomon M, Joseph E, Gadal S, Saborowski M, Kastenhuber E, Fellmann C, Ohara K, et al. (2014). Disruption of CRAF-mediated MEK activation is required for effective MEK inhibition in KRAS mutant tumors. Cancer Cell 25, 697–710. [DOI] [PMC free article] [PubMed] [Google Scholar]
- Lu G, Middleton RE, Sun H, Naniong M, Ott CJ, Mitsiades CS, Wong KK, Bradner JE, and Kaelin WG Jr. (2014). The myeloma drug lenalidomide promotes the cereblon-dependent destruction of Ikaros proteins. Science 343,305–309. [DOI] [PMC free article] [PubMed] [Google Scholar]
- Mainardi S, Mulero-Sánchez A, Prahallad A, Germano G, Bosma A, Krimpenfort P, Lieftink C, Steinberg JD, de Wit N, Gonçalves-Ribeiro S, et al. (2018). SHP2 is required for growth of KRAS-mutant non-small-cell lung cancer in vivo. Nat. Med 24, 961–967. [DOI] [PubMed] [Google Scholar]
- Manchado E, Weissmueller S, Morris JP 4th, Chen CC, Wullenkord R, Lujambio A, de Stanchina E, Poirier JT, Gainor JF, Corcoran RB, et al. (2016). A combinatorial strategy for treating KRAS-mutant lung cancer. Nature 534,647–651. [DOI] [PMC free article] [PubMed] [Google Scholar]
- Nabet B, Roberts JM, Buckley DL, Paulk J, Dastjerdi S, Yang A, Leggett AL, Erb MA, Lawlor MA, Souza A, et al. (2018). The dTAG system for immediate and target-specific protein degradation. Nat. Chem. Biol 14, 431–441. [DOI] [PMC free article] [PubMed] [Google Scholar]
- Nazarian R, Shi H, Wang Q, Kong X, Koya RC, Lee H, Chen Z, Lee MK, Attar N, Sazegar H, et al. (2010). Melanomas acquire resistance to B-RAF(V600E) inhibition by RTK or N-RAS upregulation. Nature 468,973–977. [DOI] [PMC free article] [PubMed] [Google Scholar]
- Nichols RJ, Haderk F, Stahlhut C, Schulze CJ, Hemmati G, Wildes D, Tzitzilonis C, Mordec K, Marquez A, Romero J, et al. (2018). RAS nucleotide cycling underlies the SHP2 phosphatase dependence of mutant BRAF-,NF1- and RAS-driven cancers. Nat. Cell Biol. 20, 1064–1073. [DOI] [PMC free article] [PubMed] [Google Scholar]
- Nikolaev SI, Rimoldi D, Iseli C, Valsesia A, Robyr D, Gehrig C, Harshman K, Guipponi M, Bukach O, Zoete V, et al. (2011). Exome sequencing identifies recurrent somatic MAP2K1 and MAP2K2 mutations in melanoma. Nat. Genet 44, 133–139. [DOI] [PubMed] [Google Scholar]
- Olson CM, Jiang B, Erb MA, Liang Y, Doctor ZM, Zhang Z, Zhang T, Kwiatkowski N, Boukhali M, Green JL, et al. (2018). Pharmacological perturbation of CDK9 using selective CDK9 inhibition or degradation. Nat. Chem. Biol 14, 163–170. [DOI] [PMC free article] [PubMed] [Google Scholar]
- Papke B, and Der CJ (2017). Drugging RAS: Know the enemy. Science 355, 1158–1163. [DOI] [PubMed] [Google Scholar]
- Peng SB, Henry JR, Kaufman MD, Lu WP, Smith BD, Vogeti S, Rutkoski TJ, Wise S, Chun L, Zhang Y, et al. (2015). Inhibition of RAF Isoforms and Active Dimers by LY3009120 Leads to Anti-tumor Activities in RAS or BRAF Mutant Cancers. Cancer Cell 28, 384–398. [DOI] [PubMed] [Google Scholar]
- Piccioni F, Younger ST, and Root DE (2018). Pooled Lentiviral-Delivery Genetic Screens. Curr. Protoc. Mol. Biol 121,32.1.1–32.1.21. [DOI] [PubMed] [Google Scholar]
- Poulikakos PI, Persaud Y, Janakiraman M, Kong X, Ng C, Moriceau G, Shi H, Atefi M, Titz B, Gabay MT, et al. (2011). RAF inhibitor resistance is mediated by dimerization of aberrantly spliced BRAF(V600E). Nature 480, 387–390. [DOI] [PMC free article] [PubMed] [Google Scholar]
- Prahallad A, Heynen GJ, Germano G, Willems SM, Evers B, Vecchione L, Gambino V, Lieftink C, Beijersbergen RL, Di Nicolantonio F, et al. (2015). PTPN11 Is a Central Node in Intrinsic and Acquired Resistance to Targeted Cancer Drugs. Cell Rep. 12, 1978–1985. [DOI] [PubMed] [Google Scholar]
- Rodriguez-Viciana P, Oses-Prieto J, Burlingame A, Fried M, and McCormick F (2006). A phosphatase holoenzyme comprised of Shoc2/Sur8 and the catalytic subunit of PP1 functions as an M-Ras effector to modulate Raf activity. Mol. Cell 22,217–230. [DOI] [PubMed] [Google Scholar]
- Rotem A, Janzer A, Izar B, Ji Z, Doench JG, Garraway LA, and Struhl K (2015). Alternative to the soft-agar assay that permits high-throughput drug and genetic screens for cellular transformation. Proc. Natl. Acad. Sci. USA 112,5708–5713. [DOI] [PMC free article] [PubMed] [Google Scholar]
- Ruess DA, Heynen GJ, Ciecielski KJ, Ai J, Berninger A, Kabacaoglu D, Görgülü K, Dantes Z, Wörmann SM, Diakopoulos KN, et al. (2018). Mutant KRAS-driven cancers depend on PTPN11/SHP2 phosphatase. Nat. Med 24, 954–960. [DOI] [PubMed] [Google Scholar]
- Samatar AA, and Poulikakos PI (2014). Targeting RAS-ERK signalling in cancer: promises and challenges. Nat. Rev. Drug Discov 13, 928–942. [DOI] [PubMed] [Google Scholar]
- Schindelin J, Arganda-Carreras I, Frise E, Kaynig V, Longair M, Pietzsch T, Preibisch S, Rueden C, Saalfeld S, Schmid B, et al. (2012). Fiji: an open-source platform for biological-image analysis. Nat. Methods 9,676–682. [DOI] [PMC free article] [PubMed] [Google Scholar]
- Schneider CA, Rasband WS, and Eliceiri KW (2012). NIH Image to ImageJ: 25 years of image analysis. Nat. Methods 9, 671–675. [DOI] [PMC free article] [PubMed] [Google Scholar]
- Simanshu DK, Nissley DV, and McCormick F (2017). RAS Proteins and Their Regulators in Human Disease. Cell 170, 17–33. [DOI] [PMC free article] [PubMed] [Google Scholar]
- Stephen AG, Esposito D, Bagni RK, and McCormick F (2014). Dragging ras back in the ring. Cancer Cell 25, 272–281. [DOI] [PubMed] [Google Scholar]
- Sun C, Hobor S, Bertotti A, Zecchin D, Huang S, Galimi F, Cottino F, Prahallad A, Grernrum W, Tzani A, et al. (2014). Intrinsic resistance to MEK inhibition in KRAS mutant lung and colon cancer through transcriptional induction of ERBB3. Cell Rep. 7, 86–93. [DOI] [PubMed] [Google Scholar]
- Tripathi S, Pohl MO, Zhou Y, Rodriguez-Frandsen A, Wang G, Stein DA, Moulton HM, DeJesus P, Che J, Mulder LC, et al. (2015). Meta- and Orthogonal Integration of Influenza “OMICs” Data Defines a Role for UBR4 in Virus Budding. Cell Host Microbe 18, 723–735. [DOI] [PMC free article] [PubMed] [Google Scholar]
- Villanueva J, Vultur A, Lee JT, Somasundaram R, Fukunaga-Kalabis M, Cipolla AK, Wubbenhorst B, Xu X, Gimotty PA, Kee D, et al. (2010). Acquired resistance to BRAF inhibitors mediated by a RAF kinase switch in melanoma can be overcome by cotargeting MEK and IGF-1R/PI3K. Cancer Cell 18, 683–695. [DOI] [PMC free article] [PubMed] [Google Scholar]
- Wagle N, Emery C, Berger MF, Davis MJ, Sawyer A, Pochanard P, Kehoe SM, Johannessen CM, Macconaill LE, Hahn WC, et al. (2011). Dissecting therapeutic resistance to RAF inhibition in melanoma by tumor genomic profiling. J. Clin. Oncol 29, 3085–3096. [DOI] [PMC free article] [PubMed] [Google Scholar]
- Wang B, Krall EB, Aguirre AJ, Kim M, Widlund HR, Doshi MB, Sicinska E, Sulahian R, Goodale A, Cowley GS, et al. (2017a). ATXN1L, CIC, and ETS Transcription Factors Modulate Sensitivity to MAPK Pathway Inhibition. Cell Rep. 18, 1543–1557. [DOI] [PMC free article] [PubMed] [Google Scholar]
- Wang T, Yu H, Hughes NW, Liu B, Kendirli A, Klein K, Chen WW, Lander ES, and Sabatini DM (2017b). Gene Essentiality Profiling Reveals Gene Networks and Synthetic Lethal Interactions with Oncogenic Ras. Cell 168, 890–903.e15. [DOI] [PMC free article] [PubMed] [Google Scholar]
- Whittaker SR, Theurillat JP, Van Allen E, Wagle N, Hsiao J, Cowley GS, Schadendorf D, Root DE, and Garraway LA (2013). Agenome-scale RNA interference screen implicates NF1 loss in resistance to RAF inhibition. Cancer Discov. 3, 350–362. [DOI] [PMC free article] [PubMed] [Google Scholar]
- Winter GE, Buckley DL,Paulk J,Roberts JM, Souza A, Dhe-Paganon S, and Bradner JE (2015). DRUG DEVELOPMENT. Phthalimide conjugation as a strategy for in vivo target protein degradation. Science 348, 1376–1381. [DOI] [PMC free article] [PubMed] [Google Scholar]
- Young LC, and Rodriguez-Viciana P (2018). MRAS: A Close but Understudied Member of the RAS Family. Cold Spring Harb. Perspect. Med 8, a033621. [DOI] [PMC free article] [PubMed] [Google Scholar]
- Young LC, Hartig N, Muñoz-Alegre M, Oses-Prieto JA, Durdu S, Bender S, Vijayakumar V, Vietri Rudan M, Gewinner C, Henderson S, et al. (2013). An MRAS, SHOC2, and SCRIB complex coordinates ERK pathway activation with polarity and tumorigenic growth. Mol. Cell 52, 679–692. [DOI] [PubMed] [Google Scholar]
- Zhang C, Spevak W,Zhang Y, Burton EA, Ma Y, Habets G, Zhang J, Lin J, Ewing T, Matusow B, et al. (2015). RAF inhibitors that evade paradoxical MAPK pathway activation. Nature 526, 583–586. [DOI] [PubMed] [Google Scholar]
Associated Data
This section collects any data citations, data availability statements, or supplementary materials included in this article.
Supplementary Materials
Data Availability Statement
The datasets generated during this study are available at Figshare [https://doi.org/10.6084/m9.figshare.9544061.v1].