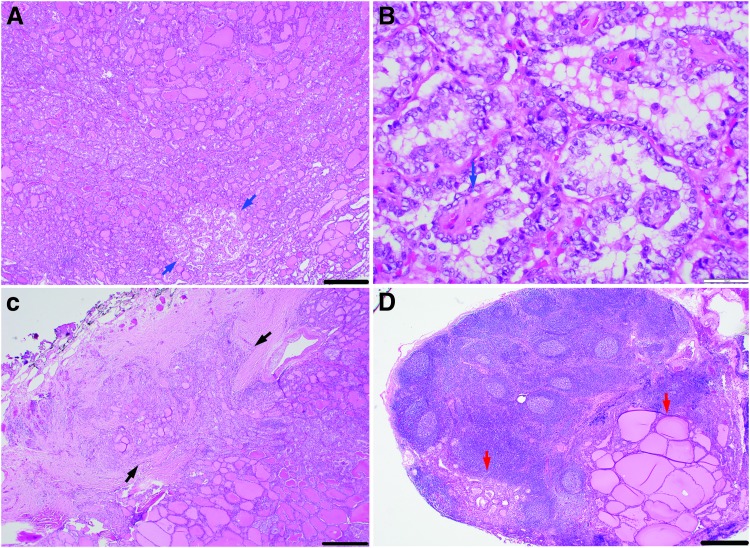
FIG. 3.
Microscopic pictures of a patient with a 2-cm encapsulated PTC harboring 5% papillae with capsular invasion and nodal metastases. (A) Low-power view of primary tumor with area of papillae formation (blue arrows). (B) High-power view of papillary area in A showing papillae with fibrovascular cores (blue arrow). (C) Primary tumor displaying mushrooming capsular invasion (black arrows). (D) Lymph node with metastatic deposits (red arrows). Scale bar: 500 μm in (A, C, and D), 50 μm in (B).

