Figure 1.

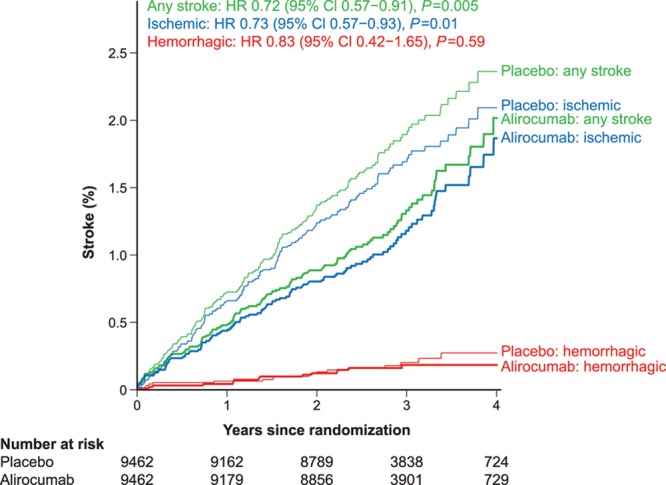
Kaplan-Meier curves for any stroke, ischemic stroke and hemorrhagic stroke. CI indicates confidence interval; and HR, hazard ratio.

Kaplan-Meier curves for any stroke, ischemic stroke and hemorrhagic stroke. CI indicates confidence interval; and HR, hazard ratio.