Abstract
Most pancreatic neuroendocrine tumors (PNETs) do not produce excess hormones and are therefore considered ‘non-functional’1–3. As clinical behaviors vary widely and distant metastases are eventually lethal2,4, biological classifications might guide treatment. Using enhancer maps to infer gene regulatory programs, we find that non-functional PNETs fall into two major sub-types whose epigenomes and transcriptomes partially resemble islet alpha and beta cells. Transcription factors ARX and PDX1 specify these normal cells, respectively5,6, and 84% of 142 non-functional PNETs expressed one or the other factor, occasionally both. Among 103 cases, distant relapses occurred almost exclusively in patients with ARX+PDX1− tumors and, within this sub-type, in cases with alternative lengthening of telomeres (ALT). These markedly different outcomes belied similar clinical presentations and histology and, in one cohort, occurred irrespective of MEN1 mutation. This robust molecular stratification provides insight into cell lineage correlates of non-functional PNETs, accurately predicts disease course, and can inform post-operative clinical decisions.
Keywords: neuroendocrine tumors, cancer enhancer landscapes, PNET prognosis, cancer sub-classification, pancreatic endocrine ontogeny
Surgery is recommended for solitary PNETs larger than 2 cm and World Health Organization (WHO) grade is the best current tool to predict metastasis7,8. Insulinomas resemble normal pancreatic beta cells and carry a good prognosis1,2, but the lineage of most non-functional PNETs is obscure and about half the cases progress to lethal metastasis months to years after surgery1,2,9. Although 70% of PNETs carry MEN1, ATRX or DAXX gene mutations, and 15% activate mTOR signaling10,11, no mutation or biological feature is sufficiently correlated with clinical outcomes to guide prognosis or therapy3,8. Alternative lengthening of telomeres (ALT) is associated with ATRX or DAXX loss and elevated risk of recurrence12–14 but is not a routine clinical test.
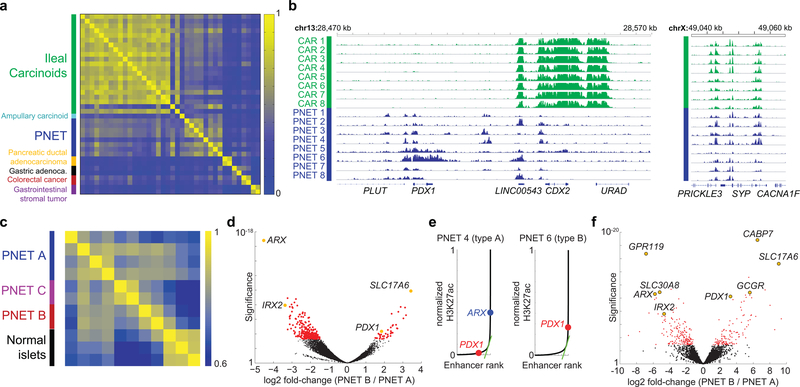
Cellular identities are encoded in chromatin states defined by the complement of active cis-elements, where nucleosomes bear H3K4me1/2, H3K27ac, and other covalent marks15,16. ‘Super’ or ‘stretch’ enhancers, which control lineage-specifying genes17,18, especially delineate cell-specific chromatin signatures19 and help nominate tumor cell origins20. ChIP-seq-derived profiles of H3K27ac-marked candidate enhancers in 8 frozen primary non-functional pancreatic and 22 intestinal NE (carcinoid) tumors (Supplementary Table 1) differed substantially from those of gastrointestinal carcinomas and less so from each other (Fig. 1a). Loci expressed in the two NET types, such as SYP, were similarly marked in both, while organ-restricted loci, such as CDX2, were marked selectively (Fig. 1b). Super-enhancer profiles, distinct from those of normal islets (Fig 1c), revealed three PNET sub-types. Considering A and B types as separate groups, 288 enhancers showed >2-fold higher H3K27ac in type A (FDR <0.05 – Supplementary Table 2), with sites in alpha cell-specific loci ARX and IRX2 showing especially large differences (Fig. 1d). Conversely, 104 regions showed significantly more H3K27ac in B-type tumors, including enhancers over genes such as PDX1 and SLC17A6, which are not expressed in alpha cells21,22.
Figure 1. Distinctive PNET enhancer profiles.
(a) Pairwise Pearson correlations of H3K27ac signals at distal regulatory elements in diverse GI cancers. PNET and carcinoid (small intestinal NE) tumors differ from others, reflecting distinct cell origins. Whereas intestinal NE enhancer landscapes are highly concordant, PNETs appear heterogeneous. (b) Representative H3K27ac ChIP-seq tracks (16 of 30 samples), showing differential acetylation at the CDX2 and PDX1 loci; intronic SYP enhancers are marked in both intestinal (green) and pancreatic (blue) NETs. ChIP-seq read counts were scaled by DESeq2 normalization based on promoter signals (see Methods). (c) Pearson correlations of super-enhancer H3K27ac signals in PNETs and normal pancreatic islets suggest possibly 3 disease subtypes. (d) Significance (log10 scale, Wald test) and log2 fold-differences in H3K27ac ChIP-seq signals in A- and B-type PNETs, calculated by DESeq2 comparison of 6 biologically independent tumors. Each dot represents an individual site (red: false discovery rate, FDR <0.05). Selected H3K27ac sites are colored yellow and annotated by the nearest gene. (e) Normalized H3K27ac signals across all sites (super-enhancers lie to the right of the inflection) in single representative type A and type B tumors from 6 samples. (f) Significance (log10, Wald test) and log2 fold-differences of normalized mRNA read counts in A- and B-type PNETs (n=8 biologically independent tumors) considered as two groups. Each dot represents an individual gene (red: FDR <0.05). Left and right: transcripts enriched in types A and B, respectively. Transcripts associated with selected super-enhancers, including those highlighted in panel d, are indicated (yellow).
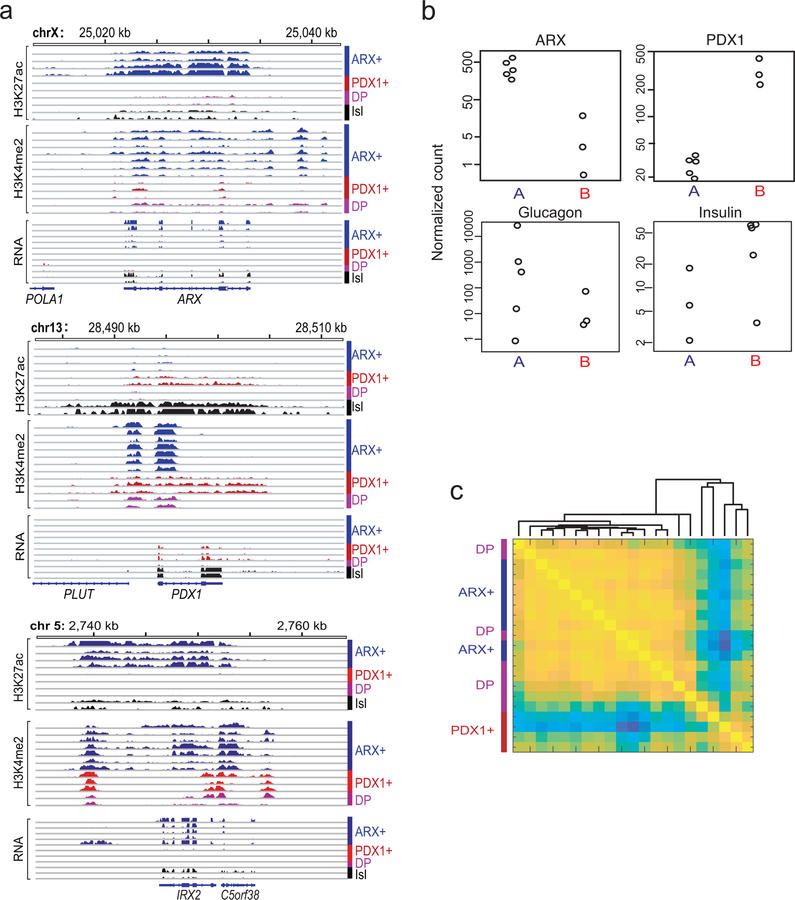
Across the 8 PNETs, A- and B-type tumors gave strong H3K27ac signals at ARX and IRX2 or at PDX1, respectively, whereas C-type tumors were variably marked at these loci and expressed low levels of ARX and PDX1 mRNAs (Extended Data Fig. 1a). In individual A- and B-type tumors, ARX and PDX1 met objective super-enhancer criteria19, respectively (Fig. 1e). At these and other loci, ChIP-seq for H3K4me2 (Ref. 23) on the original 8 and 4 additional PNETs (Supplementary Table 1) revealed similar patterns as H3K27ac (Extended Data Fig. 1a – H3K4me2 marks the PDX1 promoter in all PNETs, but only B-type tumors carry locus-wide H3K4me2). Aggregate (Fig. 1f) and individual (Extended Data Fig. 1b) comparisons of A- and B-type PNET transcriptomes (Supplementary Table 3) showed differential ARX and PDX1 expression.
Knowledge of pancreatic endocrine ontogeny derives largely from studies of mouse development24. NEUROG3 initiates the endocrine lineage and ARX specifies alpha-cell fate5, while PAX4 drives beta-cell differentiation25; absence of both factors favors the delta lineage26. ARX is necessary for alpha cell differentiation27, but other TFs (e.g., NKX2.2, PAX6, PDX1) sustain beta cells6,28–31. In embryos, early alpha-cell specification leads to Insulin and Glucagon co-expressing bipotential precursors, followed by beta-cell differentiation32; forced transdifferentiation between alpha and beta cells also occurs through intermediate Insulin+ Glucagon+ cells29. In this light, we compared A- and B-type PNET-restricted enhancers (Fig. 1d) with areas of chromatin selectively open in normal alpha or beta cells33. Type A regions were highly enriched for alpha cell-specific sites (62 shared, P <1.1*10−18), while type B-specific enhancers were enriched for beta cell-restricted sites (15 shared, P <1.7*10−5, Supplementary Table 4). Comparison with RNA profiles of fractionated normal human islets34 also revealed enrichment of alpha and beta cell-specific transcripts in A- (P <1.6*10−9) and B-type (P <6.2*10−16) PNETs, respectively. Differential TF expression distinguished PNETs better than Glucagon and Insulin mRNA levels, which were generally low and similar in the two sub-types (Extended Data Fig. 1b).
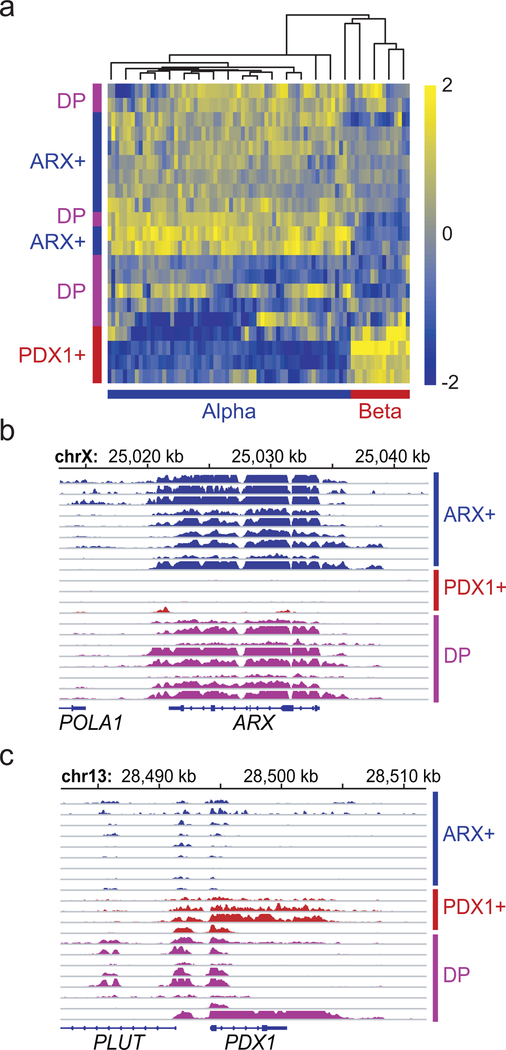
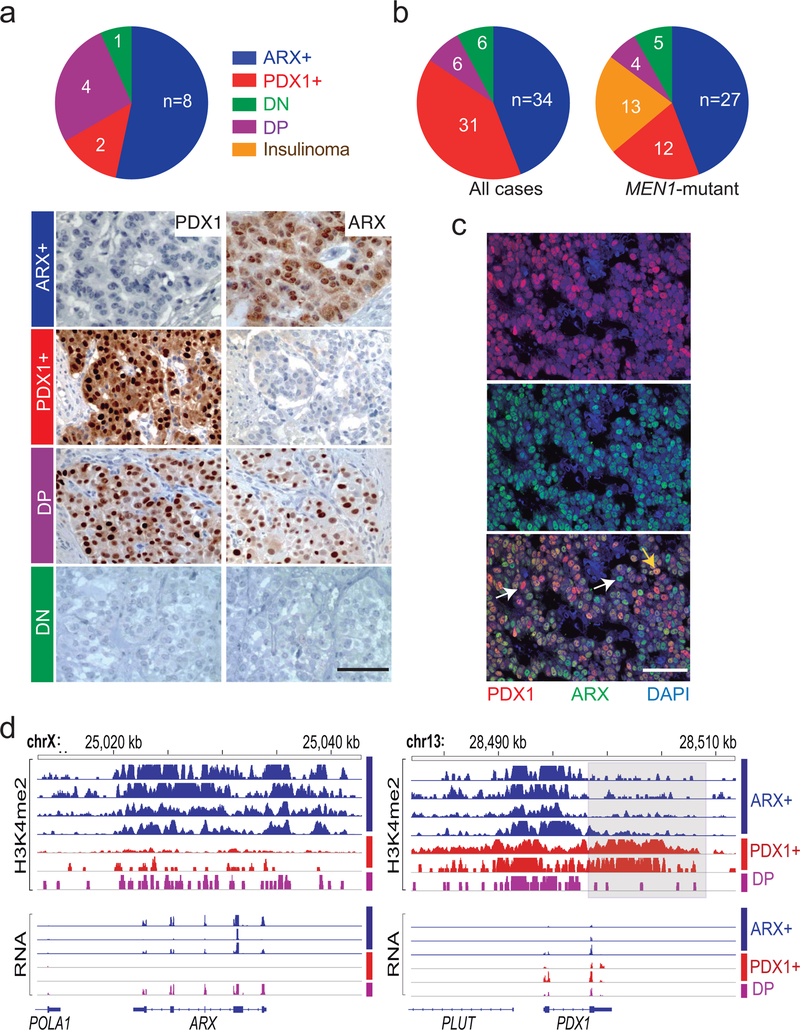
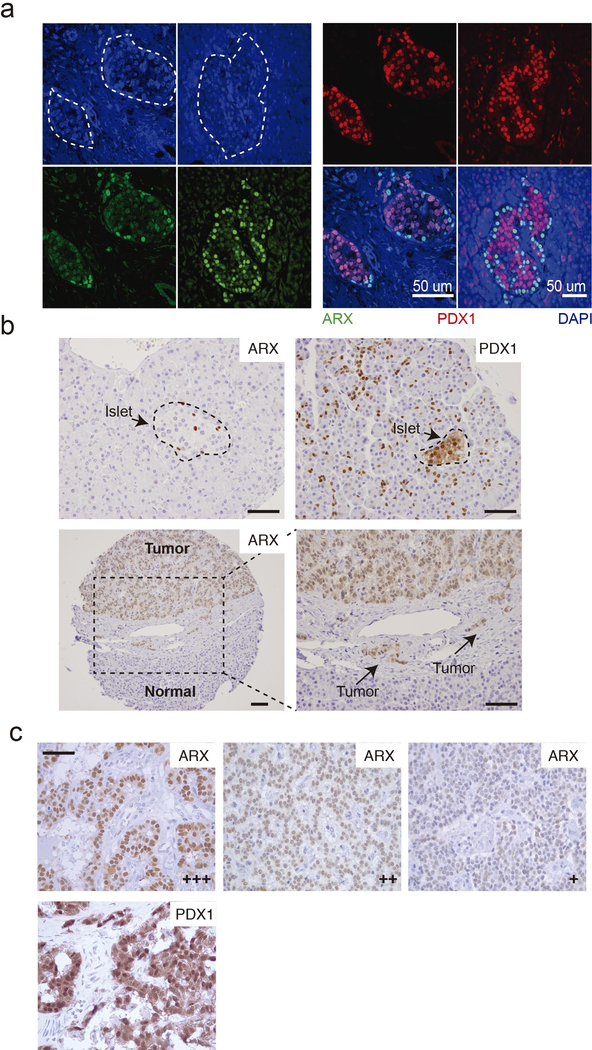
From H3K27ac ChIP-seq on 13 additional frozen PNETs (validation cohort), we designated tumors as type A if signals were high (>500 reads per kb per million sequence tags, RPKM) at ARX and IRX2 but absent or low (<250 RPKM) at PDX1; type B if the ARX locus was largely unmarked (<250 RPKM); and type C if read counts at ARX and PDX1 were comparable. While A or C typing was ambiguous in 2 PNETs, the B type was easily identified by lack of H3K27ac at ARX. Similar to the discovery set, the validation cohort readily distinguished type B from other PNETs by H3K27ac signals at alpha cell/type A- and beta cell/type B-specific enhancers (Fig. 2 and Extended Data Fig. 1c). Moreover, ARX and PDX1 immunostains gave the expected signals in normal human islets (Extended Data Fig. 2a–b) and importantly, 15 independent additional non-functional PNETs showed mutually exclusive, nucleus-dominant ARX or PDX1 expression in 10 tumors (67%); 5 cases lacked or co-expressed both TFs (Fig. 3a).
Figure 2. PNET subtypes represent distinct endocrine lineages.
(a) Relative H3K27ac ChIP-seq signals in all 21 PNETs (8 from the discovery set + 13 additional) of types A (ARX+), B (PDX1+) and C (double-positive, DP) at enhancers that are specific to A vs. B PNETs (Fig. 1d) and alpha vs. beta cells33. (b-c) Genomic views of the ARX (b) and PDX1 (c) loci, showing H3K27ac signals for all 21 PNETs. ChIP-seq signals are scaled by promoter-based DESeq2 normalization (see Methods).
Figure 3. ARX and PDX1 immunostains distinguish PNET sub-types.
(a) Assignment of PNETs in a small independent cohort to sub-types based on immunostaining for ARX (type A), PDX1 (type B), both TFs (double-positive, DP) or neither (double-negative, DN). Numbers in each slice indicate independent biological samples, and representative data from each subtype illustrate specificity, which allowed unambiguous assignment. (b) PNET subtype distribution in a large (n=77) cohort, dominated by 61 MEN1-mutant cases. Numbers in each slice indicate independent biological samples. (c) Double immunofluorescence for PDX1 (red) and ARX (green) in a DP tumor, showing TF co-expression in most cells (yellow arrow), with solitary ARX or PDX1 staining in the minority. Scale, 50 μm. Similar results were evident in all 4 examples tested. (d) H3K4me2 and mRNA levels in PNETs subtyped by immunostaining, showing that differential histone modifications and transcript levels match the assignments. Every evaluated case is shown. ChIP-seq signals are scaled by promoter-based DESeq2 normalization. RNA-seq signal is scaled to 0–2 fragments per million reads.
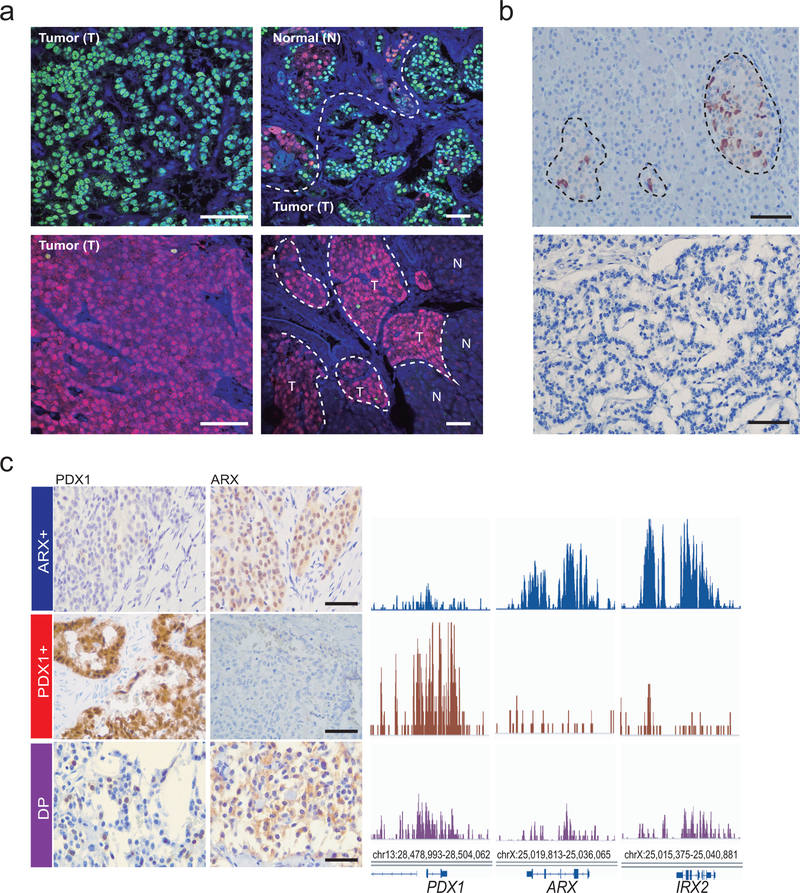
Next we examined tissue microarrays representing 77 Dutch PNETs35, 61 of which (79%) had germline MEN1 mutations, including 13 insulinomas associated with hyperinsulinemia (Supplementary Table 5). Overall, 34 of the 77 cases showed nuclear expression of ARX only (31% type A), 31 expressed only PDX1 (37% type B), and 12 cases were either double-positive (DP) or double-negative (DN – 8% each, Fig. 3b and Extended Data Fig. 2b). When present, IHC signals for PDX1 were uniformly strong and every insulinoma, scored blindly, expressed only PDX1. Though equally unambiguous, ARX signals varied in strength across type A tumors (Extended Data Fig. 2c); thus, some DN tumors may represent technical failure of IHC, while others may represent type A PNETs with low ARX expression. DP tumor cells largely co-express ARX and PDX1 (Fig. 3c and Extended Data Fig. 3a), possibly representing a dual lineage. MEN1 mutations did not skew the proportions of A and B tumors (Fig. 3b).
We profiled H3K4me2 and mRNAs in selected tumors from the Dutch cohort using FiT-seq36 and RNA-seq. PNETs identified by IHC as ARX+ or PDX1+ expressed exclusively those mRNAs and showed abundant H3K4me2 only at the corresponding super-enhancers; DP tumors (type C) expressed both ARX and PDX1 mRNAs, with less pronounced enhancer marks at both loci (Fig. 3d). Of note, no PNETs in this group expressed somatostatin (Extended Data Fig. 3b). FiT-seq for H3K27ac and immunostaining on representative FFPE samples from the discovery cohort also revealed concordance (Extended Data Fig. 3c). Thus, IHC classifies PNETs robustly, reflecting lineage-specific gene and enhancer signatures that we henceforth call ARX+, PDX1+, and DP.
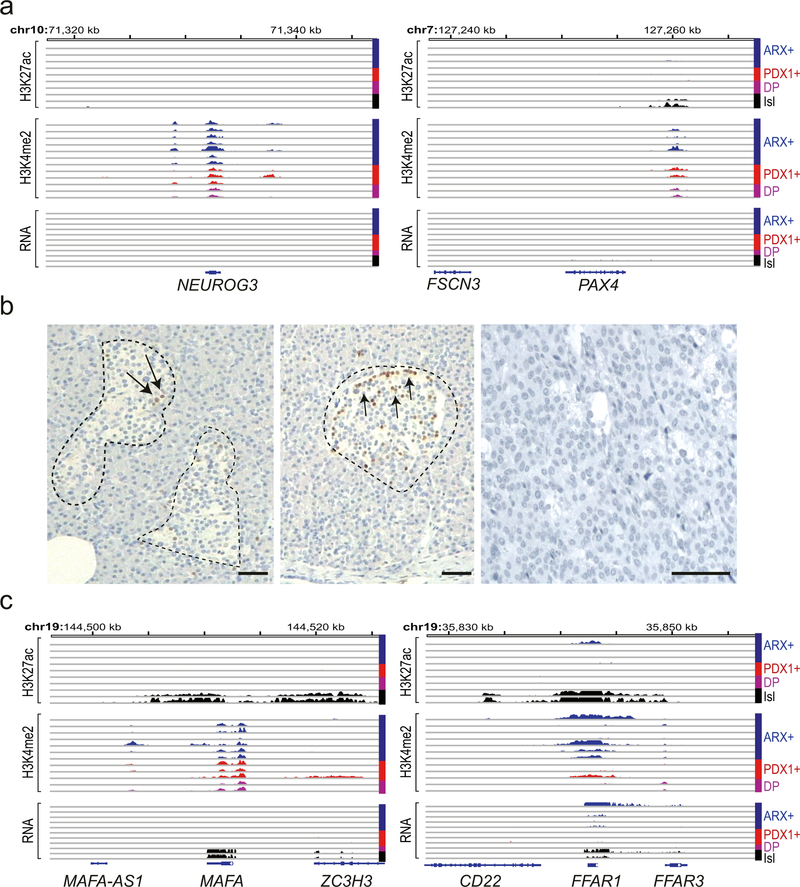
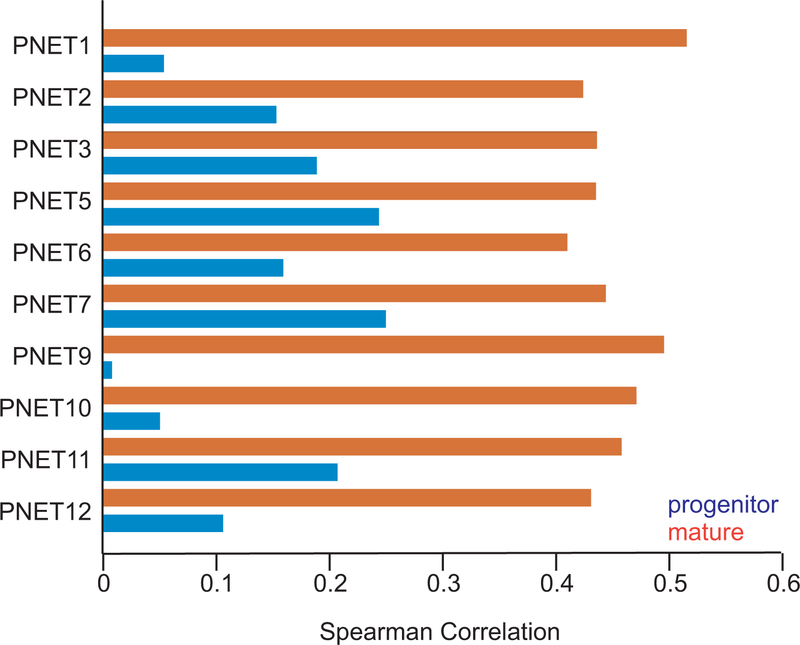
PNETs uniformly lacked H3K27ac and mRNA expression at early-acting NEUROG3 and PAX4 loci (Extended Data Fig. 4a), similar to isolated human islets, and IHC failed to detect NEUROG3 in any tumor (Extended Data Fig. 4b). In contrast, enhancer marking and mRNA levels were high at other canonical endocrine loci (ISL1 and NEUROD1 – data not shown), but not at terminal differentiation genes (e.g., MAFA and FFAR1 – Extended Data Fig. 4c). H3K4me2 -but not H3K27ac- appeared at many such loci, and because PNETs may represent arrested differentiation, we compared tumor mRNA profiles with those of normal mature and progenitor islet cells37 (Supplementary Table 6). In all PNETs with mRNA data, the mature cell signature was stronger than that of progenitors (Extended Data Fig. 5), suggesting that ARX+ and PDX1+ non-functional PNETs partially resemble mature alpha and beta cells, respectively.
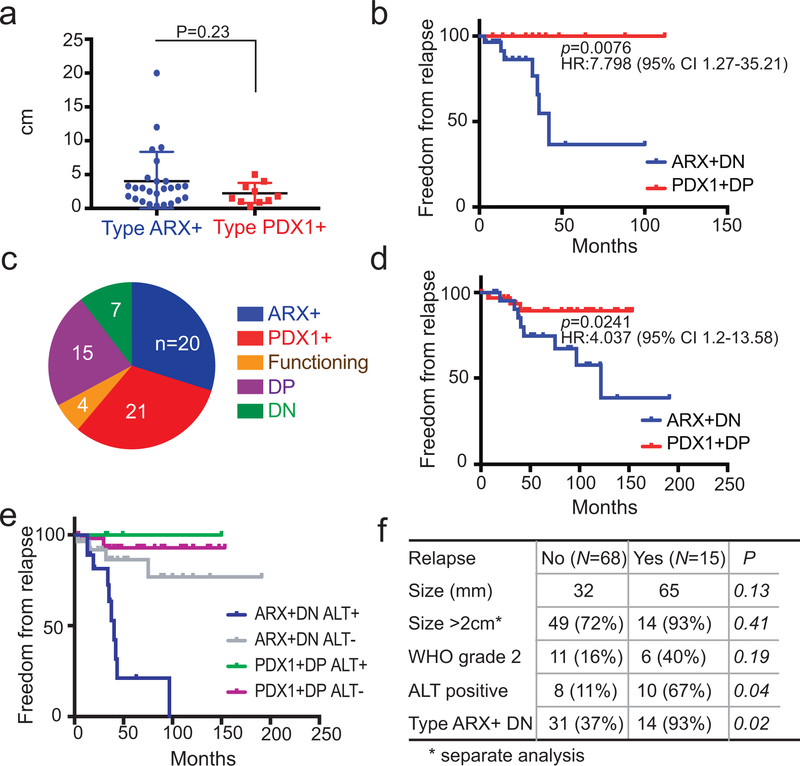
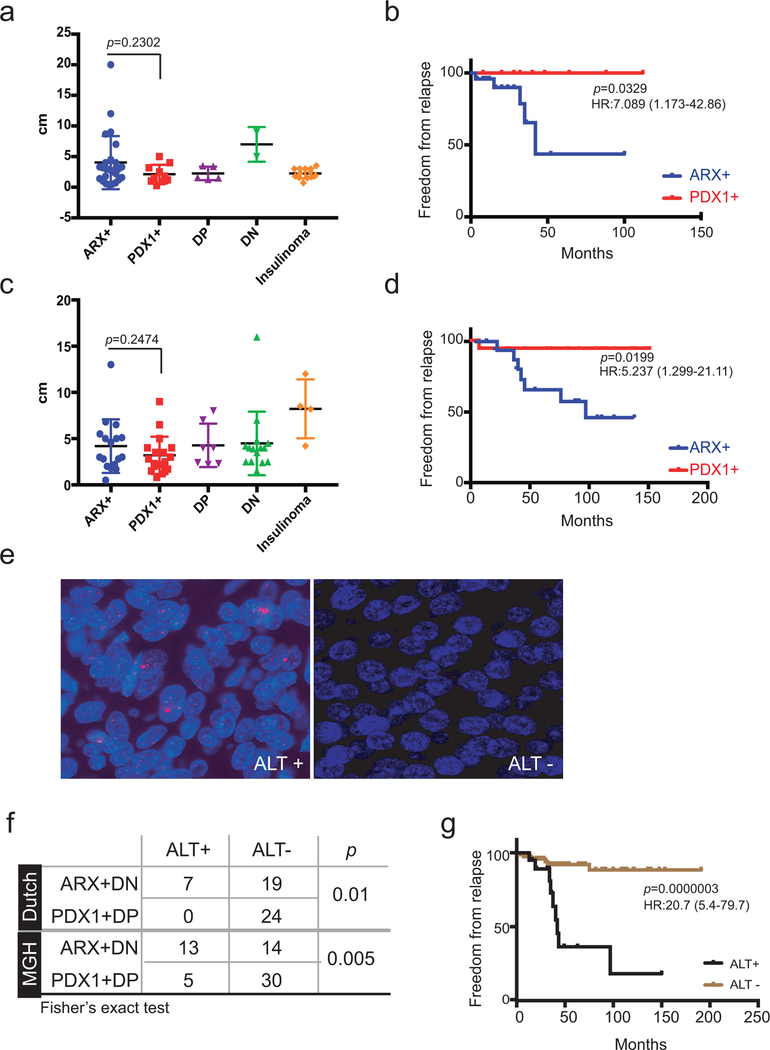
Detailed clinical follow-up was documented on the 61 Dutch MEN1-mutant cases38 (Supplementary Table 5). ARX+ and PDX1+ non-functional PNETs (n=47) did not differ by tumor size or grade (Fig. 4a) and the range of sizes was like that of insulinomas (Extended Data Fig. 6a). With 24 months of median follow-up (longest 8 yr), all relapses occurred in the liver and only in ARX+ or DN cases; no PDX1+ or DP PNETs recurred (Fig. 4b and Extended Data Fig. 6b). We then studied 67 unselected cases from Massachusetts (Supplementary Table 5), where IHC revealed roughly equal fractions of ARX+ and PDX1+ PNETs, but a larger proportion of DN tumors than the previous cohorts (Fig. 4c). Tumor size was known for 61 cases and clinical outcomes for 56 of the 60 non-functional PNETs. ARX+ and PDX1+ tumors were similar in size (Extended Data Fig. 6c). All relapses over 66 months of median follow-up (longest >15 yr) occurred at distant sites, mostly in patients with ARX+ or DN tumors (Fig. 4d and Extended Data Fig. 6d, P=0.02); only one PDX1+ and 2 DP tumors relapsed. Thus, PDX1 expression correlated with favorable prognosis in two distinct PNET cohorts.
Figure 4. Different prognosis of PNET subtypes.
(a) Size of all 36 primary tumors with data available for size and PNET type in the Dutch cohort (P =0.23, Mann-Whitney test, 2-tailed). Bars represent mean ±SD. (b) Kaplan-Meier analysis of disease-free survival in all 47 Dutch cases with available data, showing significant recurrence of ARX+ and DN tumors considered together (P =0.0076, log-rank test 2-sided; hazard ratio, HR=7.8, Mantel-Haenszel test; 95% confidence interval (CI) is indicated). No PDX1+ tumor recurred, and outcomes of ARX+ tumors (ungrouped from DN) are shown in Fig. S6b. (c) Distribution of PNET subtypes in the MGH cohort (N =67; numbers in each slice indicate independent biological samples). (d) Kaplan-Meier analysis of disease-free survival in all 55 MGH cases with available data, confirming the worse prognosis associated with ARX+ and DN tumors considered together (P =0.024, log-rank test 2-sided; HR =4.04, 95% CI 1.2 – 13.58). Data for ARX+ and PDX1+ tumors, separated from DP and DN, are in Fig. S6d. (e) Kaplan-Meier analysis of disease-free survival in both cohorts, with cases sub-typed for both TF expression and ALT. All ARX+ and DN tumors with ALT recurred. While PDX1+ tumors gave excellent outcomes irrespective of ALT status (the only recurrence lacked ALT), ARX+ and DN tumors without ALT had an intermediate prognosis. (f) Multiple logistic regression analysis of the MGH and Dutch cohorts combined (N=83 – all cases with relevant data, including 15 relapses). ARX+ and DN status are strong prognostic indicators.
We used telomere-specific FISH to determine ALT status, which is associated with ATRX and DAXX mutations12–14, in 50 Dutch MEN1-related and 62 US sporadic PNETs (Extended Data Fig. 6e). Thirteen of 27 sporadic ARX+ and DN tumors (48.1%) showed ALT, compared to 14.3% of 35 PDX1+ and DP tumors (P <0.005, Fisher’s exact test); similar relationships appeared in MEN1-mutant cases (Extended Data Fig. 6f). ALT was associated with disease relapse, as expected12–14 (Extended Data Fig. 6g), but was more informative when combined with PNET sub-type: Relapses occurred in every ARX+ALT+ tumor, only 9% of ARX+ALT− cases, and just one PDX1+ALT− case (Fig. 4e).
Among the 103 total cases with clinical follow-up, 83 had data on sub-type, size, ALT, and WHO grade. The odds ratio (OR) for relapse of ARX+ or DN cases was higher (14.45, 95% confidence interval, CI 1.79–116.61) than ORs for 2 cm size (1.14, CI 0.12–11.07) and even 3 cm (8.47, CI 2.11–34.02). Even excluding DN and DP cases (remaining n=64), the OR for relapse of ARX+ PNETs (10.31, CI 1.25–84.73), was better than for tumors >2 cm (8.13, CI 0.99–66.97) or >3 cm (9.6, CI 1.94–47.44). Relapses occurred in patients with WHO grade 1 PNETs, and considering all variables by multiple logistic regression, tumor grade was a poor independent risk factor (Fig. 4f). Only ALT and especially absence of PDX1 correlated independently with relapse (Fig. 4f); PDX1+ PNETs rarely relapsed.
In summary, enhancer profiles in overtly similar non-functional PNETs revealed superficial similarities with islet alpha or beta cells, reflected in IHC delineation of ARX+, PDX1+, and fewer ARX+PDX+ (DP) tumors. Among 103 cases followed at length after surgery, distant relapses predominated in patients with ARX+ tumors, occurring in only 3 PDX1+ or DP cases. This favorable association with PDX1 expression can be applied rapidly in the clinic. Specifically, patients with small PDX1+ tumors may be reassured and followed conservatively, while vigilant monitoring in patients with PDX1− tumors may detect early metastases amenable to surgical or medical treatment. Consideration of ALT+ status, which correlates with ARX expression, adds prognostic information, but is less practical than IHC in clinical laboratories. The superior prognosis of PDX1+ over ARX+ PNETs matches the indolent and aggressive disease courses, respectively, of metastatic insulinoma and glucagonoma1,3; thus, PNETs that resemble beta cells have better clinical outcomes irrespective of hormonal activity and disease extent. RNA analyses in mouse and human PNETs previously found a group with high Insulin expression39, but did not identify tumor subtypes or different clinical outcomes. Conversely, Chan et al found enriched alpha-cell RNA signatures and worse prognosis in ATRX-, DAXX- or MEN1-mutant PNETs40. The new, clinically actionable differences we report among PNET types illustrate a general strategy to stratify cancers by epigenetic landscapes and cell lineage, with prognostic implications.
Online Methods
Clinical materials (Suppl. Tables 1 and 5).
Fresh-frozen pancreatic and intestinal NE tumor specimens were obtained from tissue banks at Massachusetts General (MGH) and Brigham & Women’s (BWH) hospitals. FiT-seq and RNA-seq occurred on 7 and 8 additional formalin-fixed, paraffin-embedded (FFPE) PNET specimens, respectively, in the Dutch cohort and 4 FFPE specimens from the discovery set. We validated the epigenome classification by ChIP-seq on 13 additional fresh-frozen PNETs and by immunophenotyping of 15 FFPE samples from BWH, tissue microarrays (TMAs) representing 77 cases (61 with clinical information) from a Dutch national registry, and 67 PNETs (54 with clinical information) from MGH. The TMAs included replicate sections and surrounding normal pancreas. All patients gave informed consent for use of primary tumor tissues and, where shown, clinical outcomes. Institutional Review Boards at Dana-Farber/Harvard Cancer Center and University Medical Center Utrecht approved the studies. Pathologists reviewed hematoxylin and eosin-stained tissue sections to confirm diagnoses.
ChIP- and FiT-seq.
30-μm sections from frozen samples with >90% tumor enrichment were collected in microtubes, washed in phosphate-buffered saline (PBS), cross-linked with 1% formaldehyde for 5 min, and quenched with 0.125 M glycine for 5 min at room temperature. Cross-linked material was resuspended in 0.1% SDS (50 mM Tris-HCl pH8, 10 mM EDTA) and sonicated for 40 min in a Covaris E210 instrument (duty cycle 20%; intensity 8; cycles per burst 200). For FiT-seq, we macrodissected FFPE sections to obtain >80% tumor cell enrichment and used 10 sections, each 10 μm thick. Sections were washed 3 times with xylenes to remove paraffin, rehydrated in an ethanol/water series, and prepared as described36, with modified buffer and sonication conditions (Covaris E220 instrument, 20 min, 5% duty cycle, 105 Peak Incident Power, 200 Cycles per burst, 1mL AFA Fiber milliTUBEs). Soluble chromatin (5 μg) was immunoprecipitated with 10 μg H3K27ac (Active Motif 39133) antibody (Ab) for ChIP-seq and H3K4me2 (Millipore 07–030) or H3K27ac (Diagenode C15410196) Ab for FiT-seq. ChIP-seq libraries were constructed by end repair (Epicentre ER0720) of precipitated DNA, base extension with Klenow fragment (New England Biolabs M0212L), and ligation (New England Biolabs M220S) of Y-form sequencing adapters (Illumina), followed by 14 cycles of PCR. Between enzymatic steps, fragments of the desired size were enriched using AMPure XP beads (Beckman Coulter). FiT-seq libraries were prepared using ThruPLEX-FD kits (Rubicon Genomics) following the manufacturer’s protocols. 36-bp paired-end reads were sequenced on a HiSeq 2500 instrument (Illumina).
RNA-seq.
A small piece of each snap-frozen primary tumor was pulverized using the T-prep method (Covaris, cat # 520097) on dry ice, followed by implementation of Agencourt RNAadvance (Beckman Coulter, cat # A32645) on a Biomek® FXP automation workstation (Beckman Coulter) to isolate RNA. We used 150 ng RNA to prepare libraries with TruSeq Stranded Total RNA kits (Illumina, cat #RS-122–2301). From FFPE tissues, we deparaffinized four 10-μm sections, rehydrated these in an ethanol/water series, and extracted RNA using AllPrep DNA/RNA FFPE kits (Qiagen). We measured concentrations using the Quant-iT RiboGreen RNA assay (Thermo Fisher) and assessed quality on an Agilent 2100 Bioanalyzer using the Agilent RNA 6000 Nano kit. Ribosomal and mitochondrial RNAs were removed using biotinylated, target-specific oligonucleotides combined with Ribo-Zero rRNA removal beads and the TruSeq Stranded Total RNA kit (Illumina). 75-bp single-end reads were sequenced on a NextSeq 500 Instrument (Illumina).
Immunostaining.
Tissue sections were deparaffinized in xylenes and hydrated through ethanol and water series. Antigens were retrieved in 10 mM Na citrate (pH 6) and 0.05% Tween-20 in a pressure cooker for 3 min. After cooling and rinsing with PBS, slides were treated with 3% H2O2 in PBS for 10 min to quench endogenous peroxidases, washed, and incubated in blocking solution (PBS containing 1% BSA and 1% Tween-20) for 1 h at ambient temperature. Slides were incubated with ARX (Thermo Fisher AF7068SP, dilution 1:300), PDX1 (Abcam ab134150, 1:300), NEUROG3 (Fisher Scientific AB5684, 1:50) or SST (Agilent A056601–2, 1:10,000) Ab diluted in blocking solution for 1 h. Slides stained for PDX1, SST or NEUROG3 were washed in PBS and incubated with the peroxidase-based EnVision Kit (Dako). Slides stained for ARX were incubated with HRP-conjugated anti-sheep Ab (Santa Cruz sc-2473, 1:500 in blocking solution) for 30 min, followed by VectaStain Elite ABC kit (Vector) for 30 min, washed, developed using 3,3’-diaminobenzidine (Dako), and counterstained with Mayer’s hematoxylin. For double immunostaining, slides were blocked with 5% fetal bovine serum in PBS for 1 h at room temperature and incubated overnight at 4°C with ARX (1:100 in PBS, 1% BSA, 0.3% triton X-100) and PDX1 (1:500) Ab. Slides were then incubated with a biotinylated anti-sheep Ab (Life Technologies A16045, 1:250), followed by a mix of Alexa Fluor 488- conjugated streptavidin (Life Technologies S11223) and Alexa Fluor 546-conjugated anti-rabbit sAb (Life technologies A11035, 1:250) for 1 h, washed in PBS, and mounted in DAPI+ Vectashield medium (Vector). Associations of TF expression with clinical variables were calculated using statistical package SPSS v19.0.0.
Telomere-specific fluorescence in situ hybridization (FISH) and assessment of ALT.
Deparaffinized TMA slides were hydrated, steamed for 25 min in citrate buffer (Vector Laboratories), dehydrated, and hybridized with a Cy3-labeled peptide nucleic acid (PNA) probe complementary to the mammalian telomere repeat sequence. An Alexafluor 488-labeled PNA probe specific to human centromeric DNA was included as a positive control. Following post-hybridization washes, slides were counterstained with DAPI. ALT+ tumors were identified by telomere length heterogeneity and presence of large, ultra-bright foci of nuclear FISH signals in ≥1% of tumor cells12,14. Necrotic areas were excluded from consideration and two individuals blinded to the PNET sub-type scored the slides, with 100% concordance.
Computational and statistical analyses.
ChIP-seq reads were aligned to the reference genome (hg19) using BWA 0.7.10 (Ref.41). Reads with mapping scores <10 were discarded, and those aligned to the same position and strand were only counted once. Density signals were calculated by igvtools and visualized on the Integrated Genome Viewer42. H3K27ac and H3K4me2 peaks (style ‘histone’ for variable length, local filtering disabled) were called using HOMER (Ref.43). We generated a union set of H3K27ac+ peaks by taking the top 50,000 from each sample and merging those peaks using bedtools merge44. Reads were acetylation signals at enhancers, estimated from ChIP-seq reads that fell within this union set and counted using featureCounts45.
H3K27ac profiles were compared using DESeq2 (Ref. 46). Promoter signals (<2 kb downstream and <2.5 kb upstream of TSSs) vary less than those at enhancers; therefore, only promoter signals were used to estimate normalization (size) factors (SFs) for each library by DESeq2. When comparing libraries normalized by these SF, we considered only enhancers with average normalized read counts ≥100. P values were calculated by the Wald test and false discovery rates (FDRs) by the Benjamini-Hochberg method47. Super-enhancers were called by ROSE19 from H3K27ac peaks using default parameters. Public H3K27ac ChIP-seq data, obtained from the following sources, were re-analyzed using the above methods.
Pancreatic ductal adenocarcinoma48 – Gene Expression Omnibus (GEO) accessions GSM2131266 and GSM2131280
Gastric adenocarcinoma49 – GEO accessions GSM1969645 and GSM1969657
Colorectal cancer50 – GEO accessions GSM2058055 and GSM2058056
Normal islets51 – ArrayExpress accession E-MTAB-1919
Alpha and beta cell-specific enhancers were obtained from Supp. Table 4 in Ref. 33. Enhancers shared with PNET types A (ARX+) and B (PDX1+) were determined by bedtools intersect44, and enrichment p-values were calculated by Fisher’s exact test. To cluster PNETs by enhancer signatures (Fig. 2a and Extended Data Fig. 1c), we performed hierarchical clustering of the Pearson correlations of H3K27ac profiles (quantified by log2 read counts), by shortest distance linkage.
RNA-seq reads were mapped to the hg19 reference genome using STAR 2.5.2 (Ref.52) and GENCODE v19 annotations; reads with mapping scores <10 were discarded. To compare RNA profiles, reads were counted with featureCounts45 and compared using DESeq2. P values were calculated by the Wald test and FDRs by the Benjamini-Hochberg method, considering only genes with average normalized read count ≥100 and using a Cook’s cutoff of 20. RNA-seq data on normal pancreatic islets53 were obtained from GEO accessions GSM1303932 and GSM1303934. Alpha and beta cell-specific genes were obtained from Suppl. Table S2 in Ref. 34. Enrichment p-values of alpha and beta cell-specific genes were calculated by Fisher’s exact test (2-sided). Pancreatic endocrine cell mRNA signatures were obtained from Suppl. Table S1 in Ref. 37, considering populations A and B as mature, and populations C and D as progenitors (Extended Data Fig. 5). Correlations of tumors to these Mature and Progenitor signatures were based on Spearman correlation of log2(tpm+1) values of the tumor and the average log2(tpm+1) values of Mature and Progenitor islet cell populations.
ALT status and PNET immunohistochemistry were compared using Fisher’s exact test (2-sided). Tumor sizes between groups were compared using the Mann-Whitney test, 2-tailed. Disease-free survival was analyzed by the log-rank test and Kaplan-Meier plots were generated using GraphPad Prism v7. To assess the prognostic value of different variables, we applied SPSS Statistics for multiple logistic regression analysis.
Extended Data
Extended Data Fig 1. PNET subtypes are associated with distinct enhancers of lineage-restricted transcription factors.
(a) H3K27ac, H3K4me2, and mRNA data tracks at ARX and PDX1 in all 8 PNETs from the discovery set and from 2 samples of normal islets of Langerhans (Isl). ChIP-seq signals are scaled by promoter-based DESeq2 normalization (see Methods) and mRNA read counts are normalized by total read numbers (y-axis represents 0–2 fragments per million reads). (b) Distributions of ARX and PDX1 mRNA levels in A- and B-type PNETs. (c) Pearson correlations of H3K27ac signals at PNET type A/alpha-cell and type B/beta-cell enhancers in all 21 tumors from the discovery and validation cohorts (n=8 and n=13 biologically independent samples, respectively).
Extended Data Fig 2. ARX and PDX1 immunostain in human normal islets and PNETs.
(a) Double-immunofluorescence for PDX1 (red) and ARX (green) in normal islets (marked by dashed white outlines). Scale bar, 50 μm. The results, representing hundreds of islets, verify Ab specificity, lineage-restricted expression, and cell distributions: abundant PDX1+ beta cells scattered across islets and fewer ARX+ alpha cells enriched in the islet periphery. (b) Top: ARX and PDX1 immunohistochemistry (IHC) selectively mark endocrine alpha and beta cells, respectively, in normal human islets. Many exocrine and ductal cells also express PDX1, as is well known24. The results represent hundreds of normal islets from multiple individuals, which revealed no ARX+ PDX1+ double-positive cells. Thus, although described in rodent embryos24, such cells are absent or extremely rare in the adult human pancreas. Bottom: IHC for ARX in a representative PNET and surrounding normal cells on tissue microarrays from the Dutch cohort. The area boxed in the left image is magnified on the right. ARX+ cells dominate in the tumor and mark invasive foci (arrows). (c) Range of IHC signal strength in ARX+ PNETs (+ weak, ++ moderate, +++ strong), contrasted with uniformly robust PDX1 staining. Images are examples selected from 34 ARX+ and 31 PDX+ cases (Fig. 3b). Scale bars, 50 μm.
Extended Data Fig 3. Additional immunohistochemical and enhancer characterization of PNETs.
(a) Double immunofluorescence of representative ARX+ (type A, n=34 biologically independent samples) and PDX1+ (type B, n=31 biologically independent samples) tumors (T) adjacent to normal islets (N), showing selective detection of ARX (green) and PDX1 (red), respectively. Lack of Ab cross-reactivity controls for ARX and PDX1 co-staining (Fig. 3c) in DP tumors. (b) Somatostatin (SST) expression in normal islets (delta cells) and absence in all 77 Dutch PNETs, including the representative DN tumor (n=6 biologically independent samples) shown here. (c) IHC results for ARX and PDX1 shown alongside H3K27ac FiT-seq data from the same samples in 3 of the 4 cases (one of each sub-type) from the discovery cohort where both FFPE and frozen samples were available.
Extended Data Fig 4. Other endocrine-specific loci in PNETs.
(a) H3K27ac, H3K4me2, and mRNA data tracks from all 8 PNETs in the discovery set and from 2 normal islet samples at loci that control early pancreas ontogeny: NEUROG3 and PAX4. Histone marks and RNA-seq data are scaled as in Fig. S1a. (b) IHC for NEUROG3 in rare normal islets (dashed outlines), showing scarce NEUROG3+ endocrine cells (arrows). Hundreds of normal islets and all 19 biologically independent PNETs represented on one TMA (one example is shown) lacked expression. (c) H3K27ac, H3K4me2, and mRNA data tracks from all 8 PNETs in the discovery set and from 2 normal islet samples at loci that control terminal endocrine cell maturation, MAFA and FFAR1. Histone marks and RNA-seq data are scaled as in Fig. S1a. A single outlier showed strong H3K27ac and mRNA at FFAR1.
Extended Data Fig 5. Differentiation status of PNETs tumors.
(a) Correlations of mRNA profiles in individual PNETs with those of pancreatic endocrine progenitor and mature cells37. X-axis: Spearman correlations between log2(tpm+1) values of each tumor and the average log2(tpm+1) values of mature and progenitor populations.
Extended Data Fig 6. Association of PNET subtypes with ALT status.
(a, c) Tumor size in all PNET sub-types in the Dutch (a, n=56 independent tumors) and MGH (c, n=61 independent tumors) cohorts. Bars represent mean ±SD. P-values for differences in size of primary ARX+ and PDX1+ tumors determined by Mann-Whitney test, 2-sided. (b, d) Analyses of recurrence-free survival in the Dutch (b, N=30 cases) and MGH (d, N=35 cases) cohorts when ARX+ and PDX1+ tumors were considered separately, ungrouped from DP and DN tumors. P values and hazard ratios were determined by 2-sided log-rank and Mantel-Haenszel tests, respectively. (e, f) Representative (e, 1 example each from 25 independent ALT+ and 87 independent ALT− cases) and aggregate (f, n=112 biologically independent cases) results of telomere-specific FISH in cases classified as positive or negative for ALT. The statistical test was 2-sided. (g) Kaplan-Meier analysis of disease-free survival in all 112 cases with ALT data from both cohorts, without consideration of PNET sub-type.
Supplementary Material
Acknowledgments
Supported by the Neuroendocrine Tumor Research Foundation (R.A.S., B.E.B., M.H.K., D.C.C.); SPORE program in GI cancers (P50CA127003 – National Cancer Institute, R.A.S.); North American Neuroendocrine Tumor Society (C.M.H.); and a grant (PI18–01604 to P.C.) from Instituto de Salud Carlos III of the Spanish Economy and Competitiveness Ministry.
C.R.C. Pieterman, B. Havekes, A.R. Hermus, O.M. Dekkers, W.W. de Herder, M.L. Drent, A.N.A. van der Horst-Schrivers, and P.H. Bisschop contributed to the Dutch MEN1 Study Group database and tissue repository. We thank J. Chan for critical reading of the manuscript.
Footnotes
Author competing interests
The authors declare no competing interests.
Data availability
All relevant data are included in the manuscript and/or in its supplementary information files. ChIP-seq and RNA-seq data have been deposited in NCBI’s Gene Expression Omnibus under the Series GSE116356 (https://www.ncbi.nlm.nih.gov/geo/query/acc.cgi?acc=GSE116356). Other original data that support the findings of this study are uploaded as Source Data.
REFERENCES
- 1.Metz DC & Jensen RT Gastrointestinal neuroendocrine tumors: pancreatic endocrine tumors. Gastroenterology 135, 1469–1492 (2008). [DOI] [PMC free article] [PubMed] [Google Scholar]
- 2.Yao JC et al. One hundred years after “carcinoid”: epidemiology of and prognostic factors for neuroendocrine tumors in 35,825 cases in the United States. J Clin Oncol 26, 3063–3072 (2008). [DOI] [PubMed] [Google Scholar]
- 3.Kulke MH et al. NANETS treatment guidelines: well-differentiated neuroendocrine tumors of the stomach and pancreas. Pancreas 39, 735–752 (2010). [DOI] [PMC free article] [PubMed] [Google Scholar]
- 4.Lawrence B et al. The epidemiology of gastroenteropancreatic neuroendocrine tumors. Endocrinol Metab Clin North Am 40, 1–18, vii (2011). [DOI] [PubMed] [Google Scholar]
- 5.Collombat P et al. Opposing actions of Arx and Pax4 in endocrine pancreas development. Genes Dev 17, 2591–2603 (2003). [DOI] [PMC free article] [PubMed] [Google Scholar]
- 6.Gannon M et al. Pdx-1 function is specifically required in embryonic beta cells to generate appropriate numbers of endocrine cell types and maintain glucose homeostasis. Dev Biol 314, 406–417 (2008). [DOI] [PMC free article] [PubMed] [Google Scholar]
- 7.Rindi G et al. in WHO Classification of Tumours of the Digestive System (eds Bosman FT, Carneiro F, Hruban RH, & Theise ND) (International Agency for Research on cancer (IARC), 2017). [Google Scholar]
- 8.Falconi M et al. ENETS consensus guidelines update for the management of patients with functional pancreatic neuroendocrine tumors and non-functional pancreatic neuroendocrine tumors. Neuroendocrinology 103, 153–171 (2016). [DOI] [PMC free article] [PubMed] [Google Scholar]
- 9.Kouvaraki MA et al. Surgical treatment of non-functioning pancreatic islet cell tumors. J Surg Oncol 89, 170–185 (2005). [DOI] [PubMed] [Google Scholar]
- 10.Jiao Y et al. DAXX/ATRX, MEN1, and mTOR pathway genes are frequently altered in pancreatic neuroendocrine tumors. Science 331, 1199–1203 (2011). [DOI] [PMC free article] [PubMed] [Google Scholar]
- 11.Scarpa A et al. Whole-genome landscape of pancreatic neuroendocrine tumours. Nature 543, 65–71 (2017). [DOI] [PubMed] [Google Scholar]
- 12.Heaphy CM et al. Altered telomeres in tumors with ATRX and DAXX mutations. Science 333, 425 (2011). [DOI] [PMC free article] [PubMed] [Google Scholar]
- 13.Marinoni I et al. Loss of DAXX and ATRX are associated with chromosome instability and reduced survival of patients with pancreatic neuroendocrine tumors. Gastroenterology 146, 453–460 (2014). [DOI] [PubMed] [Google Scholar]
- 14.Singhi AD et al. Alternative lengthening of telomeres and loss of DAXX/ATRX expression predicts metastatic disease and poor survival in patients with pancreatic neuroendocrine tumors. Clin Cancer Res 23, 600–609 (2017). [DOI] [PMC free article] [PubMed] [Google Scholar]
- 15.Zhou VW, Goren A & Bernstein BE Charting histone modifications and the functional organization of mammalian genomes. Nat Rev Genet 12, 7–18 (2011). [DOI] [PubMed] [Google Scholar]
- 16.Rivera CM & Ren B Mapping human epigenomes. Cell 155, 39–55 (2013). [DOI] [PMC free article] [PubMed] [Google Scholar]
- 17.Hnisz D et al. Super-enhancers in the control of cell identity and disease. Cell 155, 934–947, doi: 10.1016/j.cell.2013.09.053 (2013). [DOI] [PMC free article] [PubMed] [Google Scholar]
- 18.Parker SC et al. Chromatin stretch enhancer states drive cell-specific gene regulation and harbor human disease risk variants. Proc Natl Acad Sci USA 110, 17921–17926 (2013). [DOI] [PMC free article] [PubMed] [Google Scholar]
- 19.Whyte WA et al. Master transcription factors and mediator establish super-enhancers at key cell identity genes. Cell 153, 307–319 (2013). [DOI] [PMC free article] [PubMed] [Google Scholar]
- 20.Wang X et al. SMARCB1-mediated SWI/SNF complex function is essential for enhancer regulation. Nat Genet 49, 289–295 (2017). [DOI] [PMC free article] [PubMed] [Google Scholar]
- 21.Ackermann AM, Wang Z, Schug J, Naji A & Kaestner KH Integration of ATAC-seq and RNA-seq identifies human alpha cell and beta cell signature genes. Mol Metab 5, 233–244 (2016). [DOI] [PMC free article] [PubMed] [Google Scholar]
- 22.Wang H et al. Insights into beta cell regeneration for diabetes via integration of molecular landscapes in human insulinomas. Nat Commun 8, 767 (2017). [DOI] [PMC free article] [PubMed] [Google Scholar]
- 23.Barski A et al. High-resolution profiling of histone methylations in the human genome. Cell 129, 823–837 (2007). [DOI] [PubMed] [Google Scholar]
- 24.Larsen HL & Grapin-Botton A The molecular and morphogenetic basis of pancreas organogenesis. Semin Cell Dev Biol 66, 51–68 (2017). [DOI] [PubMed] [Google Scholar]
- 25.Sosa-Pineda B, Chowdhury K, Torres M, Oliver G & Gruss P The Pax4 gene is essential for differentiation of insulin-producing beta cells in the mammalian pancreas. Nature 386, 399–402 (1997). [DOI] [PubMed] [Google Scholar]
- 26.Collombat P et al. The simultaneous loss of Arx and Pax4 genes promotes a somatostatin-producing cell fate specification at the expense of the alpha- and beta-cell lineages in the mouse endocrine pancreas. Development 132, 2969–2980 (2005). [DOI] [PubMed] [Google Scholar]
- 27.Collombat P et al. Embryonic endocrine pancreas and mature beta cells acquire alpha and PP cell phenotypes upon Arx misexpression. J Clin Invest 117, 961–970 (2007). [DOI] [PMC free article] [PubMed] [Google Scholar]
- 28.Sussel L et al. Mice lacking the homeodomain transcription factor Nkx2.2 have diabetes due to arrested differentiation of pancreatic beta cells. Development 125, 2213–2221 (1998). [DOI] [PubMed] [Google Scholar]
- 29.Yang YP, Thorel F, Boyer DF, Herrera PL & Wright CV Context-specific alpha- to-beta-cell reprogramming by forced Pdx1 expression. Genes Dev 25, 1680–1685 (2011). [DOI] [PMC free article] [PubMed] [Google Scholar]
- 30.Gutierrez GD et al. Pancreatic beta cell identity requires continual repression of non-beta cell programs. J Clin Invest 127, 244–259 (2017). [DOI] [PMC free article] [PubMed] [Google Scholar]
- 31.Swisa A et al. PAX6 maintains beta cell identity by repressing genes of alternative islet cell types. J Clin Invest 127, 230–243 (2017). [DOI] [PMC free article] [PubMed] [Google Scholar]
- 32.Johansson KA et al. Temporal control of neurogenin3 activity in pancreas progenitors reveals competence windows for the generation of different endocrine cell types. Dev Cell 12, 457–465 (2007). [DOI] [PubMed] [Google Scholar]
- 33.Arda HE et al. A Chromatin Basis for Cell Lineage and Disease Risk in the Human Pancreas. Cell Syst 7, 310–322 e314 (2018). [DOI] [PMC free article] [PubMed] [Google Scholar]
- 34.Wang YJ et al. Single-Cell Transcriptomics of the Human Endocrine Pancreas. Diabetes 65, 3028–3038 (2016). [DOI] [PMC free article] [PubMed] [Google Scholar]
- 35.Conemans EB et al. Expression of p27(Kip1) and p18(Ink4c) in human multiple endocrine neoplasia type 1-related pancreatic neuroendocrine tumors. J Endocrinol Invest 41, 655–661 (2018). [DOI] [PubMed] [Google Scholar]
- 36.Cejas P et al. Chromatin immunoprecipitation from fixed clinical tissues reveals tumor-specific enhancer profiles. Nat Med 22, 685–691 (2016). [DOI] [PubMed] [Google Scholar]
- 37.Ramond C et al. Understanding human fetal pancreas development using subpopulation sorting, RNA sequencing and single-cell profiling. Development 145, 1–15 (2018). [DOI] [PMC free article] [PubMed] [Google Scholar]
- 38.de Laat JM et al. Long-Term Natural Course of Pituitary Tumors in Patients With MEN1: Results From the DutchMEN1 Study Group (DMSG). J Clin Endocrinol Metab 100, 3288–3296 (2015). [DOI] [PubMed] [Google Scholar]
- 39.Sadanandam A et al. A cross-species analysis in pancreatic neuroendocrine tumors reveals molecular subtypes with distinctive clinical, metastatic, developmental, and metabolic characteristics. Cancer Discov 5, 1296–1313 (2015). [DOI] [PMC free article] [PubMed] [Google Scholar]
- 40.Chan CS et al. ATRX, DAXX or MEN1 mutant pancreatic neuroendocrine tumors are a distinct alpha-cell signature subgroup. Nat Commun 9, 4158 (2018). [DOI] [PMC free article] [PubMed] [Google Scholar]
- 41.Li H & Durbin R Fast and accurate short read alignment with Burrows-Wheeler transform. Bioinformatics 25, 1754–1760 (2009). [DOI] [PMC free article] [PubMed] [Google Scholar]
- 42.Thorvaldsdottir H, Robinson JT & Mesirov JP Integrative Genomics Viewer (IGV): high-performance genomics data visualization and exploration. Brief Bioinform 14, 178–192 (2013). [DOI] [PMC free article] [PubMed] [Google Scholar]
- 43.Heinz S et al. Simple combinations of lineage-determining transcription factors prime cis-regulatory elements required for macrophage and B cell identities. Mol Cell 38, 576–589 (2010). [DOI] [PMC free article] [PubMed] [Google Scholar]
- 44.Quinlan AR & Hall IM BEDTools: a flexible suite of utilities for comparing genomic features. Bioinformatics 26, 841–842 (2010). [DOI] [PMC free article] [PubMed] [Google Scholar]
- 45.Liao Y, Smyth GK & Shi W featureCounts: an efficient general purpose program for assigning sequence reads to genomic features. Bioinformatics 30, 923–930 (2014). [DOI] [PubMed] [Google Scholar]
- 46.Love MI, Huber W & Anders S Moderated estimation of fold change and dispersion for RNA-seq data with DESeq2. Genome Biol 15, 550 (2014). [DOI] [PMC free article] [PubMed] [Google Scholar]
- 47.Benjamini Y & Hochberg Y Controlling the false discovery rate: a practical and powerful approach to multipe testing J Royal Stat Soc Series B 57, 289–300 (1995). [Google Scholar]
- 48.McDonald OG et al. Epigenomic reprogramming during pancreatic cancer progression links anabolic glucose metabolism to distant metastasis. Nat Genet 49, 367–376 (2017). [DOI] [PMC free article] [PubMed] [Google Scholar]
- 49.Ooi WF et al. Epigenomic profiling of primary gastric adenocarcinoma reveals super-enhancer heterogeneity. Nat Commun 7, 12983 (2016). [DOI] [PMC free article] [PubMed] [Google Scholar]
- 50.Cohen AJ et al. Hotspots of aberrant enhancer activity punctuate the colorectal cancer epigenome. Nat Commun 8, 14400 (2017). [DOI] [PMC free article] [PubMed] [Google Scholar]
- 51.Pasquali L et al. Pancreatic islet enhancer clusters enriched in type 2 diabetes risk-associated variants. Nat Genet 46, 136–143 (2014). [DOI] [PMC free article] [PubMed] [Google Scholar]
- 52.Dobin A et al. STAR: ultrafast universal RNA-seq aligner. Bioinformatics 29, 15–21 (2013). [DOI] [PMC free article] [PubMed] [Google Scholar]
- 53.Cnop M et al. RNA sequencing identifies dysregulation of the human pancreatic islet transcriptome by the saturated fatty acid palmitate. Diabetes 63, 1978–1993 (2014). [DOI] [PubMed] [Google Scholar]
Associated Data
This section collects any data citations, data availability statements, or supplementary materials included in this article.


