Abstract
Intratumoral hypoxia is a major contributor to multiple drug resistance (MDR) in cancer, and can lead to poor prognosis of patients receiving chemotherapy. Development of an MDR-inhibitor that mitigates the hypoxic environment is crucial for cancer management and treatment. We report a biocompatible and biodegradable catalase-conjugated iron oxide nanoparticle (Cat-IONP) capable of converting reactive oxygen species (ROS) to molecular oxygen to supply an oxygen source for the hypoxic tumor microenvironment. Cat-IONP demonstrated initial enzymatic activity comparable to free catalase while providing a nearly 3-fold increase in long-term enzymatic activity. We demonstrate that Cat-IONP significantly reduces the in vitro expression of hypoxia-inducible factors at the transcription level in a breast cancer cell line. Co-treatment of Cat-IONP and paclitaxel (PTX) significantly increases the drug sensitivity of hypoxic-cultured cells, demonstrating greater than 2-fold and 5-fold reduction in cell viability in comparison to cells treated only with 80 and 120 μM PTX, respectively. These findings demonstrate the ability of Cat-IONP to act as an MDR-inhibitor at different biological levels, suggesting a promising strategy to combat cancer-MDR and to optimize cancer management and treatment outcomes.
Keywords: Catalase, iron oxide nanoparticles, hypoxia-inducible factors, breast cancer, drug delivery
Graphical Abstract
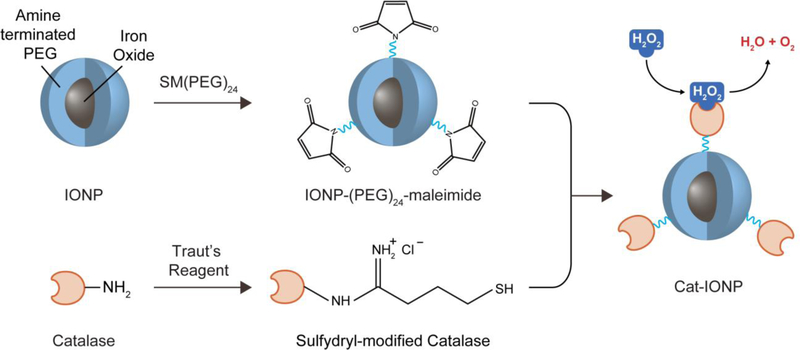
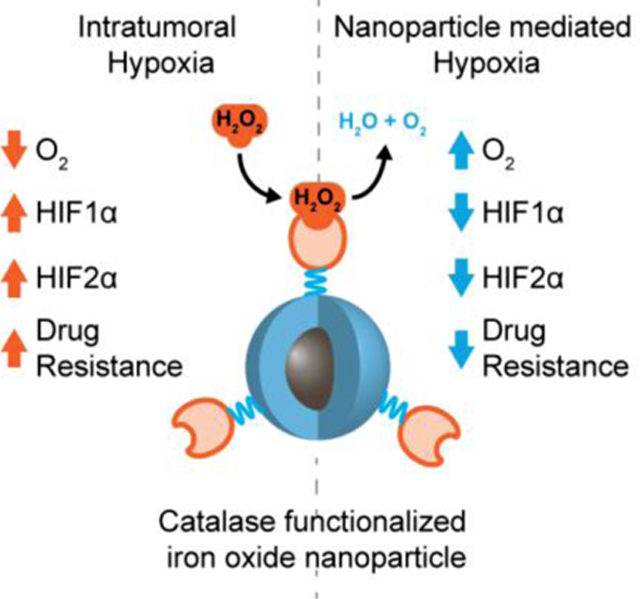
Nanoparticle, composed of an iron oxide core and a polyethylene glycol shell functionalized with catalase, presents comparable initial enzymatic activity identical to free catalase and long-term enzymatic activity, and shows its abiltiy to overcome chemotherapeutic resistance that arises in the hypoxic tumor microenvironment through upregulation of hypoxia-inducible factors.
1. Introduction
Fifty percent of current clinical cancer treatment regimens consist of chemotherapy.[1] However, in many cases the efficacy is hampered by the tumor’s intrinsic resistance to chemotherapeutic agents. Multidrug resistance (MDR) in tumors is caused by physiological and biological factors that lead to metabolic reprogramming in tumor cells.[2] These metabolic changes contribute to an increased efflux of chemotherapeutic drugs from cancer cells, leading to drug resistance and poor clinical prognosis. Despite significant resources and efforts expended for the development of MDR inhibitors, the eradication and management of MDR-cancer cells still pose a significant challenge due to the low biocompatibility and high cytotoxicity of current inhibitors,[2] necessitating new MDR treatment options.
A major physiological contributor to MDR is low oxygen availability within the tumor mass. Hypoxia-inducible factors (HIFs) are key regulators of oxygen levels within tissue, maintaining sufficient oxygen levels to carry out normal biological functions.[3,4] HIF expression is induced under hypoxic conditions and leads to activation of additional signaling pathways involved in cellular oxygen regulation.[5–7] HIFs are ideal targets for inhibition of MDR, since 1) increased HIF activity under hypoxic conditions is associated with loss-of-function for tumor suppressor genes and gain-of-function for oncogenes,[8–14] and 2) increased expression of HIF1α and HIF2α are closely correlated to tumor growth and chemotherapy resistance as observed in both animal and clinical studies.[15–17]
Inhibition of HIF-induced MDR requires introduction of a new oxygen source within the hypoxic intratumoral environment. Catalase, an enzyme that converts reactive oxygen species (ROS) to stable oxygen products, has been studied for its unique ability to convert hydrogen peroxide (H2O2) to molecular oxygen. However, catalase’s short blood half-life, and poor cellular uptake has limited its therapeutic application.[18,19] Researchers have applied nanoparticle (NP) delivery systems to protect the enzymes from degradation, prolong the blood half-life by minimizing clearance via the mononuclear phagocyte system, and increase cellular uptake in target tissue by facilitating endocytosis.[20,21] Utilization of iron oxide NPs (IONPs) for catalase delivery is particularly appealing due to the endogenous MRI contrast enhancement provided by the iron oxide core in addition to IONPs biocompatible and biodegradable properties.
In this study, we develop a catalase-loaded NP to provide stable delivery of catalase to mediate hypoxia and sensitize tumors to chemotherapeutics. An IONP, composed of a magnetite core with a siloxane polyethylene glycol monolayer, was conjugated with catalase (Cat-IONP) via PEG linkers. The iron oxide core provides means to monitor catalase delivery in real-time, while the PEG surface coating minimizes opsonization to facilitate increased stability in biological fluids. Notably, we demonstrated that Cat-IONP reduces the expression levels of HIF mRNA in a breast cancer (4T1) cell line. In vitro evaluation of co-administered Cat-IONP and paclitaxel also indicated the NP sensitizes 4T1 cells to chemotherapeutics, thereby increasing the treatment efficacy at lower doses.
2. Results and Discussion
2.1. Synthesis and characterization of Cat-IONP
The synthesis process of Cat-IONP is illustrated in Figure 1. The NP system consists of an 8 nm iron oxide (Fe3O4) core coated with a monolayer of siloxane polyethylene glycol, which is then conjugated with catalase by SM(PEG)24 linkers. SM(PEG)24 was conjugated to the IONP surface via a cross-linking reaction between the primary amine groups on IONP and the N-hydroxysuccinimide ester (NHS-ester) of SM(PEG)24. In parallel, a reactive thiol group was added to the surface of catalase via Traut’s reagent. The coupling of catalase to IONP was carried out between the maleimide group on the modified IONP and thiol group on the modified catalase, leading to the formation of Cat-IONP. Key primary physicochemical properties of IONP and Cat-IONP are listed in Table 1.
Figure 1.
Schematic representation of Cat-IONP synthesis. Cat-IONP was produced by an amine-reactive cross-linking reaction of SM(PEG)24 onto the surface of IONP (top) and thiolation of catalase by reaction of Traut’s reagent to primary amines (bottom).
Table 1.
Primary physicochemical properties of IONP and Cat-IONP.
| Species | Hydrodynamic size [nm] |
Zeta potential [mV] |
Catalase per IONP |
Catalase activity [U mL‒1] |
|---|---|---|---|---|
| IONP | 27.1 ± 2.0 | ‒7.0 ± 5.6 | N/A | N/A |
| Cat-IONP | 32.5 ± 2.1 | ‒13.7 ± 4.7 | 2 – 3 | 5100 ± 351 |
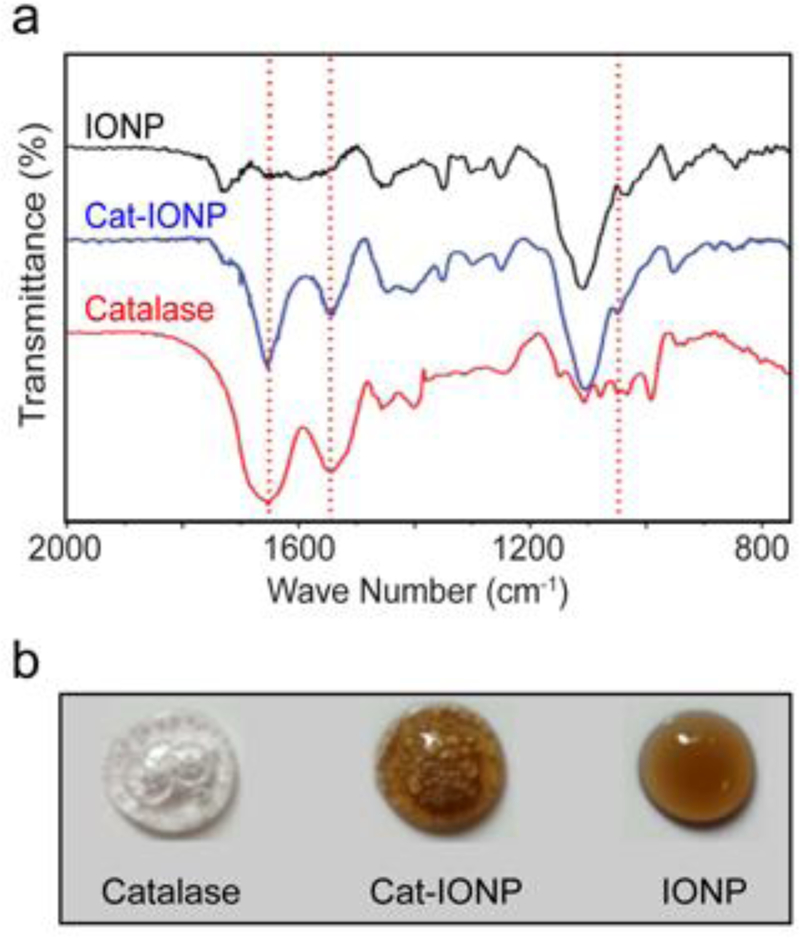
Comparison of the FTIR spectra for IONP, catalase and Cat-IONP indicate successful conjugation of catalase to IONP. (Figure 2a). The most prevalent peaks associated with Cat-IONP were observed at 1147 cm−1, 1544 cm−1, and 1653 cm−1 which corresponds with amide bonds. The characteristic absorption of 1653 cm−1 corresponds to amide I vibration in the protein’s amide-bonded backbone, whereas the 1544 cm−1 corresponds to amide II vibration in the primary structure. The absorption at 1147 cm−1 corresponds to the stretching vibration at C-O found within the side chains of aspartic acid (Asp) and glutamic acid (Glu).[22–24]
Figure 2.
Confirmation of the presence of catalase on Cat-IONP. (a) FTIR spectra of catalase (red), IONP (black) and Cat-IONP (blue). (b) Images of the functional oxygen production drop assay performed on catalase, IONP and Cat-IONP (from left to right) in the presence of hydrogen peroxide.
The Bradford assay was used to quantifying the amount of conjugated catalase on the surface of Cat-IONP (Table 1). Utilizing the molecular weights of catalase (250 kDa) and the 8 nm IONP (6.08 × 10⁵ g mol‒1),[25,26] the amount of catalase conjugated to IONP was calculated to be ~2 –3 catalase molecules per IONP. A functional oxygen production assay was performed by mixing hydrogen peroxide with catalase, Cat-IONP, or IONP, respectively. The catalase concentration for catalase and Cat-IONP samples were normalized and the iron concentration was normalized between IONP and Cat-IONP. Oxygen bubbles were observed in both catalase and Cat-IONP indicating the IONP bound catalase retains its enzymatic function (Figure 2b).
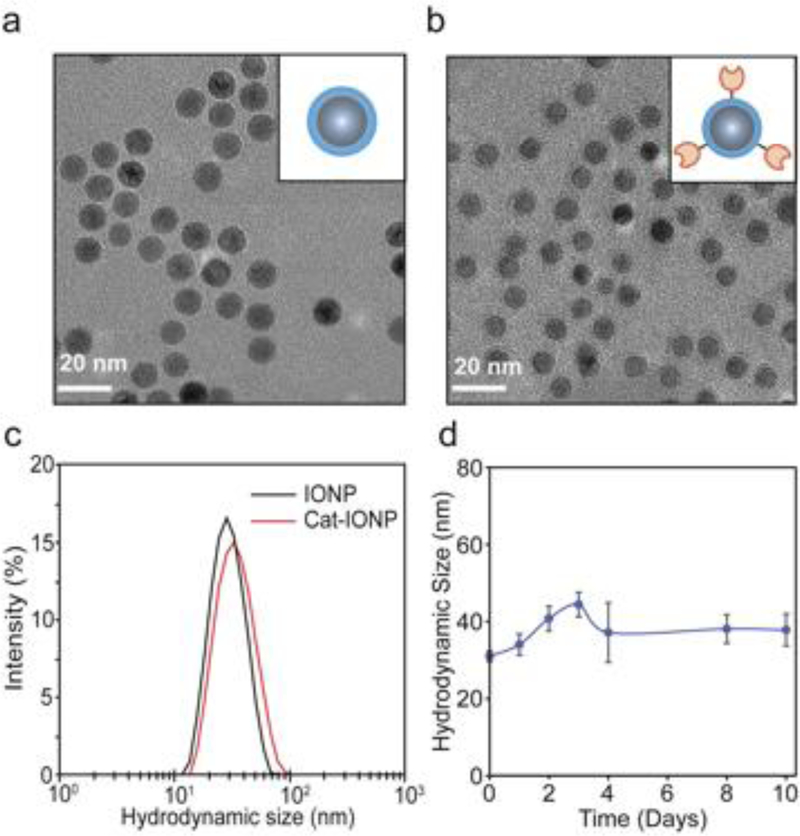
The effects of catalase modification to IONP on core size, hydrodynamic size, and zeta potential were analyzed. The core size of IONP was 8 nm based on analysis of TEM images (Figure 3a). Importantly, Cat-IONP maintains the monodisperse 8 nm core with no indication of aggregation or crosslinking present after addition of catalase (Figure 3b). The hydrodynamic size of IONP and Cat-IONP was 27.1 ± 2.0 nm and 32.5 ± 2.1 nm, respectively (Table 1). Representative intensity-based size distributions of IONP and Cat-IONP is shown in Figure 3c. Cat-IONP was stable over 10 days in biological media containing 10% serum (Figure 3d). The zeta potential of IONP and Cat-IONP was analyzed at pH 7.4 in HEPES buffer (Table 1). Cat-IONP (‒16.9 ± 7.1 mV) had a more negative zeta potential than IONP (‒8.7 ± 4.3 mV) which is expected because catalase is negatively charged at physiological pH.[27] Importantly, the hydrodynamic size and zeta potential of Cat-IONP is within the desired range for in vivo delivery.[28,29]
Figure 3.
Physicochemical characterization of Cat-IONP. (a-b) TEM images of a) IONP and b) Cat-IONP. (c) Hydrodynamic size distributions of IONP and Cat-IONP as determined by DLS. (d) Cat-IONP stability in biological media containing 10% serum.
To evaluate the MRI detectability of this IONP formulation, which demonstrates the potential of the IONP to be monitored by MRI, magnetic relaxivity of IONP was assessed by MRI at 14 T field strength. Figure S1a shows R2 maps of phantoms of IONP as a function of IONP concentration (0–25 μg/mL). Figuure S1b shows the relaxation of IONP as a function of IONP concentration, demonstrating a linear relation of the relaxation bewteen the concentration. The relaxivity (the slope the curve) of the IONP was caculated to be 47.4 sec‒1 mM‒1 (Figure S1, Supporting Information).
2.2. Enzymatic activity of Cat-IONP
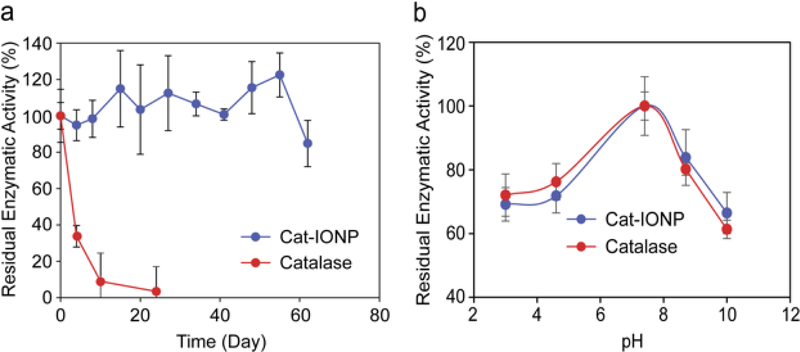
The enzyme activity of Cat-IONP was investigated using the Amplex® Red catalase activity assay kit (Table 1).[30] The catalase activity of Cat-IONP was measured at 5100 ± 351 U mL‒1. The activity of Cat-IONP was comparable to the activity of the unconjugated catalase (5,000 U mL‒1) at the equivalent catalase concentration. Evaluation of residual enzymatic activity of Cat-IONP and free catalase stored at 4 °C and under nitrogen gas showed Cat-IONP maintained enzymatic activity over 60 days while free catalase enzymatic activity was nearly lost by day 24 (Figure 4a). Residual enzymatic activity of Cat-IONP and free catalase over a pH range of 3–10 showed no significant difference in residual enzymatic activity under acidic or basic conditions (Figure 4b). Furthermore, the residual enzymatic activity of Cat-IONP evaluted at pH 6.5, which mimics the pH of the tumor microenvironment, showed that enzyme activity stabilizes at ~85% of the initial activity by 14 days (Figure S2, Supporting Information). These results indicate the activity of catalase is not hindered when conjugated to IONP under physiological conditions and IONP provides increased long-term stability of enzymatic activity.
Figure 4.
Residual enzymatic activity of Cat-IONP and free catalase. (a) Evaluation of residual enzymatic activity over time at pH 7.4. (b) Evaluation of residual enzymatic activity dependence on pH.
2.3. In vitro cellular internalization of Cat-Cy5-IONP in 4T1 cells
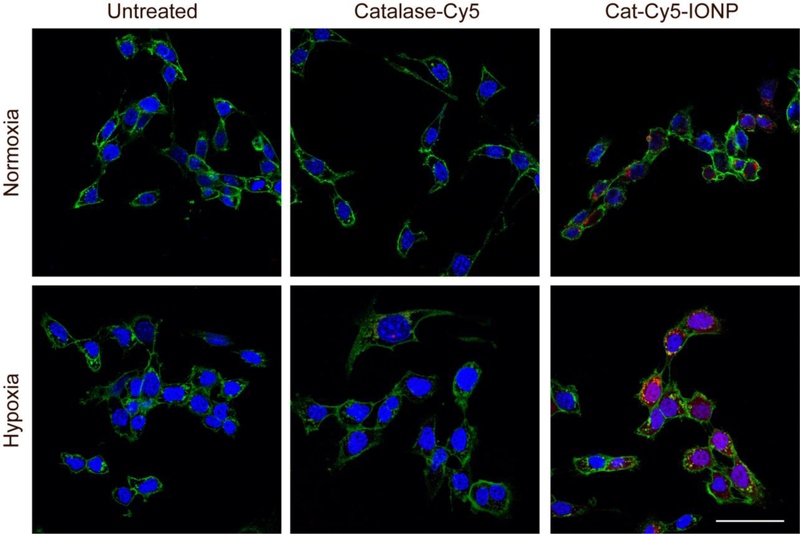
Catalase was modified with Cy5 fluorophore (catalase-Cy5) and subsequently conjugated to IONP (Cat-Cy5-IONP) to evaluate catalase cellular internalization in 4T1 cells under normoxic and hypoxic conditions (Figure 5). Catalase-Cy5 and Cat-Cy5-IONP were administered at a concentration of 33.3 μg mL‒1. Confirmation of Cat-Cy5-IONP internalization was established by confocal microscopy. In all images, cells were fixed after incubation with catalase-Cy5 or Cat-Cy5-IONP and nuclei were stained with DAPI (blue) and cellular membranes with WGA-555 (green). Under both normoxic and hypoxic conditions, Cat-Cy5-IONP exhibits greater internalization than catalase-Cy5 based on increased Cy5 signal (red). The high negative charge of catalase at physiological pH is known to impede cellular internalization of the enzyme.[18,31] The increase in cellular internalization of Cat-IONP over free catalase is likely due to mitigation of catalase’s negative charge by IONP which was shown to have a near neutral zeta potential.
Figure 5.
Confocal fluorescence images of 4T1 cells in normoxic and hypoxic environments treated with catalase-Cy5 or Cat-Cy5-IONP. Cells were incubated under normoxic or hypoxic conditions for 6 hrs prior to a 16 hr incubation with catalase-Cy5 or Cat-Cy5-IONP. Cell nuclei are stained blue, cell membranes are stained green, and catalase-Cy5 and Cat-Cy5-IONP appear red. Scale bar corresponds to 50 μm.
2.4. Evaluation of in vitro HIF1α and HIF2α mRNA expression in Cat-IONP treated 4T1 cells
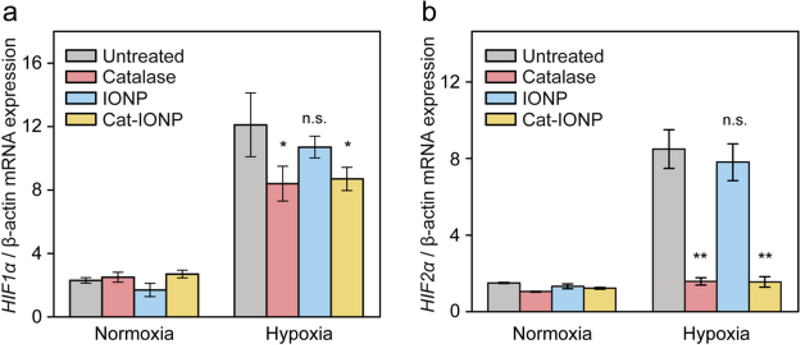
Oxygen-poor environments increase the integrity and stability of HIFs, which in turn causes a cascade of signals that lead to the upregulation of HIF mRNA expression levels via enhanced RNA polymerase II binding to the HIF promoter.[32] Introduction of catalase to convert H2O2 to O2 should lead to degradation of HIF, which in turn leads to downregulation of HIF mRNA expression levels. Our western blot analysis of HIF1α protein expression under normoxia and hypoxia confirmed the knockdown of HIF1α expression with Cat-IONP treatment (Figure S3, Supporting Information). To evaluate the effects of Cat-IONP on HIF mRNA expression, quantitative real-time PCR (qRT-PCR) was performed on extracted RNA samples from breast cancer cell line 4T1 treated with catalase, IONP, Cat-IONP or left untreated in different oxygen levels of environments. The expression levels of HIF1α and HIF2α mRNA in untreated 4T1 cells under hypoxic conditions showed were 5-fold greater than those under normoxic conditions. (Figure 6a). 4T1 cells treated with catalase or Cat-IONP exhibited a significant reduction in the expression of HIF1α mRNA compared to untreated cells under hypoxic conditions (p < 0.05). In addition, 4T1 cells treated with catalase or Cat-IONP showed a greater than 5-fold reduction in the expression of HIF2α mRNA as compared to untreated cells under hypoxic conditions (p < 0.001) (Figure 6b). Despite the relatively low uptake in 4T1 cells compared to Cat-IONP, free catalase showed a reduction in the expression of HIF1α and HIF2α mRNA comparable to Cat-IONP. This can be explained by the presence of aquaporins which rapidly equilibrates ROS across cell membranes.[33,34] The reduction in extracellular ROS by catalase can in turn reduce ROS intracellularly and affect expression of HIF1α and HIF2α mRNA. These results confirm the expression of HIF mRNA in hypoxic conditions can be mediated by the presence of Cat-IONP.
Figure 6.
The effect of Cat-IONP treatment on HIF mRNA expression in 4T1 cell line. (a) HIF1α mRNA expression in 4T1 cultures under hypoxic and normoxic environments. * indicates significant difference between untreated and catalase or Cat-IONP treated groups (p < 0.05). (b) HIF2α mRNA expression in 4T1 cultures under hypoxic and normoxic environments. ** indicates significant difference between untreated and catalase or Cat-IONP groups (p < 0.001).
2.5. Drug-sensitivity of breast cancer cell line 4T1 co-treated with Cat-IONP and chemotherapeutics under hypoxic condition
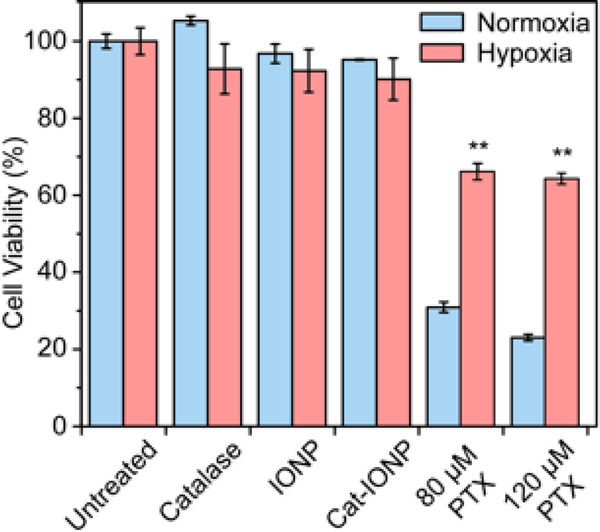
The viability of 4T1 cells under hypoxic and normoxic conditions, treated with IONP, catalase, Cat-IONP, 80 μM PTX or 120 μM PTX was evaluated to assess the toxicity of Cat-IONP and the effects of hypoxia on drug resistance (Figure 7). IONP, catalase, and Cat-IONP showed no overt toxicity under normoxic or hypoxic conditions. Hypoxia was shown to increase cell viability greater than 2-fold for cells treated with 80 μM PTX (p < 0.001) and nearly 3-fold for cells treated with 120 μM PTX (p < 0.001).
Figure 7.
The effects of hypoxia on drug resistance in 4T1 breast cancer cells treated with catalase, IONP and Cat-IONP in hypoxic and normoxic enviromments. PTX at IC50 (80 μM) and 1.5 × IC50 (120 μM) were used for the treatment of 4T1 cell cultures. Cell viability for all cell treatments under normoxia and hypoxia were normalized to untreated cells under normaxia and hypoxia, respectively. **indicates significant difference between hypoxia and normoxia conditions at 80 μM and 120 μM PTX (p < 0.001).
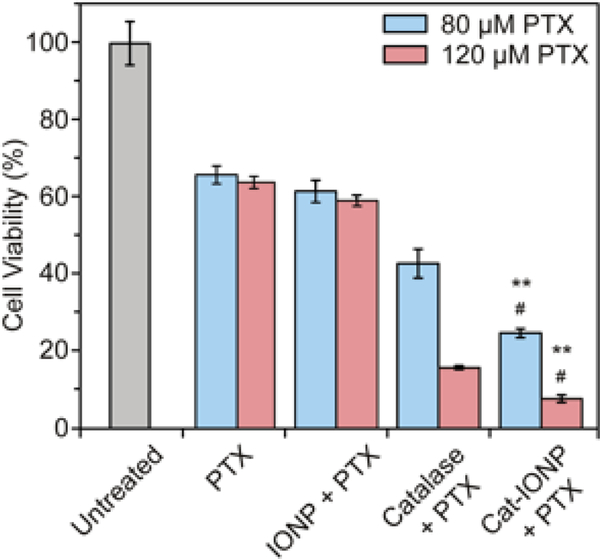
The effects of catalase, and Cat-IONP on MDR when co-treated with PTX under hypoxic conditions was evaluated (Figures 8). Co-treatment with Cat-IONP and 80 μM PTX significantly increased the drug’s efficacy, resulting in a greater than 2-fold decrease in cell viability when compared to cells treated with PTX alone (p < 0.001). The cell viability of Cat-IONP and PTX co-treatment is comparable to the cell viability of the PTX only treatment under normoxia, indicating the Cat-IONP mediated the localized hypoxic environment. Treatment with 120 μM PTX (1.5 × IC50) reduced cell viability greater than 3-fold for catalase treated cells and greater than 5-fold for Cat-IONP treated cells (p < 0.001). The reduction in viability between Catalase + PTX and Cat-IONP + PTX further supports the findings that sensitization of hypoxic cancer cells via catalase activity from Cat-IONP was more effective than catalase alone (p < 0.05). Our data indicates the increased efficacy of co-treatment with Cat-IONP over catalase is likely due to improved stability of catalase after conjugation to IONP and increased cellular internalization.
Figure 8.
The effects of co-treatment of catalase, IONP and Cat-IONP with 80 or 120 μM PTX on cell viability in 4T1 breast cancer cells cultured in hypoxic conditions. ** indicates significant difference between PTX and Cat-IONP + PTX treated conditions, at 80 μM and 120 μM PTX (p < 0.001). # indicates significant differences between catalase + PTX and Cat-IONP + PTX treated conditions, at 80 μM and 120 μM PTX (p < 0.05).
3. Conclusion
Cat-IONP combines the ROS scavenging and oxygen generation of catalase with the imaging capability and multifunctionality of IONP to mitigate the effects of hypoxia. The conjugation of catalase onto the surface of IONP was confirmed by FTIR spectroscopy, and the enzymatic activity of the system was comparable to free catalase. Under hypoxic condition, Cat-IONP maintained enzymatic activity and converted H2O2 to O2. Cat-IONP reduced the expression of HIFs at the translation level in breast cancer cells in vitro, confirming functional catalase activity. The efficacy was further confirmed by the significant decrease in drug-resistant 4T1 cells to PTX under hypoxic conditions, demonstrating viability comparable to that observed in PTX only treatment under normoxic environment. The reduced oxidative stress in hypoxic cell cultures via Cat-IONP catalase activity ultimately leads to 1) ubiquination and degradation of HIF and 2) down regulation of HIF mRNA production. These outcomes contribute to the decreased level of HIF and alter other HIF-regulated genes that may contribute to the MDR characteristic, and the increase in drug sensitivity in hypoxic cells. Thus, Cat-IONP shows promise as a MDR-inhibitor, which could ultimately aid in cancer management and improve overall treatment outcomes.
4. Experimental Section
Materials:
All reagents were purchased from Sigma Aldrich (St. Louis, MO, USA) unless specified otherwise. Catalase with an activity of 20,000 U/mg was utilized. PCR primers used in HIF study were purchased from IDT (Coralville, IA). Primary antibody (H1alpha67) for Western blot was purchased from Abcam (Boston, MA), and the secondary antibody was purchased from BioRad (Hercules, CA).
Preparation of Cat-IONP and Cat-Cy5-IONP:
NP with 8 nm iron oxide core was synthesized as previously described.[35] To synthesize the Cat-IONP, 16 μL of Traut’s reagent solution (1 mg mL‒1) was added into 0.3 mL of 5 mg mL‒1 catalase in PBS with 5 mM EDTA. Concurrently, 1.1 μL SM(PEG)24 was added to 1 mL of 1.5 mg mL‒1 IOSPM, and the mixture was incubated for 30 mins with gentle rocking at room temperature. The SM(PEG)24-NP mixture was purified using PD-10 desalting column (GE Healthcare) equilibrated with deionized water (diH2O), and the collected eluate fraction was mixed with the catalase-Traut’s reaction mixture immediately. The catalase/IONP mixture was reacted under gentle rocking at room temperature for 2 hrs, and purified using a Sephacryl-300 size exclusion column (GE Healthcare) equilibrated with diH2O.
To prepare Cat-Cy5-IONP, 0.5 mL of catalase (10 mg mL‒1) in 100 mM sodium bicarbonate buffer, pH 8.0, containing 5 mM EDTA was reacted with 20 uL of Cy5 fluorophore (10 mg mL‒1) (Lumiprobe, Hunt Valley, MD) in DMSO for 1 hr at room temperature, protected from light and with gentle rocking. Excess Cy5 was removed using a 50k MWCO dialysis membrane (Spectrum, New Brunswick, NJ) using PBS. Cat-Cy5-IONP was prepared as described above for Cat-IONP using catalast-Cy5 in place of free catalase.
Fourier-Transform Infrared Spectroscopy (FTIR):
Catalase, IONP, and Cat-IONP samples were analyzed by FTIR (Perkin-Elmer Spectrum RX1 System, MA). The samples were lyophilized overnight, and ground with potassium bromide (KBr) powder until finely mixed. The ground samples were pressed into pellets and analyzed using FTIR at a resolution of 4 cm−1.
Size and Zeta Potential Characterization:
The hydrodynamic size and zeta potential of IONP and Cat-IONP were analyzed at 100 μg mL‒1 IONP concentration in 20 mM HEPES buffer (pH 7.4) using dynamic light scattering (DLS) Zetasizer Nano (Malvern Instruments, Worcestershire, UK). Serum stability studies were carried out in Dulbecco’s Modified Eagle’s Media supplemented with 10% fetal bovine serum.
TEM Characterization:
TEM images were acquired using an FEI TECNAI F20 TEM (Hillsboro, OR) operating at 200 kV. IONP and Cat-IONP core diameters were analyzed using ImageJ software.
MR Relaxivity of IONP:
R2 relaxivity (1/T2) of IONP was evaluated by MRI using a Bruker (Billerica, MA) 14 T vertical-bore imaging system (Ultrashield 600 WB Plus) through multispin echo acquasitions. Glass vials (3.25 mm I.D., 5 mm O.D., 200 μL volume) were filled with 150 μL of IONP/PBS solution (0, 5, 10, 15, 20, and 25 μg Fe mL‒1). The vials were surrounded by water which serves as a homogenous background signal to minimize magnetic susceptibility variation. The samples were positioned in a 25 mm single-channel 1H radiofrequency recieving coil (PB Micro 2.5) and scanned with a quantitative T2 multi spin multi echo scan sequence. (TR = 2500 ms, TE = 6.7 + 6n ms, [n = 0–16], in-plane resolution 78 × 156 μm2, matrix 256 × 128) with 0.5 mm slice thickness for 14 slices. Analysis was performed with the FMRIB software library (FSL), Paravision 5.1 analysis package (Bruker), Osirix (Pixmeo), and ImageJ (NIH).
Catalase Loading Quantification:
Quantitation of catalase present on Cat-IONP was carried out using Bio-Rad Bradford protein quantification assay. First, 300 μL of Quick Start™ Bradford 1 × reagent was added to each well in the 96-well plates. Meanwhile, standards of bovine serum albumin (BSA) in range of 0‒2.0 μg mL‒1 were prepared. Then, 5 μL of standards, IONPs and Cat-IONPs samples were added into different wells containing the dye agent in duplicates. The plate was then incubated at room temperature for 45 mins, and absorbance was measured at 595 nm. Concentrations of samples were calculated from the standard curve.
Catalase Activity Characterization:
The enzymatic activity of Cat-IONP was determined using an Amplex® Red catalase activity assay kit, following the manufacturer’s protocol (Thermo Fisher Scientific, USA). Briefly, standards of catalase solutions ranging from 0– 1000 m U mL‒1 were prepared. 25 μL of standards and samples were added to a 96-wells plate in triplicate, followed by addition of 25 μL of 40 μM H2O2 to each well. The plate was then incubated in the dark at room temperature for 30 mins, and then 50 μL of 100 μM Amplex Red reagent containing 0.4 U mL‒1 HRP in 1X Reaction Buffer was added to each well containing the standards and samples. The plate was then incubated in the dark at room temperature for 1 hr. The plate was then measured for fluorescence signal using excitation wavelengths in the range of 530– 560 nm and emission wavelengths at 595 nm. The changes in fluorescence intensity were calculated by subtracting the sample (Cat-IONP) values from the values of the no-catalase control (IONP).
To determine the residual catalase enzymatic activity over time, a 1 mg mL‒1 Cat-IONP solution and a 0.25 mg mL‒1 catalase (equivalent activity to Cat-IONP) were diluted 100-fold in PBS and stored at 4 °C after purging with N2. In addition, a 1 mg mL‒1 Cat-IONP solution was diluted 100-fold in 100 mM MES buffer, pH 6.5 and stored at 4 °C after purging with N2, to evaluate the residual enzymatic activity at a pH that mimics the tumor microenvironment. At desired time points, the 100-fold diluted samples were further diluted by 20-fold using DI water prior to Amplex Red Catalase Assay activity measurements.
To determine the residual catalase enzymatic activity dependence on pH, buffered solutions with pH values of 3 (100 mM MES), 4.6 (100 mM MES), 7.4 (PBS), 8.7 (100 mM sodium bicarbonate) and 10 (100 mM sodium bicarbonate) were utilized. 0.25 mg mL‒1 catalase and 1 mg mL‒1 Cat-IONP solutions were diluted 100-fold in each of the buffers. The diluted catalase and Cat-IONP solutions were incubated at room temperature under mild shaking for 30 min and the activity was measured by Amplex Red Catalase Assay.
Confocal Fluorescence Microscopy:
4T1 cells were seeded (1.5 × 10⁵ cells/well) in 6 well plates containing glass coverslips and incubated for 6 hrs under normoxia or hypoxia. Cells were treated with 33.3 μg mL‒1 of Cat-Cy5-IONP or the molar equivalence of catalase-Cy5 for 16 hrs. The cells were washed thrice with cold PBS and fixed with 4% formaldehyde for 15 min and stained with and WGA-555 plasma membrane stain (Invitrogen, Carlsbad, CA). Coverslips were mounted on microscope slides using Prolong Gold Antifade solution (Invitrogen, Carlsbad, CA) containing DAPI nucleus stain. Images were acquired on a LSM 510 Meta confocal fluorescence microscope (Carl Zeiss, Inc., Peabody, MA) with appropriate filters.
Cell Culture:
4T1 mouse breast cancer cells (American Type Culture Collection, Manassas, VA) were cultured in RPMI-1640 supplemented with 10% FBS and 1% antibiotic-antimycotic (Invitrogen, Carlsbad, CA). Normoxic cultures were maintained at 37 °C in a humidified incubator with 5% CO2, while hypoxic cultures were maintained at 37 °C in a humidified incubator with 1% O2 and 5% CO2.
In vitro HIF1α and HIF2α mRNA expressions in normoxic and hypoxic conditions:
HIF1α and HIF2α mRNA expressions in 4T1 cells were investigated under normoxic and hypoxic environments. The 4T1 breast cancer cell line was first cultured in 25 cm2 culture flasks (Thermo Fisher Scientific, NY) in the normoxic environment until the culture confluency reached 70%. For cultures grown under hypoxia, the confluent cultures were transferred into a hypoxic incubator (Thermo Fisher Scientific, NY) and incubated for 6 hrs. Subsequently, the cultures were treated with 33.3 μg mL‒1 IONP or Cat-IONP based on weight of iron content, or 2.67 μg mL‒1 of catalase for 16 hrs, with one culture flask of each cell line left untreated as a control. One hour prior to mRNA extraction, 0.1 mM of demethyloxalylglycine (DMOG) was added to prevent the degradation of HIFs mRNA.[36]
Cellular mRNAs of all cultures were extracted using the Qiagen RNeasy Micro kit (Qiagen, MD), and were quantified using the SpectroDrop Micro-Volume Starter Kit (Molecular Devices, CA). cDNA stocks were then synthesized using the BioRad iScript cDNA Synthesis Kit (BioRad, CA) with a template concentration of 50 ng μL‒1, and quantitative reverse-transcription PCR (qRT-PCR) was carried out with HIF2α-specific primer set using BioRad iQ Sybr Green Supermix Kit (BioRad, CA) with a total template concentration of 0.2 ng μL‒1. qRT-PCR results were analyzed using the CFX Manager software (BioRad). β-actin expression served as the reference gene for this experimental setup. The complete sequences of the primer sets used for this experimental procedure is summarized in Table 2.
Table 2.
Primer sets used for qRT-PCR analysis.
| Primer targets | Forward Primer | Reverse Primer |
|---|---|---|
| Human HIF2-alpha (hHIF2α) | 5’-GTGCTCCCACGGCCTGTA-3′ | 5′-TTGTCACACCTATGGCATATCACA-3′ |
| Human HIF1-alpha (hHIF1α) | 5’-CTATGTAGTTGTGGAAGTTTAT-3’ | 5’-ACTAGGCAATTTTGCTAAGAATGC-3’ |
| Human beta-actin (hACTβ) | 5’-GGTGGCTTTTAGGATGGCAAG-3’ | 5’-ACTGGAACGGTGAAGGTGACAG-3’ |
HIF1α protein expression in normoxia and hypoxia conditions:
HIF1α protein expressions in glioma and breast cancer cell lines were assesed with Western blot. 4T1 breast cancer cells were plated in 6-wells culture plates (Thermo Fisher Scientific, NY) at 1,000,000 cells/well and incubated overnight. Plates that were cultured under hypoxic conditions were transferred to the hypoxia incubator, and incubated for 6 hours. The cells were then treated with 100 μg of IONP or Cat-IONP (equivalent to 8 μg of free Cat), or 8 μg of Cat overnight, with untreated cells of each cell line as control.
The total proteins of cells were extracted using the radioimmunoprecipitation (RIPA) buffer and quantified using Bradford protein quantification assay. The protein samples were then prepared and loaded onto 4–20% Mini-PROTEAN® TGX™ precast gels (BioRad, CA) and SDS-PAGE electrophoresis was perfromed. The gels were then used for Western blot, with mouse anti-HIF1α antibody (H1alpha67, Abcam, MA) as the primary antibody, goat anti-mouse IgG-AP conjugates (BioRad, CA) as secondary antibody, and β-actin as the internal reference. The Immun-Star AP Substrate (BioRad, CA) was used for film development, and the developed film was visualized and analyzed using Quality One (BioRad, CA).
Cell viability assays:
Drug sensitivity of 4T1 cells in hypoxic and normoxic environments was investigated using the Alamar Blue assay. 24-wells plates were seeded with 10,000 4T1 cells/well and incubated overnight in normoxic or hypoxic conditions. Cells were then treated with catalase (2.66 μg mL‒1), IONP (33.3 μg mL‒1), Cat-IONP (33.3 μg mL‒1), or PTX at the LD50 level (80 μM) or 1.5 × LD50 (120 μM). Additionally, co-treatment of PTX at a concentration of 80 and 120 μM with catalase (2.66 μg mL‒1), IONP (33.3 μg mL‒1), or Cat-IONP (33.3 μg mL‒1) was evaluated under hypoxic conditions. The treated cell plates were incubated either in a hypoxic or normoxic incubator for 48 hrs, followed by the Alamar Blue assay to determine the cell viability based on the metabolic levels of the treated cultures.
Statistical analysis:
Results are presented as mean values ± standard deviation from three independent experiments unless otherwise specified. Statistical significance was determined using one-way analysis of variance (ANOVA). All residual enzyme activity was normalized to the initial enzyme activity. All results from cell viability assays were normalized to the untreated treatment group. All treatment groups tested under normoxia or hypoxia were normalized to untreated cells under normoxia, or hypoxia, respectively.
Supplementary Material
Acknowledgment
This work is supported in part by NIH grant R01EB026890 and Kyocera Professor Endowment to M.Z. We acknowledge the use of the equipment on NP characterization in Nanoengineering & Science Institute and Molecular Engineering & Science Institute supported by NSF (grant NNCI-1542101).
Footnotes
Supporting Information
Supporting Information is available from the Wiley Online Library or from the author.
References
- [1].Bar-Zeev M, Livney YD, Assaraf YG, Drug Resist. Updat 2017, 31, 15. [DOI] [PubMed] [Google Scholar]
- [2].Szakacs G, Paterson JK, Ludwig JA, Booth-Genthe C, Gottesman MM, Nat Rev Drug Discov 2006, 5, 219. [DOI] [PubMed] [Google Scholar]
- [3].Choudhry H, Albukhari A, Morotti M, Haider S, Moralli D, Smythies J, Schödel J, Green CM, Camps C, Buffa F, Ratcliffe P, Ragoussis J, Harris AL, Mole DR, Oncogene 2015, 34, 4482. [DOI] [PMC free article] [PubMed] [Google Scholar]
- [4].Eales KL, Hollinshead KER, Tennant DA, Oncogenesis 2016, 5, e190. [DOI] [PMC free article] [PubMed] [Google Scholar]
- [5].Semenza GL, Trends Pharmacol. Sci 2012, 33, 207. [DOI] [PMC free article] [PubMed] [Google Scholar]
- [6].Semenza GL, N. Engl. J. Med 2011, 365, 537. [DOI] [PubMed] [Google Scholar]
- [7].Ratcliffe PJ, J. Physiol 2013, 591, 2027. [DOI] [PMC free article] [PubMed] [Google Scholar]
- [8].Liao D, Johnson RS, Cancer Metastasis Rev. 2007, 26, 281. [DOI] [PubMed] [Google Scholar]
- [9].Lee K, Zhang H, Qian DZ, Rey S, Liu JO, Semenza GL, Proc. Natl. Acad. Sci. U. S. A 2009, 106, 17910. [DOI] [PMC free article] [PubMed] [Google Scholar] [Retracted]
- [10].Wang Y, Liu Y, Malek SN, Zheng P, Liu Y, Cell Stem Cell 2011, 8, 399. [DOI] [PMC free article] [PubMed] [Google Scholar]
- [11].Wong CC-L, Gilkes DM, Zhang H, Chen J, Wei H, Chaturvedi P, Fraley SI, Wong C-M, Khoo U-S, Ng IO-L, Wirtz D, Semenza GL, Proc. Natl. Acad. Sci. U. S. A 2011, 108, 16369. [DOI] [PMC free article] [PubMed] [Google Scholar]
- [12].Zhang H, Gao P, Fukuda R, Kumar G, Krishnamachary B, Zeller KI, Dang CV, Semenza GL, Cancer Cell 2007, 11, 407. [DOI] [PubMed] [Google Scholar]
- [13].Rohwer N, Cramer T, Drug Resist. Updat 2011, 14, 191. [DOI] [PubMed] [Google Scholar]
- [14].Moeller BJ, Richardson RA, Dewhirst MW, Cancer Metastasis Rev. 2007, 26, 241. [DOI] [PubMed] [Google Scholar]
- [15].Semenza GL, Oncogene 2010, 29, 625. [DOI] [PMC free article] [PubMed] [Google Scholar]
- [16].Semenza GL, Biochim. Biophys. Acta - Mol. Cell Res 2016, 1863, 382. [DOI] [PMC free article] [PubMed] [Google Scholar]
- [17].Sabharwal SS, Schumacker PT, Nat. Rev. Cancer 2014, 14, 709. [DOI] [PMC free article] [PubMed] [Google Scholar]
- [18].Jaffer H, Morris VB, Stewart D, Labhasetwar V, Drug Deliv. Transl. Res 2011, 1, 409. [DOI] [PMC free article] [PubMed] [Google Scholar]
- [19].Saso L, Firuzi O, Curr. Drug Targets 2014, 15, 1177. [DOI] [PubMed] [Google Scholar]
- [20].BARRY JN, VERTEGEL AA, Nano Life 2013, 3. [DOI] [PMC free article] [PubMed] [Google Scholar]
- [21].Tang R, Kim CS, Solfiell DJ, Rana S, Mout R, Velázquez-Delgado EM, Chompoosor A, Jeong Y, Yan B, Zhu Z-J, Kim C, Hardy JA, Rotello VM, ACS Nano 2013, 7, 6667. [DOI] [PMC free article] [PubMed] [Google Scholar]
- [22].Barth A, Biochim. Biophys. Acta - Bioenerg 2007, 1767, 1073. [DOI] [PubMed] [Google Scholar]
- [23].Rathod PI, 2013, 272.
- [24].Siebert F, Methods Enzymol. 1995, 246, 501. [DOI] [PubMed] [Google Scholar]
- [25].Schroder W a., Shelton JR, Shelton JB, Olson BM, Biochim. Biophys. Acta 1964, 89, 47. [DOI] [PubMed] [Google Scholar]
- [26].Costa SA, Tzanov T, Carneiro Filipa A., Paar A, Gübitz GM, Cavaco-Paulo A, Enzyme Microb. Technol 2002, 30, 387. [DOI] [PubMed] [Google Scholar]
- [27].Lin F, Yu S, Gu L, Zhu X, Wang J, Zhu H, Lu Y, Wang Y, Deng Y, Geng L, Microchim. Acta 2015, 182, 2321. [Google Scholar]
- [28].Longmire M, Choyke PL, Kobayashi H, Nanomedicine 2008, 3, 703. [DOI] [PMC free article] [PubMed] [Google Scholar]
- [29].Kim B, Han G, Toley BJ, Kim CK, Rotello VM, Forbes NS, Nat Nanotechnol 2010, 5, 465. [DOI] [PMC free article] [PubMed] [Google Scholar]
- [30].Mohanty JG, Jaffe JS, Schulman ES, Raible DG, J. Immunol. Methods 1997, 202, 133. [DOI] [PubMed] [Google Scholar]
- [31].Francis JW, Hosler BA, Brown RH, Fishman PS, J. Biol. Chem 1995, 270, 15434. [DOI] [PubMed] [Google Scholar]
- [32].Li Z, Bao S, Wu Q, Wang H, Eyler C, Sathornsumetee S, Shi Q, Cao Y, Lathia J, McLendon RE, Hjelmeland AB, Rich JN, Cancer Cell 2009, 15, 501. [DOI] [PMC free article] [PubMed] [Google Scholar]
- [33].Bienert GP, Møller ALB, Kristiansen KA, Schulz A, Møller IM, Schjoerring JK, Jahn TP, J. Biol. Chem 2007, 282, 1183. [DOI] [PubMed] [Google Scholar]
- [34].Stuart JA, Fonseca J, Moradi F, Cunningham C, Seliman B, Worsfold CR, Dolan S, Abando J, Maddalena LA, Oxid. Med. Cell. Longev 2018, 2018, 8238459. [DOI] [PMC free article] [PubMed] [Google Scholar]
- [35].Fang C, Bhattarai N, Sun C, Zhang M, Small 2009, 5, 1637. [DOI] [PMC free article] [PubMed] [Google Scholar]
- [36].Jaakkola P, Mole DR, Tian Y, Wilson MI, Gielbert J, Gaskell SJ, Von Kriegsheim A, Hebestreit HF, Mukherji M, Schofield CJ, Maxwell PH, Pugh CW, Ratcliffe PJ, Jaakkola P, Mole DR, Tian Y, Wilson MI, Gielbert J, Gaskell SJ, Von Kriegsheim A, Hebestreit HF, Maxwell PH, Pugh CW, 2017. [DOI] [PubMed]
Associated Data
This section collects any data citations, data availability statements, or supplementary materials included in this article.


