Abstract
We describe a new fluorescence method that allows the resolution of both the decay times and emission spectra of mixtures of fluorophores. This method is completely general and does not require any assumptions or knowledge of the decay times, or emission spectra of the individual fluorophores. We use the phase angle spectra and modulation spectra of the mixture, measured over a range of suitable light modulation frequencies and emission wavelengths. These data are analyzed by nonlinear least-squares analysis to recover the emission spectra and the associated decay times. The principle of the method and the nature of the data are Illustrated by using two-component mixtures with Increasing spectral overlap. We then demonstrate the recovery of minor components, of structure emission spectra, and of a three-component mixture with completed overlapping emission spectra. And finally, we describe the resolution of a two-component mixture with decay times of 0.8 and 1.4 ns using modulation frequencies up to 774 MHz.
INTRODUCTION
Fluorescence spectroscopy is a widely used methodology in biochemical research (1–5), in chemical analysis (6) and in clinical research (7, 8). Until recently the analytical applications fluorescence were limited to the use of the steady-state intensities, this being the result of the complex and/or expensive instrumentation required for time-resolved measurements. However, there are many advantages in the use of time-dependent fluorescence data. The emission spectra of most fluorophores are broad, unstructured, unusually overlap on the wavelength scale. In such cases the decay times of the fluorophores are often distinct and can provide the basis for resolution of the individual components. Additionally, fluorescence decay times are largely independent of the total fluorophore concentration and/or signal intensity. Consequently, decay times can be accurately determined in absorbing and/or scattering media such as cell cultures, body fluids or tissues. Consequently, time-resolved measurements can be accomplished for complex samples, whose optical properties preclude the use of the steady-state intensities.
There are two dominant methods of obtaining time-dependent data. These are the time-domain (TD) methods, most commonly time-correlated single-photon counting (9, 10), and the frequency-domain (FD) method (11, 12). In the latter FD method the more familiar pulsed excitation is replaced with an intensity modulated light source. The measured values are the phase lag and modulation of the emission, relative to the incident light, measured over a range of modulation frequencies. The frequency-domain method is now widely used in chemical and biochemical research (13–16). The FD measurements provide resolution of mixtures of fluorophores (17,18), excited-state reactions (19,20), solvent relaxation (21, 22), time-dependent anisotropy decays (23–26), lifetime dis tributions (27–29), distance distributions (30,31) and transient effects in diffusive quenching (32,33). These advanced applications have been made possible by the development of the frequency-domain instruments, which allow measurement over a wide range of modulation frequencies (11,12,34). However, comparatively little effort has been directed toward the use of these modern instruments to recover the emission spectra and decay times of components present in mixtures of fluorophores.
Prior to the introduction of the variable-frequency FD instruments, the only available phase-modulation fluorometers operated at one to three fixed modulation frequencies. Weber devised an analytical solution to obtain the decay times of N components from data measured at N frequencies (35,36). This method appears to be unstable (37, 38) and sensitive to the small systematic errors which were present in data obtained from the fixed-frequency instruments (38–40). This method has not been used to recover the emission spectra of the components.
The usefulness of the fixed-frequency instruments for the resolution of emission spectra was enhanced by the use of phase-sensitive detection (41,42). This method was described initially by Vesolova and co-workers for the resolution of a two-component mixture of fluorophores (43) and was later used for the resolution of fluorescence and phosphorescence (44). This method was made considerably simpler by performing the phase-sensitive detection on the low-frequency cross-correlation signals (41,42). Following this innovation there was rapid development of this method in a number of laboratories. The method was used for suppression of background fluorescence in Raman spectroscopy (45, 46), for studies of ligand binding to macromolecules (47,48), and for resolution of mixtures with more than two components (49, 50). The method was also modified to allow decomposition of the emission spectra using known decay times (51) or to allow recovery of the decay times and fraction intensities of the components using the known shapes for the emission spectra (52, 53).
While the phase-sensitive methods described above have found some utility, they are all limited by the need to know either the emission spectrum or the decay times of the individual fluorophores. This is because the measurements are performed at a single modulation frequency, which does not provide adequate information content to recover both the decay times and the spectral shapes. Additionally, the phase-sensitive intensities are stationary values that do not reveal the phase angle or modulation of the emission, unless the data are measured over a range of detector phase angles. Even then the data at a single modulation frequency reveal only a single weighted phase angle for the total emission, which is not adequate to recover both the phase angles and the relative intensities of the components in the mixture. Hence, measurement of the phase-sensitive intensity results in loss of the phase and modulation information, which must then be recovered by multiple measurements at various detector phase angles. Additionally, recovery of the modulation information requires the assumption that each component displays a single exponential decay and that there are no excited-state reactions. And finally, the method of phase suppression to record the individual emission spectra is only possible for two-component mixtures because only one emission can be suppressed in a single phase-sensitive emission spectrum.
The limitations described above can be circumvented to modern phase fluorometers which allow measurements over a wide range of modulation frequencies. In the present report we describe an extension of the frequency-domain method to provide resolution of both the emission spectra and the decay times of the individual fluorophores, without any assumptions about the spectra shapes, fractional contributions, decay times, or phase angles. In this method we scan the emission wavelength while simultaneously recording wavelength-dependent phase angle and modulation. The phase angle and modulation spectra (PM Spec) are recorded over an appropriate range of modulation frequencies. Nonlinear least-squares analysis yields the individual emission spectra and the decay times of each component in the mixture. To demonstrate the resolution available using this method, we report the resolution of three completely overlapping emission spectra for fluorophores with only a 3-fold range of decay times (3.7–11.7 ns). Additionally, we describe the resolution of two structured emission spectra for fluorophores with decay times of 0.8 and 1.4 ns. These results demonstrate that PM Spec is a powerful method for the resolution of multicomponent mixtures of fluorophores.
THEORY
Time and Frequency Domain Expressions.
The sample is assumed to consist of a mixture of fluorophores, each of which displays a single exponential decay time. The time-dependent emission of each wavelength (λ) is then a multiexponential decay
| (1) |
where the preexponential factors (αi(λ)) depend on emission wavelength. The decay times (τi) are assumed to be characteristic of each component in the mixture and to be independent of wavelength for each component. At each emission wavelength the fractional intensity of each component is given by
| (2) |
The fractional contribution of each component to the total emission is given by
| (3) |
where N is the number of emission wavelengths.
The frequency-domain data consist of phase (ϕωλ) and modulation (mωλ) values, each measured over a range light of modulation frequencies (ω) and emission wavelengths (λ). For a multiexponential decay these values are given by
| (4) |
| (5) |
where
| (6) |
| (7) |
and
The data consist of multiple sets of phase and modulation spectra, each measured at a single modulation frequency. These data sets are fit by using nonlinear least squares (54). The goodness-of-fit is given by
| (8) |
where c indicates the values calculated for the assumed parameter values (τi and αi(λ)) and v is the number of degrees of freedom. In our analysis the decay times (τi) and amplitudes (αi(λ)) are floating parameters, with the restriction that Σiαi(λ) = 1.0. At the beginning of the analysis the values of αi(λ) are set equal to 0.5 for a two-component mixture and 0.33 for a three-component mixture. The weighting factors (δϕωλ and δmωλ) are given by the actual standard deviations found for each measurement, typically after 10–30 individual measurements at a single wavelength and modulation frequency. The values (δϕωλ and δmωλ) are written to the same data file which contains the phase and modulation data.
Emission Spectra of Components.
The emission spectrum of each component (Ii(λ)) is calculated from its fractional intensity at each wavelength (fi(λ) from eq 2) and the steady-state emission spectrum (Iss(λ)) of the sample
| (9) |
Apparent Decay Times.
Irrespective of the complexity of the decay at each wavelength, it is possible to interpret the phase and modulation values in terms of apparent decay times
| (10) |
| (11) |
While this can be a useful representation of the data, it should be remembered that these are only apparent values, which are the result of a complex frequency-dependent weighing of the individual decay times. Furthermore, it is these weighted values that define the data measured at a single modulation value. There is no general method to recover the component decay times (τi (λ)) and amplitudes (αi(λ)) from these limited data and ). These apparent values have been used occasionally to fit the data in terms of the multiexponential model (40,55). While this approach, when used with caution, may yield acceptable results, the fitting to apparent lifetimes should be discouraged. Constant errors in ϕω, or mω do not translate linearly into errors in Tϕ and τm. Hence, it is difficult to even approximately estimate the uncertainties, which is necessary for the least-squares analysis. Importantly, the single frequency measurements do not contain adequate information to recover multiexponential decay parameters.
EXPERIMENTAL SECTION
Phase and modulation spectra were obtained by using the frequency-domain fluorometer described previously (12,34), with the data acquisition being controlled by a DEC Minc 11/23. An emission monochromator with automatic scanning was added to obtain the wavelength-dependent data. At each modulation frequency we first measured the phase and modulation of the reference, which was typically scattered light from a Ludox suspension at the excitation wavelength. This instrument, when used with the microchannel plate detector, displays no measurable wavelength dependence and hence it was not necessary to use reference fluorophores (39). The emission wavelength is then scanned, with continuous recording of the phase and modulation values. The emission bandwidth was 8 nm. At each wavelength we typically measure 10 to 30 phase and modulation values. Additionally, we record the standard deviations of these values (δϕωτ and δmωλ), which are used for weighing the data during least-squares analysis (eq 8). After completion of the scan, the reference is again measured, and the scan accepted or rejected based on the stability of the reference values. For measurements performed with the R928 squirrel-cage photomultiplier tube (PMT), we occasionally recorded phase and modulation spectra using lifetime standards, followed by appropriate correction for the decay time of the standard.
The light source and method of obtaining modulated light was varied to suit the absorption spectra and decay times of the fluorophore. For mixtures containing acriflavin (ACF), acridine orange (AO), 3-aminofluoranthene (AFA) and 7-(benzyl-amino)-4-nitrobenz-2-oxa-1,3-diazole (BBD), we used the 442-nm line from a HeCd laser. The intensity was modulated by using a Lasermetrics 1024 electrooptic modulator (12), and the emission was detected with an internally crowcorrelated Hamamatsu R928 PMT (12). For mixtures containing perylene (Per) and 9-aminoacridine (9-AA), we used the harmonic content of a pyri-dine-2 dye laser, frequency doubled to 375 nm. For diphenyloxazole (PPO) and p-quaterphenyl (p-QP) we used the output of a R6G dye laser, frequency-doubled to 300 nm. Both dye lasers were cavity-dumped at 3.79 MHz and were synchronously pumped with a mode-locked argon ion laser. For these measurements the detector was an externally cross-correlated R1564 microchannel plate PMT, also from Hamamatsu (34). Magic angle polarizer orientations were used to avoid the effects of Brownian rotation.
For comparative purposes the decay times of the individual compounds and the mixtures were also recovered from the more usual frequency-domain (FD) method (17,18). In this case the phase and modulation of the sample were measured using wideband emission filters over a range of modulation frequencies, followed by least-squares analysis as described previously Solutions in ethanol or cyclohexane were purged with N2 to remove dissolved oxygen. Propylene glycol solutions were not purged. The total optical density in the longest absorption band was near 0.1.
RESULTS
Partially Overlapping Two-Component Mixture.
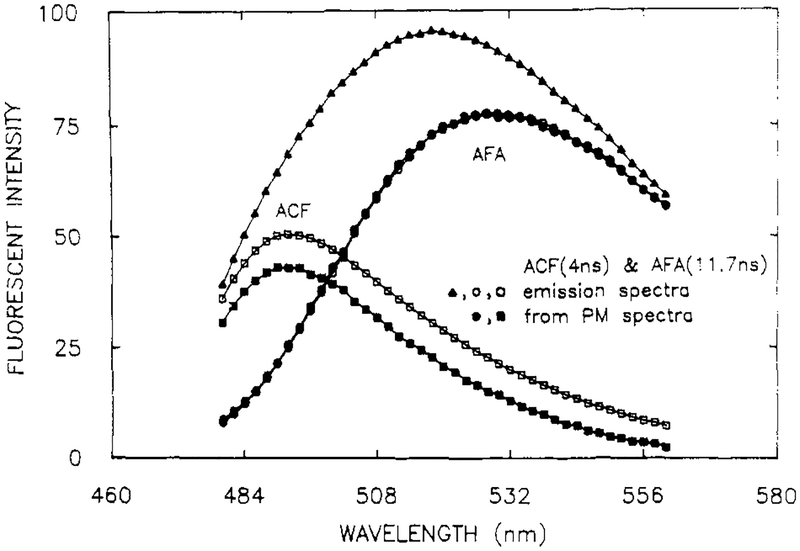
The nature of the phase and modulation spectra is best illustrated for a mixture of fluorophores with incomplete spectral overlap and a large difference in the decay times. Partial overlap of the emission spectra allows one to visualize the contributions of each component on the sides of the emission from the mixture. These conditions were satisfied using a mixture of acriflavin (ACF) and 3-minofluoranthen (AFA), which display decay times of 4.0 and 11.7 ns, respectively. The ACF (□) emission is centered near 490 nm and that of AFA (○) near 530 nm (Figure 1). Also shown is the emission spectrum of the mixture (▲) which contains equivalent amounts of each of the single-component solutions.
Figure 1.
Emission spectra and recovered spectra from a mixture of ACF and AFA in propylene glycol at 20 °C. Emission spectra are shown for the mixture (▲), of the individual components (□, ○), and recovered from the phase-modulation spectra (∎, ●). [ACF] = 5 × 10⁻⁷ M, [AFA] = 2 × 10⁻⁵M.
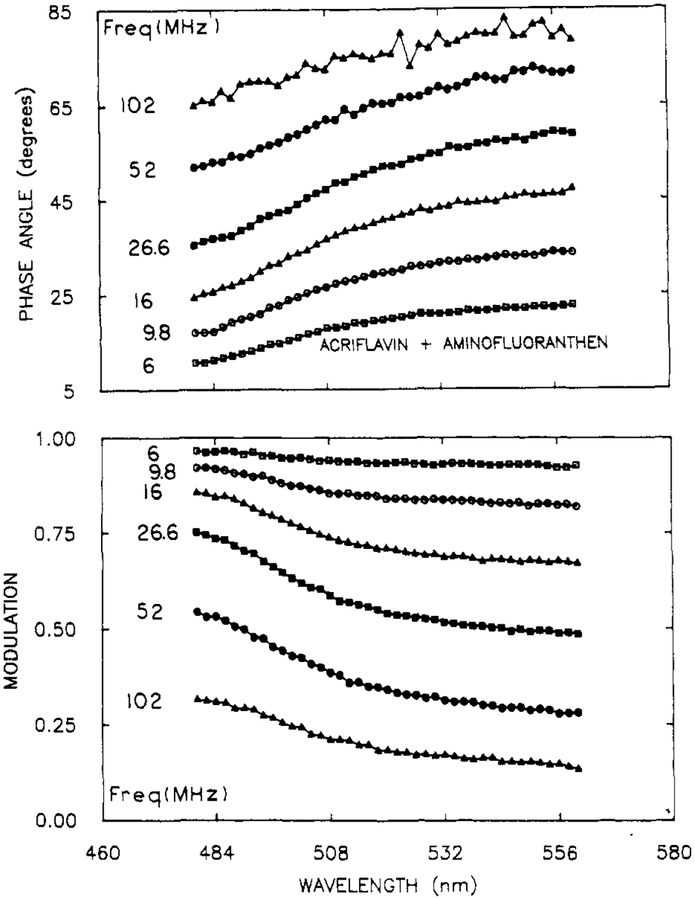
Phase angle and modulation spectra at representative frequencies are shown in Figure 2. The phase angles increase and the modulation decreases with increasing emission wavelength. This is due to the longer decay time of the AFA whose emission becomes more dominant at longer emission wavelengths. The wavelength-dependence of ϕω(λ) and mω(λ)is monotonic because the fractional contribution of AFA to the emission increases monotonically with increasing wavelength. The increased uncertainty in the phase angles at 102 MHz is due to the lower amplitude of the modulated emission.
Figure 2.
Representative phase angle (top) and modulation spectra (bottom) for a mixture of ACE and AFA. The complete data set consisted of PM Spec at 20 modulation frequencies.
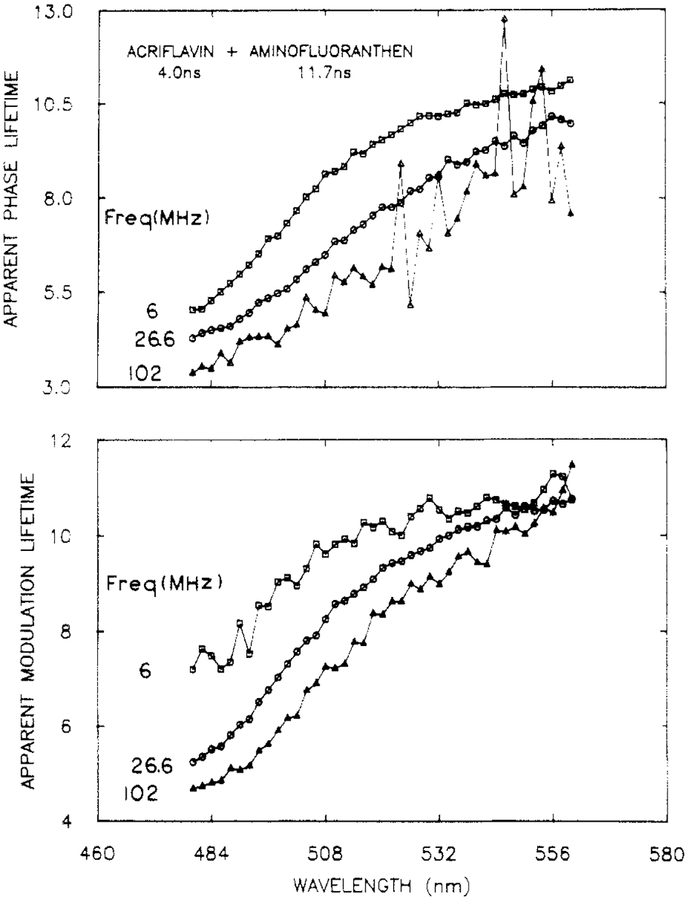
It is also possible to present the data in terms of the apparent phase and modulation lifetimes (eqs 10 and 11). The apparent lifetimes increase with increasing emission wavelength (Figure 3). At high frequencies the apparent phase lifetimes display considerable uncertainty, which illustrates how uncertainties in the phase angles can be amplified when presented in terms of apparent phase lifetimes. Additionally, there are greater uncertainties in the apparent modulation lifetimes at 6 MHz, which is the result of the small amount of demodulation at this frequency. While such a presentation of the data is informative with regard to the time scale of the emission, it should be recalled that these values are interpretations of the experimentally measured values. For this reason we prefer the direct presentation of the phase and modulation spectra (Figure 2). It should be noted that the apparent decay times show τm > τϕ, as is expected for a multiexponential decay with positive preexponential factors (56, 57).
Figure 3.
Apparent phase (top) and modulation (bottom) lifetimes for a mixture of ACF and AFA.
The decay times and amplitudes recovered for the pure compounds and for this mixture are summarized in Table I. We recovered essentially the same decay times from ACF and AFA from the PM Spec analysis and from the more common frequency-domain measurements. Also, there is no decrease in χR2 when the PM Spec of each pure compound are analyzed using the two-component model, as is illustrated for the attempted two-component analysis of AFA (Table I). This is an important result because it indicates that the PM Spec data do not contain systematic errors which result in the apparent presence of a second component.
Table I.
Decay Times and Amplitudes for ACF, AFA, and AO, and for Two-Component Mixtures of ACF, AFA, and AO
| τ1, ns | F1 | χR2 | ||||
|---|---|---|---|---|---|---|
| sample | expecteda | found | expectedb | found | FD | PM Spec |
| ACF | 3.95 | 3.98 | 1.0 | 1.0 | 0.3 | 0.6 |
| AFA | 11.72 | 12.04 | 1.0 | 1.0 | 0.5 | 0.8 |
| AO | 3.69c | 3.73 | 1.0 | 1.0 | 0.1 | 1.2 |
| ACF & AFAe | 8.98d | 8.47 | 1.0 | 1.0 | 46.7 | 79.3 |
| 3.95 | 3.79 | 0.32 | 0.31 | 0.5 | ||
| 11.72 | 11.19 | 0.68 | 0.69 | |||
| AO & AFAf | 7.29c,d | 7.34 | 1.0 | 1.0 | 23.1 | 29.9 |
| 3.69 | 3.90 | 0.41 | 0.38 | 1.6 | ||
| 11.72 | 12.35 | 0.59 | 0.62 | |||
The lifetime values are the results from the usual FD measurements, where the emission is observed through a band-pass filter (Corning 3–71).
The fractional intensity values are the results from steady-state measurements.
The FD measurements were performed with an emission wavelength of 522 nm.
The results of the forced single exponential fits are not necessarily the same for the FD and PM Spec data.
[ACF] = 5 × 10⁻⁷ M and [AFA] = 2 × 10⁻⁵ M.
[AO] = 1.25 × 10⁻⁶ M and [AFA] = 2 × 10⁻⁵ M.
It should be emphasized that the recovered emission spectra and amplitudes are in agreement with the known emission spectra of the pure components and the known composition of the mixture (Figure 1). It is also important to note that the value of χR2 decreases 230-fold for the two-component analysis. Such a large decrease in χR2 implies certainty in the presence of at least two components in the mixture.
Strongly Overlapping Two-Component Mixture.
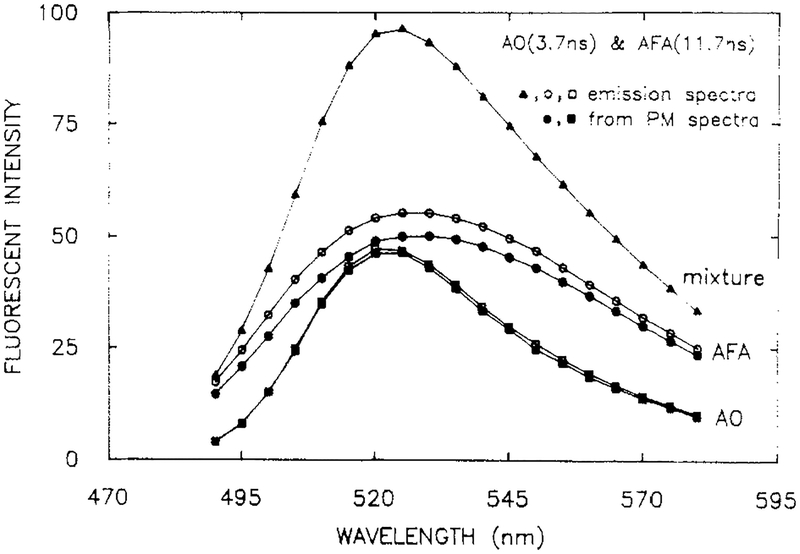
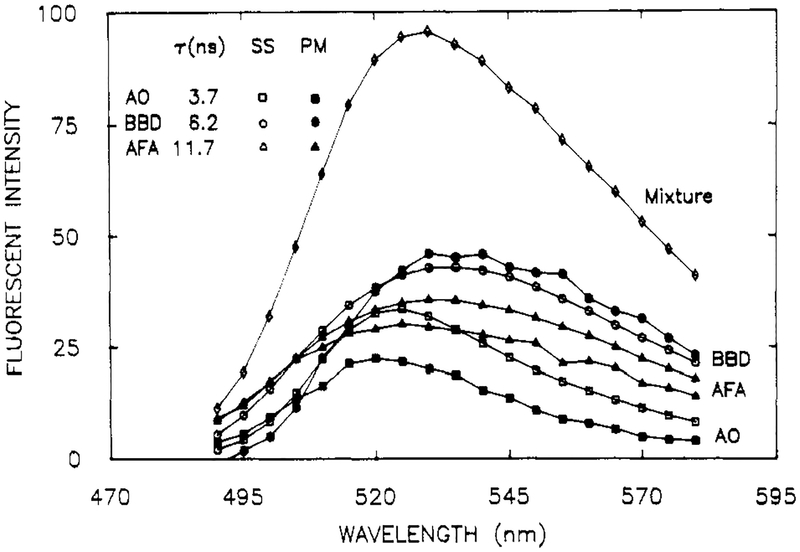
We next examined a mixture with similar decay times, but one with the completely overlapping emission spectra. Such a sample is more difficult to resolve because the two components contribute more equally at all emission wavelengths, which results in more redundancy in the data. Overlapping emission spectra were obtained by using acridine orange (AO, 3.7 ns) and AFA (11.7 ns), both of which display emission maximum near 52C-530 nm (Figure 4). The emission spectrum of AFA is more broadly distributed on the wavelength scale than is the spectrum of AO, so that the longer decay time is expected to be most evident on the blue and red sides of the emission.
Figure 4.
Emission spectra and recovered spectra from a mixture of AO (O) and AFA (□), in propylene glycol at 20 °C. Emission spectra are shown for the mixture (▲), the individual components (□. ○) and recovered from the phase-modulation spectra (∎, ●). [AO] = 1.25 × 10⁻⁷ M, [AFA] = 2 × 10⁻⁵ M.
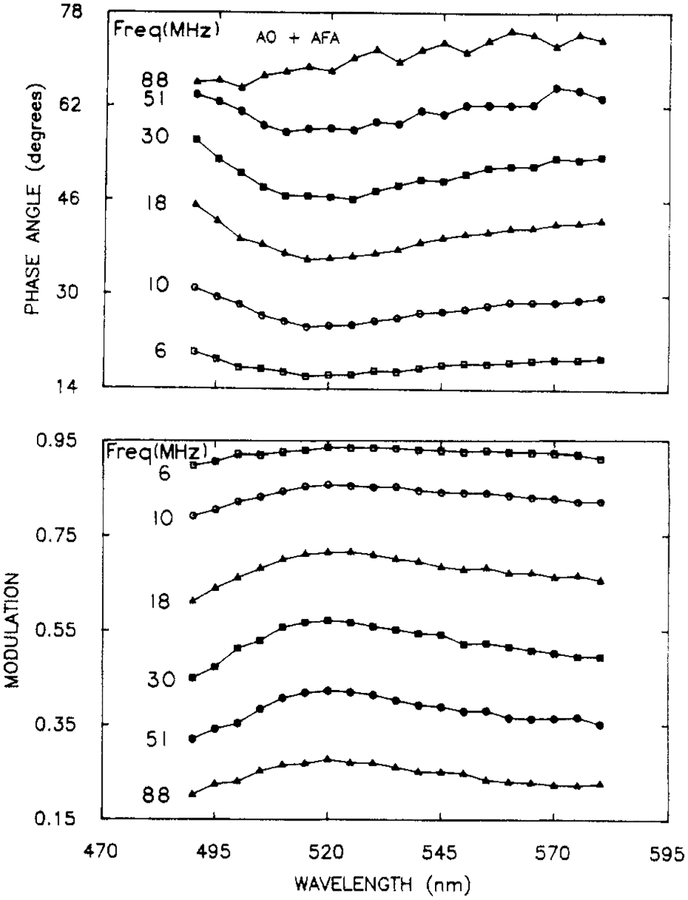
The phase modulation spectra for the AO-AFA mixture are shown in Figure 5. The phase angles display a minimum, and the modulation a maximum, in the central region of the spectra. This effect is due to the higher contribution of AO (with its shorter decay time) in the central region of the emission. The spectra profiles and amplitudes (Figure 4) recovered from the data (■, ●) were found to be in precise which contained a single component (□,○). The decay times (Table I) were also in agreement with the expected values (expected for AO and AFA, 3.69 and 11.72; found, 3.90 and 12.35 ns). These results demonstrate that even complete spectral overlap does not have a significant effect on the ability to recover the spectral parameters. However, it is important to recognize that the components could not be resolved if the decay times were identical, even if the emission spectra were distinct. This is because resolution of the decay times and spectra depends on a difference in the decay times. From this perspective it would be challenging to resolve a mixture of AO and ACF, where the decay times are 3.69 and 3.95 ns, respectively.
Figure 5.
Phase angle (top) and modulation spectra (bottom) for a mixture of AO and AFA.
Three Overlapping Components.
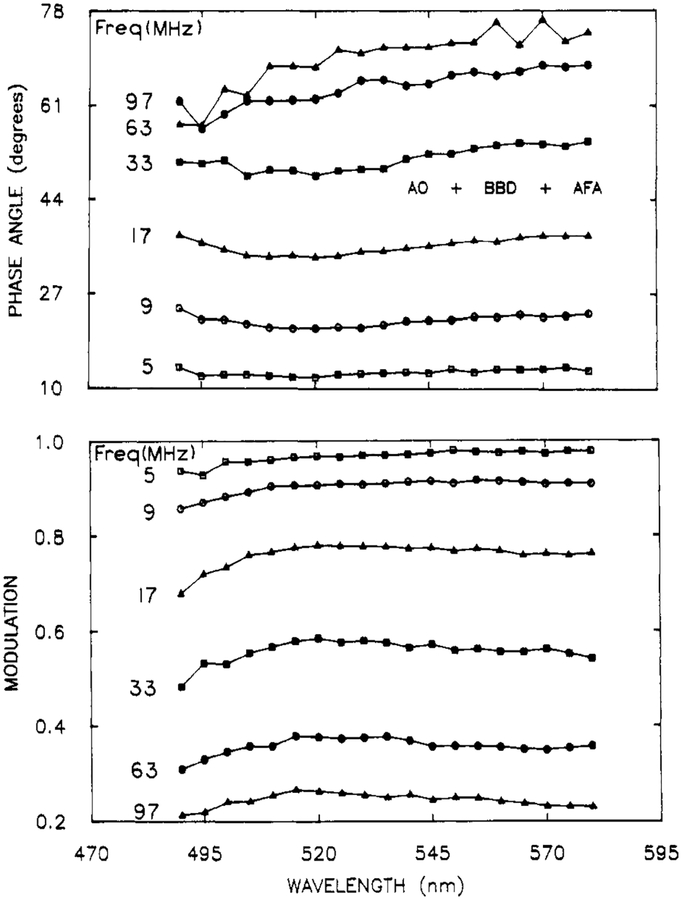
To further evaluate the resolution obtainable using the phase-modulation spectra, we examined a mixture of three fluorophores whose emission spectra overlap completely and with a total lifetimes range of only 3-fold. The emission spectra of these components (AO, 3.7 ns; BBD, 6.2 ns; and ACF, 11.7 ns) are shown in Figure 6. The phase and modulation spectra (Figure 7) show little detail.
Figure 6.
Emission spectra of a mixture (◇) of AO, AFA, and BBD, in propylene glycol at 20 °C. Also shown are the spectra of the individual components, AO (□), AFA (△), and BBD (○), and the spectra recovered from the phase-modulation spectra (solids). [AO] = 6 × 10⁻⁷ M, [BBD] = 1.3 × 10⁻⁶ M, and [AFA] = 2 × 10⁻⁵ M.
Figure 7.
Representative phase-modulation spectra for a mixture of AO, AFA, and BBD. The complete data set consisted of PM Spec at 20 modulation frequencies.
The spectra recovered from the mixture are shown in Figure 6. In spite of the complexity of this mixture, the emission spectra and amplitudes were recovered with reasonable precision. Additionally the decay times and total amplitudes (Fi) are in good agreement with the expected values (Table II). We note that this mixture was also difficult to resolve by the FD method. In fact, it was necessary to fix one of the decay times to obtain a reliable minimization (Table II). These results demonstrate that even three strongly overlapping spectra and closely spaced decay times can be recovered by using our method.
Table II.
Decay Times and Amplitudes for a Three-Component Mixture of AO, BBD, and AFA and for the Individual Compounds
| τi, ns | Fi | χR2 | ||||
|---|---|---|---|---|---|---|
| sample | expected | found | expected | found | FD | PM Spec |
| AO | 3.69 (0.01)a | 3.73 | 1.0 | 1.0 | 0.1 | 1.2 |
| BBD | 6.15 (0.04) | 6.08 | 1.0 | 1.0 | 0.6 | 1.9 |
| AFA | 11.75 (0.4) | 12.04 | 1.0 | 1.0 | 0.2 | 0.8 |
| AO + BBD + AFAe | 6.76c | 6.08b | 1.0 | 1.0 | 56.2 | 5.0 |
| (3.5)d | 3.05 (0.2)b | 0.23 | 0.19 | 0.5 | 0.6 | |
| 7.9 (1.2) | 6.58 (0.5) | 0.40 | 0.45 | |||
| 12.7 (3.8) | 10.78 (0.7) | 0.37 | 0.36 | |||
Estimated uncertainty in the recovered values (54).
The number of decay times in an entry indicates the number of decay times used in the analysis.
The results of the forced single exponential fits are not necessarily the same for the FD and for the PM Spec data.
It was necessary to fix this decay time to obtain a stable solution. The emission was observed through a Corning 3–71 filter.
[AO] = 6 × 10⁻⁷ M, [BBD] = 1.3 × 10⁻⁶ M, and [AFA] = 2 × 10⁻⁵ M.
Structured Emission Spectra and Minor Components.
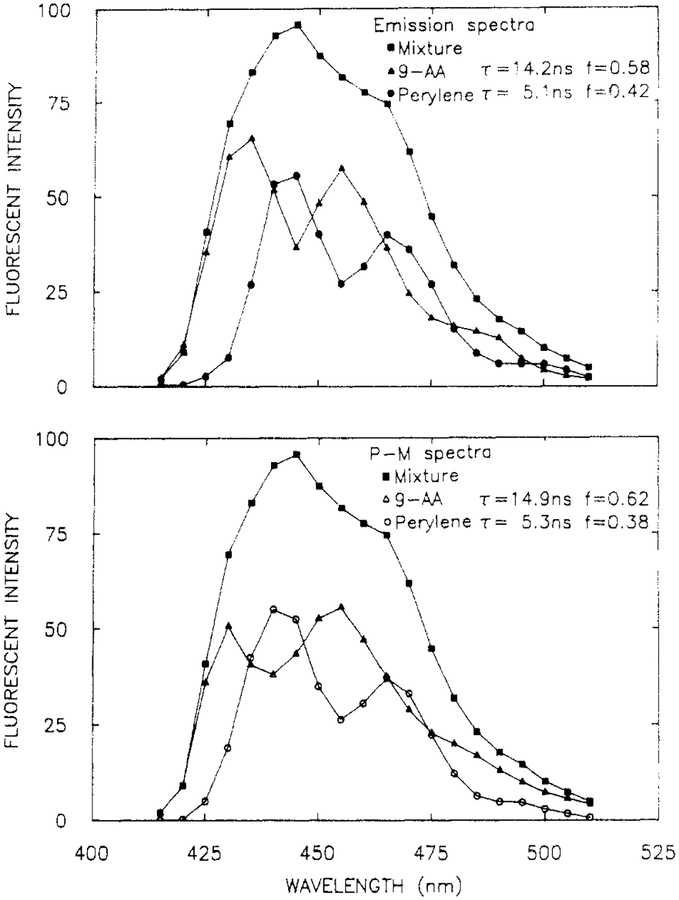
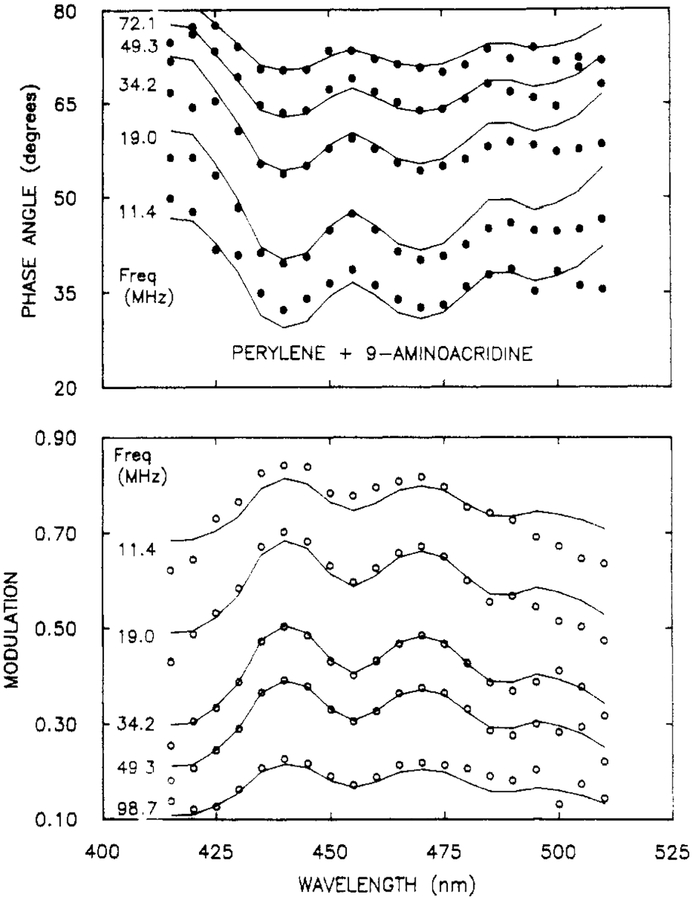
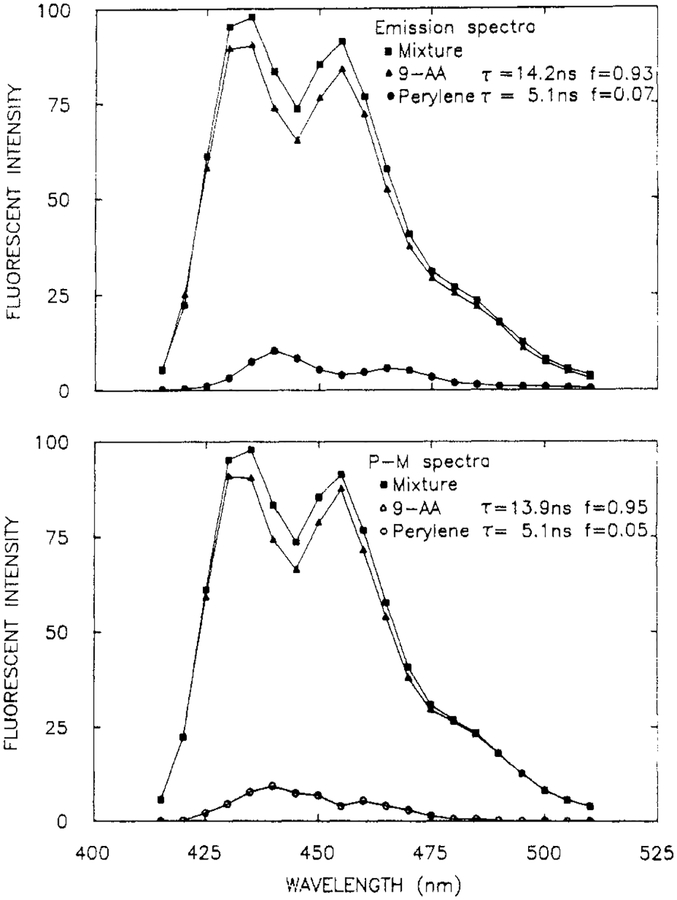
It is instructive to examine the resolution of overlapping spectra, each of which contains vibrational structure. Such an experiment tests whether the amplitudes at adjacent wavelengths are well determined by the data. Such a sample was provided in a mixture of perylene (per, 5.1 ns) and 9-aminoacridine (9-AA) (14.2 ns). Their emission spectra overlap (Figure 8), with the peaks and valleys being interlaced. The phase angle and modulation spectra show maximum and minimum dependent upon whether perylene or 9-AA is the dominant emitter, respectively (Figure 9). The solid line shows the best fit to the data using the two decay time model. While the fit is not perfect at all wavelengths, the data were adequate to yield excellent recovery of the spectra (Figure 8), decay times, and amplitudes (Table III).
Figure 8.
Emission spectra (top) and recovered spectra (bottom) from a mixture of perylene and 9-AA, in ethanol at 20 °C. [9-AA] = [perylene] = 5 × 10⁻⁶ M.
Figure 9.
Phase (top) and modulation spectra (bottom) from a mixture of perylene and 9-AA. The solid lines show the best fit to the data using two wavelength-independent decay times and variable amplitudes at each wavelength
Table III.
Decay Times and Amplitudes for Two-Component Mixtures
| τi, ns | Fi | ||||
|---|---|---|---|---|---|
| sample | expecteda | found | expectedb | found | χR2 |
| Per + 9-AAc (50/50) | 8.95 | 1.0 | 38.0 | ||
| 5.07c | 5.26d | 0.42 | 0.38 | ||
| 14.18 | 14.89 | 0.58 | 0.62 | 2.9 | |
| Per + 9-AAe (07/93) | 13.31 | 1.0 | 4.0 | ||
| 5.07 | 5.50 | 0.07 | 0.05 | ||
| 14.18 | 13.94 | 0.93 | 0.95 | 2.3 | |
| p-QP + PPOc,g (50/50) | 1.12f | 1.0 | 7.7 | ||
| 0.80 | 0.81 | 0.48 | 0.46 | ||
| 1.42 | 1.53 | 0.52 | 0.54 | 2.5 | |
From the usual FD measurements.
From the steady-state spectra normalized to 1.0.
The FD measurements of Per + 9-AA were performed using a Corning 3–74 emission filter, and of p-QP + PPO using a WG filter. [9-AA] = [Per] = 5 × 10⁻⁶ M.
Measured at 12 modulation frequencies.
[9-AA] = 1 × 10⁻⁵ M, [Per] = 1 × 10⁻⁶ M.
Measured at 16 modulation frequencies.
[p-QP] = [PPO] = 3 × 10⁻⁶ M.
We also examined the usefulness of the phase-modulation spectra for recovery of a minor component in the emission. For this purpose we used a solution that contained dominately 9-AA (≈93%) and a small amount of perylene (≈7 %). In spite of the small amplitude due to perylene, its spectrum and intensity were recovered from the data (Figure 10 and Table III).
Figure 10.
Emission spectra (top) and recovered spectra (bottom) from a solution of 9-AA with a small amount of perylene, in ethanol at 20 °C. [9-AA] = 1 × 10⁻⁵ M, [perylene] = 1 × 10⁻⁶ M.
Subnanosecond Components.
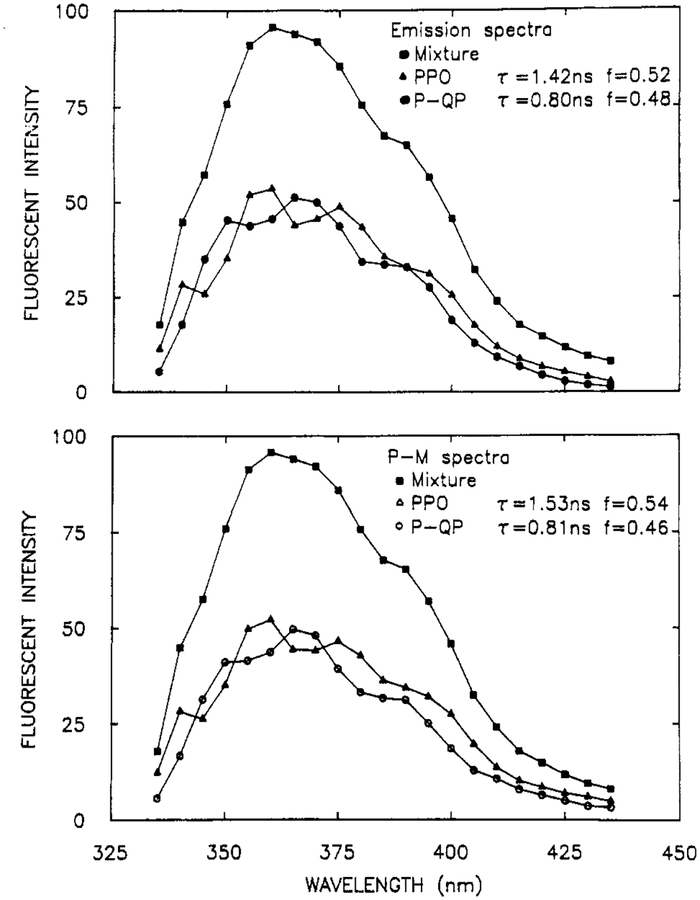
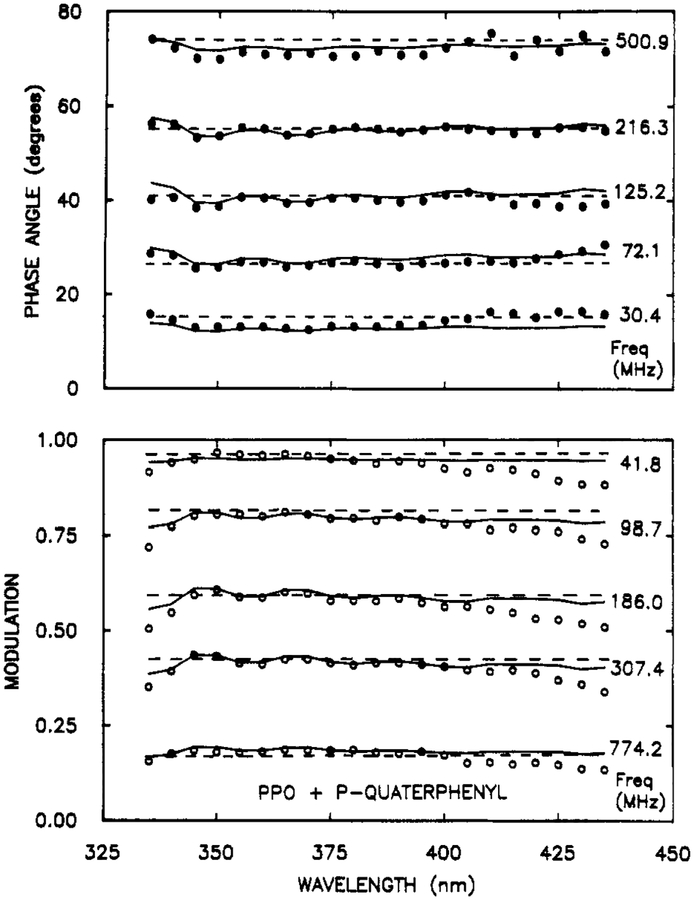
And finally we questioned our ability to resolve fluorophores with decay times near 1 ns. We chose a mixture of 2,5-diphenyloxazole (PPO, 1.42 ns) and p-quarterphenyl (p-QP, 0.80 ns), whose emission spectra are structured and overlap nearly completely (Figure 11). The phase and modulation spectra were collected at frequencies ranging to 774 MHz (Figure 12). These spectra show modest peaks and valleys corresponding to the emission of PPO and p-QP. The dashed lines in Figure 12 show the best single decay time fit. Naturally, the phase and modulation are constant with wavelength at each frequency. The two decay time fit display the same maximum and minimum as found in the data. Importantly, the emission spectra (Figure 11), decay times, and amplitudes (Table III) recovered from the data are in excellent agreement with the expected values. Hence, even subnanosecond components can be recovered by using this method.
Figure 11.
Steady-state emission spectra (top) and recovered spectra (bottom) for a mixture of PPO and p-QP, in cyclohexane at 20 °C. [PPO] = [p-QP] = 3 × 10⁻⁶ M.
Figure 12.
Phase (top) and modulation spectra (bottom) for a mixture of PPO and p-QP. The solid and dashed lines show the best two and one decay time fits, respectively.
DISCUSSION
We have demonstrated that phase-modulation spectra can be used to recover the emission spectra, decay times, and amplitudes of multicomponent mixtures. While phase-sensitive measurements have been previously used for such resolutions (58–60), these more limited data require calibration measurements with the individual fluorophores, measurement at a number of detector phase angles, followed by fitting the phase-sensitive intensities to a cosine function. This procedure is equivalent to determining the phase angle of each fluorophore, which in turn is equivalent to knowing its decay time (eq 10). The method described in the present paper does not require prior knowledge of the decay times and does not require measurements on the isolated components.
There appears to be many potential applications for our method, in addition to analytical chemistry. An important feature of the method is that it does not require separation of the components. Such separations are often impossible, as is the case with multi-tryptophan proteins (61) and photosynthetic systems (62,63). In fact, energy transfer among the photosynthetic pigments has already been briefly explored by use of phase angle spectra (64–66). While the signal-to-noise and resolution of these early measurements may have been unsatisfactory, it should be noted that these measurements did not take advantage of the dramatic increase in signal-to-noise provided by cross-correlation detection. Additionally, the frequency range can now be considerably higher than that used previously. In fact, recent developments in this laboratory have extended the upper frequency limit for 2 to nearly 10 GHz (67), which has allowed resolution of components with decay times as short as 2 ps. And finally, phase-mcdulation spectra may be of value in studies of solvent, protein, and membrane dynamics. The single frequency measurements havve already been used to estimate the solvent relaxation time of a tryptophan analogue in propylene glycol (68,69), and variable frequency measurements have been used to calculate time-resolved emission spectra (70, 71). The combination of gigahertz variable-frequency methods with wavelength scanning should provide data adequate to test models for solvent-fluorophore dynamics and interactions (72–75).
Acknowledgments
This work was supported by grants from the National Science Foundation (DMB-8804931 and DMB-8502835). Joseph R. Lakowicz acknowledges support from the Medical Biotechnology Center of the University of Maryland.
LITERATURE CITED
- (1).Taylor DL; Waggoner AS; Lanni F; Murphy RF; Burga RR Application of Fluorescence in the Biomedical Sciences; A. R. Liss: New York, 1986. [Google Scholar]
- (2).Lakowicz JR Principles of Fluorescence Spectroscopy; Plenum Press: New York, 1983. [Google Scholar]
- (3).Steiner RF; Weinriyb I Excited States of Proteins and Nucleui Acids; Plenum Press: New York, 1971. [Google Scholar]
- (4).Jameson DM; Reinhart GR Fluorescent Biomolecules; Plenum Press: New York, 1989. [Google Scholar]
- (5).Lakowicz JR, Ed. Time-Resolved Laser Spectroscopy in Biochemistry; SPIE 909; Society of Photo-Optical Instrumentation Engineers: Bellingham, WA, 1988; pp 1–471. [Google Scholar]
- (6).Schulman SG Molecular Luminescence Spectroscopy; John Wiley and Sons: New York, 1985. [Google Scholar]
- (7).Wolfbeis OS Pure Appl. Chem 1987, 59, 663–677. [Google Scholar]
- (8).Peterson JI; Vurek GG Science 1984, 224, 123–127. [DOI] [PubMed] [Google Scholar]
- (9).O’Connor DV; Phillips D Time-correlated single photon counting; Academic Press: New York: 1984. [Google Scholar]
- (10).Visser AJWG, Ed. Time-Resolved Fluorescence Spectroscopy Anal. Instrum 1985, 74, 193–566. [Google Scholar]
- (11).Gratton E; Limkemann M Biophys. J 1883, 44, 315–324. [DOI] [PMC free article] [PubMed] [Google Scholar]
- (12).Lakowicz JR; Maliwal BP Biophys. Chem 1985, 27, 61–78. [DOI] [PubMed] [Google Scholar]
- (13).Jameson DM; Gratton E; Hail RD Appl. Spectrosc 1984, 20, 55–106. [Google Scholar]
- (14).Gratton E; Jameson DM; Hall RD Annu. Rev. Biophys. Bioeng 1884, 13 105–124. [DOI] [PubMed] [Google Scholar]
- (15).Lakowicz JR In Subcellular Biochemistry; Hilderson JJ, Harris JR, Eds.; Plenum Press: New York, 1988; pp 89–126. [Google Scholar]
- (16).Lakowicz JR In Modern physical Methods in Biochemistry; Neuberg A, Van Deenen LM, Eds.; Elsevier: New York, 1988; Vol. IIB; Chapter 1, pp 1–26. [Google Scholar]
- (17).Gratton E; Linkeman M; Lakowicz JR; Maliwal BP; Cherek H; Laczko G Biophys. J 1884. 46 479–486. [DOI] [PMC free article] [PubMed] [Google Scholar]
- (18).Lakowicz JR; Gratton E; Laczko G; Cherek H; Limkeman M Biophys. J 1984, 46, 463–477. [DOI] [PMC free article] [PubMed] [Google Scholar]
- (19).Mugnier J; Valeur B; Gratton E Chem. Phys. Lett 1985, 179, 217–222. [Google Scholar]
- (20).Lakowicz JR; Cherek H Chem. Phys. Lett 1988, 722, 380–384. [Google Scholar]
- (21).Parasassi T; Conti F; Gratton E Cell. Mol. Biol 1988, 32, 103–108. [PubMed] [Google Scholar]
- (22).Lakowicz JR; Cherek H; Laczko G; Gratton E Biochim. Biophys. Acta 1984. 777, 183–193. [Google Scholar]
- (23).Lakowicz JR; Gryczynski I; Cherek H J. Biol. Chem 1986, 261, 2240–2245. [PubMed] [Google Scholar]
- (24).Lakowicz JR; Laczko G; Gryczynski I Biochemistry 1987, 26, 82–90. [DOI] [PMC free article] [PubMed] [Google Scholar]
- (25).Gryczynski I; Cherek H; Lakowicz JR Biophys. Chem 1988, 30, 271–277. [DOI] [PubMed] [Google Scholar]
- (26).Lakowicz JR; Gryczynski I; Wiczk W Chem. Phys. Lett 1988, 149, 134–139 [Google Scholar]
- (27).Lakowicz JR; Cherek H; Gryczynski I; Joshi N; Johnson ML Biophys. Chem 1987, 28, 35–50. [DOI] [PMC free article] [PubMed] [Google Scholar]
- (28).Alcala RR: Gratton E: Prendergast FG Biophys. J 1987. 51, 587–596 and 597–604. [DOI] [PMC free article] [PubMed] [Google Scholar]
- (29).Alcala RR; Gratton E; Prendergast FG Biophys. J 1987, 51, 925–936. [DOI] [PMC free article] [PubMed] [Google Scholar]
- (30).Lakowlcz JR; Johnson ML; Wiczk W; Bhat A; Steiner RF Chem. Phys. Lett 1987, 738, 587–593. [DOI] [PMC free article] [PubMed] [Google Scholar]
- (31).Lakowicz JR; Gryczynski I; Cheung H; Wonk C; Johnson MC; Joshi N Biochemistry 1988, 27, 9149–9160. [DOI] [PMC free article] [PubMed] [Google Scholar]
- (32).Lakowicz JR; Joshi NB; Johnson MC; Szmacinski H; Gryczynski I J. Biol. Chem 1987, 262, 10907–10910. [PubMed] [Google Scholar]
- (33).Lakowicz JR; Johnson MC; Gryczynski I; Joshi N; Laczko G J. Phys. Chem 1987, 91, 3277–3285. [DOI] [PMC free article] [PubMed] [Google Scholar]
- (34).Lakowicz JR; Laczko G Rev. Sci. Instrum 1986, 57, 2499–2506. [Google Scholar]
- (35).Weber GJ Phys. Chem 1981. 85 949–953. [Google Scholar]
- (36).Jameson DM; Weber G J. Phys. Chem 1981, 85, 953–958. [Google Scholar]
- (37).Jameson DM; Gratton E In New Directions in Molecular Luminescence; Eastwood D, Ed.; ASTM Special Technical Publication 882; American Standards for Testing and Materials: Philadelphia, PA, 1983: pp 67–81. [Google Scholar]
- (38).Barrow D; Lentz B J. Biochem. Biophys. Methods 1983, 7, 217–234. [DOI] [PubMed] [Google Scholar]
- (39).Lakowicz JR; Cherek H; Baker A J. Biochem. Biophys. Methods 1981, 5, 131–146. [DOI] [PubMed] [Google Scholar]
- (40).Dalbey RE; Weiel J; Perkins WJ; Yount RG J. Biochem. Biophys. Methods 1984, 9, 251–266. [DOI] [PubMed] [Google Scholar]
- (41).Lakowicz JR; Cherek H J. Biochem, Biophys. Methods 1981, 5, 19–35. [DOI] [PubMed] [Google Scholar]
- (42).Lakowicz JR; Cherek HJ Biol. Chem 1981, 256, 6348–6353. [PubMed] [Google Scholar]
- (43).Vesolova TV; Cherkasov AS; Shirokov VI Opt. Spectrosc 1970, 24, 617–616. [Google Scholar]
- (44).Mousa JJ; Winefordner JD Anal. Chem 1974, 46, 1195–1206. [DOI] [PubMed] [Google Scholar]
- (45).Demas JN; Keller RA Anal. Chem 1985, 57, 538–545. [Google Scholar]
- (46).van Hoek A; Visser AJWG Anal. Instrum 1985, 14, 143–154. [Google Scholar]
- (47).Nithipitikon K; McGown LB Anal. Chem 1987, 59, 423–427. [DOI] [PubMed] [Google Scholar]
- (48).Lakowicz JR; Keating SJ Biol. Chem 1983, 258, 5519–5524. [PubMed] [Google Scholar]
- (49).Nithipiteikon K: McGown LB Appl. Spectrosc 1987, 41, 395–399. [Google Scholar]
- (50).Keating-Nakamoto SM; Cherek H; Lakowicz JR Anal. Chem 1987, 59, 271–278. [DOI] [PMC free article] [PubMed] [Google Scholar]
- (51).Gratton E; Jameson DM Anal. Chem 1985, 57, 1694–1697. [Google Scholar]
- (52).Keating-Nakamoto SM; Cherek H; Lakowicz JR Anal. Biochem 1985, 148, 349–356. [DOI] [PubMed] [Google Scholar]
- (53).Keating-Nakamoto SM; Cherek H; Lakowicz JR Biophys. Chem 1988, 24, 79–95. [DOI] [PubMed] [Google Scholar]
- (54).Bevington PR Data Reduction and Error Analysis for the Physical Sciences; McGraw-Hill: New York: 1969. [Google Scholar]
- (55).Matayoshi ED Biochemistry 1980, 19, 3414–3422. [DOI] [PubMed] [Google Scholar]
- (56).Spencer RD; Weber G Ann. N.Y. Acad. Sci 1969. 158, 361–376. [Google Scholar]
- (57).Lakowicz JR; Baker A Biophys. Chem 1982. 16, 99–115. [DOI] [PMC free article] [PubMed] [Google Scholar]
- (58).McGown LB; Bright FV CRC Crit. Rev. Anal. Chem 1987, 18 245–295. [Google Scholar]
- (59).McGown LB Anal. Chem. Acta 1984, 157, 327–332. [Google Scholar]
- (60).Bright FV; McGown LB Anal. Chem 1985, 57, 2877–2880. [Google Scholar]
- (61).Eftink MR; Wasylewski Z; Ghiron CA Biochemistry 1987, 26 8338–8346. [DOI] [PubMed] [Google Scholar]
- (62).Pellegrino F; Aifono RR Biological Events Robed by Ultrafast Laser Spectroscopy; Academic Press: New York, 1982; Chapter 2, pp 27–53. [Google Scholar]
- (63).Bittermann E; Holzwarth AR; Agei G; Nulksch W Photochem. Photobiol 1988, 47, 101–105. [Google Scholar]
- (64).Sebban P; Moya I Biochim. Biiophys. Acta 1983, 727, 436–447. [Google Scholar]
- (65).Sebban P; Jolchine G; Moya I Photochem. Photobiol 1984, 39, 247–253. [Google Scholar]
- (66).Sebban P; Bruno R; Jolchine G Photochem. Photobiol 1985, 42, 573–578. [Google Scholar]
- (67).Laczko G; Gryczynski I; Gryczynski Z; Wiczk W; Malak H; Lakowicz JR Rev. Sci. Instrum, in press.
- (68).Lakowicz JR; Balter A Biophys. Chem 1982, 15, 353–360. [DOI] [PubMed] [Google Scholar]
- (69).Lakowicz JR; Thompson RB; Cherek H Biochim. Biophys. Acte 1983, 734, 294–308 [Google Scholar]
- (70).Gkowicz JR; Cherek H; Maliwal B; Laczko C; Gratton E J. Biol. Chem 1984, 259, 10967–10972. [PubMed] [Google Scholar]
- (71).Lakowicz JR; Cherek H; Laczko G; Gratton E Biochim. Biophys. Acta 1977. 777 183–193. [Google Scholar]
- (72).Declemy A; Rulliere C Chem. Phys. Lett 1988. 146, 1–6. [Google Scholar]
- (73).Castner EW; Bagchi B; Maroncelli M; Webb SP; Ruggiero AJ; Fleming GR Ber. Bunsen-Ges. Phys. Chem 1988, 92, 363–372. [Google Scholar]
- (74).Nagarajan V; Brearley AM; Kank TJ; Barbara PF J. Chem. Phys 1987, 86 3183–3196. [Google Scholar]
- (75).Anthon DW; Clark JH J. Phys. Chem 1988, 91, 3530–3536. [Google Scholar]


