

Abstract
Iron is vital for the life of most organisms. However, when dysregulated, iron can catalyze the formation of oxygen (O2) radicals that can destroy any biological molecule and thus lead to oxidative injury and death. Therefore, iron metabolism must be tightly regulated at all times, as well as coordinated with the metabolism of O2. However, how is this achieved at the whole animal level is not well understood. Here, we explore this question using the nematode Caenorhabditis elegans. Exposure of worms to O2 starvation conditions (i.e. hypoxia) induces a major upregulation in levels of the conserved iron-cage protein ferritin 1 (ftn-1) in the intestine, while exposure to 21% O2 decreases ftn-1 level. This O2-dependent inhibition is mediated by O2-sensing neurons that communicate with the intestine through neurotransmitter and neuropeptide signalling, and requires the activity of hydroxylated HIF-1. By contrast, the induction of ftn-1 in hypoxia appears to be HIF-1-independent. This upregulation provides protection against Pseudomonas aeruginosa bacteria and oxidative injury. Taken together, our studies uncover a neuro-intestine axis that coordinates O2 and iron responses at the whole animal level.
Keywords: Ferritin, ftn-1, Hypoxia, Caenorhabditis elegans, HIF-1, EGL-9, VHL-1, Soluble guanylate cyclases, Oxygen sensing neurons
Graphical abstract
Highlights
-
•
The expression of ferritin 1 (ftn-1) is tightly regulated by O2 tension.
-
•
O2-sensing neurons inhibit the expression of ftn-1 in the intestine at 21% O2.
-
•
Hydroxylated–HIF–1 inhibits the expression of ftn-1 at 21% O2.
-
•
ftn-1 is important for protecting against Pseudomonas aeruginosa bacteria.
1. Introduction
Iron present aerobic animal with a double-edged sword. On the one hand, it is crucial for the most fundamental processes of life including DNA synthesis and ATP production in the mitochondria [1,2]. On the other hand, free iron can interact with reactive oxygen species (ROS) to produce toxic oxygen radicals (e.g. hydroxyl radicals through a Fenton reaction [3]) that can destroy any biological molecule and thus promote oxidative damage and cell death [4,5]. Therefore, iron and oxygen (O2) metabolisms must be closely coordinated at all times.
Ferritins are conserved proteins found in all three domains of life [6] and play a major role in iron homeostasis. In general, ferritins assemble to form a spherical nanocage [7], which in the case of the classical mammalian ferritin complex is made up of “light” and “heavy” ferritin (24 in total), capable of storing up to 4500 iron molecules in their oxidized state [6]. Thus, the ferritin complex acts as an iron reservoir that limits the level of free iron and in this way protects cells against oxidative damage. However, how ferritin function is coordinated between different tissues is poorly understood in any aerobic animal.
The Caenorhabditis elegans (C. elegans) nematode genome contains two heavy (H) ferritin genes, i.e. ftn-1 and ftn-2, that encode the iron storage proteins FTN-1 and FTN-2. FTN-1 is found mainly in the intestine, while ftn-2 is expressed in many cell types including the intestine, hypodermis, pharynx, and body-wall muscle [8,9]. Moreover, and similarly to mammals, C. elegans ferritin is induced by iron. However, unlike mammals, the level of ferritin is primarily regulated at the transcriptional level [10].
Previous studies show that the hypoxia-inducible transcription factor HIF-1 suppresses the expression of ftn-1 at 21% O2 [11,12]. HIF-1 is mainly regulated at the protein level [13]. At 21% O2, the prolyl hydroxylase EGL-9 hydroxylates HIF-1 [14] and thus creates a binding site for the von Hippel-Lindau protein (VHL) [15]. VHL binding leads to polyubiquitylation of HIF-1 and consequently to its degradation in the proteasome. Since the activity of EGL-9 is O2 and iron-dependent, HIF-1 is stable under conditions of limited availability of O2 (hypoxia) and iron [16]. The stable HIF-1 interacts with its HIF-1β subunit (i.e. AHA-1) and thus controls the function of many genes essential for the adaptation to hypoxia [16,17].
In addition to its key function in hypoxia, HIF-1 appears to have important regulatory functions at 21% O2 (e.g. ftn-1 expression regulation [11,12]). Indeed, a recent study show that C. elegans HIF-1 regulates the function of 1075 genes at 21% O2 [18]. Intriguingly, the authors of this paper suggested a model in which hydroxylated–HIF–1 (hereafter referred to as HIF-1-OH) has a regularity role in ftn-1 expression regulation, distinct from the regulatory role of the non-hydroxylated HIF-1.
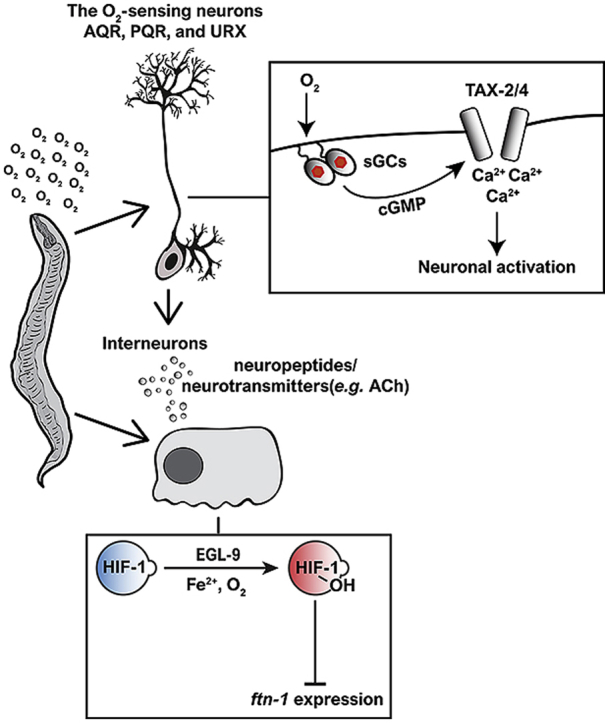
Here, we provide experimental evidence that HIF-1-OH inhibits the expression of ftn-1 at 21% O2 and hypoxia conditions. In contrast, we show that non-hydroxylated HIF-1 is negligible for the upregulation of ftn-1 expression in hypoxia. Intriguingly, we show that intestinal ftn-1 expression is regulated by the O2-sensing neurons AQR, PQR, and URX. In these neurons, soluble guanylate cyclases (sGCs) and the cyclic nucleotide-gated channels TAX-2 and TAX-4 act to suppress ftn-1 expression at 21% O2. This neuronal inhibitory signal is mediated by both neurotransmitter/neuropeptide signalling. Therefore, ftn-1 expression appears to be regulated in a cell-non-autonomous manner. Finally, we discover that FTN-1 protects against Pseudomonas aeruginosa (PA14) bacteria. This protective effect may reflect a more general capability. That is, FTN-1 ability to protect against oxidative damage.
2. Results
2.1. Intestinal ftn-1 expression is differentially regulated in response to changes in O2 level
In a previous study we characterized the changes in neuronal and intestinal gene expression occurring during the adaptation of glb-5( + );npr-1(−) worms to hypoxia (1% O2) and their subsequent recovery at 21% O2 [19]. This worm strain bears a functional globin 5 allele (hereafter referred to as glb-5( + )) and a loss-of-function allele of the neuropeptide receptor npr-1 (i.e. npr-1(ad609); hereafter referred to as npr-1(−)) and therefore able to respond to subtle changes in ambient O2 level (e.g. to a 21%–19.2% O2 shift [20]) and to recover fast from a sojourn in hypoxia [21,22]. Indeed, after an overnight incubation at 1% O2, glb-5( + );npr-1(−) worms resume a robust bordering feeding behaviour within minutes at 21% O2 (i.e. the accumulation of worms on the bacterial lawn border, where bacteria grow thicker and the O2 level is ~13% O2 [23]). By contrast, npr-1(−) worms, bearing a non-functional allele of glb-5, display full recovery only after 4 h at 21% O2 [21]. We collected mRNA at five-time points (0, 3, 6, 24.5, and 28 h) in which we previously characterized the effect of hypoxia/reoxygenation on the bordering behaviour of npr-1(−) and glb-5( + );npr-1(−) worms [21,22]. The T = 0 samples were collected from worms at 21% O2, prior to their exposure to hypoxia (when bordering behaviour is robust in both strains). The T = 3 samples were collected from worms exposed to 1% O2 for 3 h; this time point represents a physiological state in which the changes in gene expression, caused by the exposure to 1% O2, do not change the bordering recovery of npr-1(−) worms. The T = 6 samples were collected from worms exposed to 1% O2 for 6 h; this time point represents a turning point at which the exposure to hypoxia attenuates the bordering recovery of npr-1(−) worms but not the recovery of glb-5( + );npr-1(−) animals. The 24.5 and 28 h samples were collected after 24 h exposure to hypoxia followed by 30 min or 4 h recovery at 21% O2, respectively. At T = 24.5 h, the difference between the bordering recovery of npr-1(−) and glb-5( + );npr-1(−) worms is maximal, whereas at T = 28 h there is no difference between the bordering behaviour of the two strains (i.e. both strains display a robust bordering behaviour). The expression of genes was compared between samples 0 and 3 (the 0–3 h pair), 3 and 6 (the 3–6 h pair), 6 and 24.5 (the 6–24 h pair), and 24.5 and 28 (the 24.5–28 h pair). The collected data were analyzed using a custom written MATLAB program.
In this study, we have chosen to focus on the intestinal gene expression data. The C. elegans intestine cells are highly metabolic [24] and considered to be the main location in which worms encounter bacteria metabolites, toxins, and metals [24,25]. These chemical substances can further increase the formation of ROS, induced by the transition of worms to hypoxia and their return to 21% O2 (i.e. reoxygenation) [26]. We identified 763 genes that showed a significant change in expression level in at least one of the time-pair comparisons (Supplementary Data File 1). Using K-means clustering and gene ontology (GO) analysis, we identified six expression clusters (Supplementary Data File 2 and Supplementary Figs. 1–6) with distinct biological functions (Supplementary Data File 3). We validated our microarray analysis results by performing quantitative PCR (qPCR) experiments. We explored the changes in gene expression in time-pairs 0–6 h and 24.5–28 h. We chose these time-pairs because respectively they represent the adaptation to hypoxia and the re-adaptation to 21% O2 periods. The qPCR and microarray results were tightly correlated (Pearson r = 0.8989, p = 0.0004) and further supported the differential expression of the F22B5.4, ftn-1, trx-3, col-137, gpdh-1, fat-3, and zip-8 genes during hypoxia and re-adaptation to 21% O2. Notably, we chose these genes because they represent a broad spectrum of proteins found in clusters 1,2,3,5, and 6; we did not include genes from cluster 4 because the expected expression change at T = 6 h is negligible (Supplementary Fig. 4). Intriguingly, we observed that ftn-1 expression is profoundly upregulated in hypoxia and downregulated upon returning to 21% O2 (Fig. 1A and B, respectively), suggesting that tight regulation of iron level during these sharp O2-transitions is critical.
Fig. 1.

Intestinal ftn-1 expression is regulated by O2. mRNA level of genes identified by microarray was examined by qRT-PCR at 0 h–6 h (A) and 24.5 h–28 h (B) time points. The expression of the ned-8 and ubq-2 genes was used as a reference in all of the qPCR experiments. The efficiency of target and reference genes was checked with a standard curve and used in fold-change calculations. Data represent the average of at least three biological replicates. (Error bars represent SEM).
2.2. AQR, PQR, and URX inhibit ftn-1 expression at 21% O2
The robust downregulation of ftn-1 expression upon returning to 21% O2 suggests that O2 sensors, tuned to ambient O2 level, inhibit ftn-1 activity. The AQR, PQR, and URX sensory neurons are tonically activated at 21% O2 [27]. Therefore, we asked whether these neurons inhibit ftn-1 expression at 21% O2. To explore this, we measured ftn-1 level in N2 worms in which the death activator egl-1 is expressed specifically in AQR, PQR, and URX [28]. Importantly, we decided to switch our experiments to the N2 strain and not to continue with the glb-5( + );npr-1(−) strain, for two reasons: (1) N2 laboratory strain is the canonical reference strain in the C. elegans field [29,30] and therefore facilitates comparison to previous studies (2) We observed a robust up/downregulation of ftn-1 expression in N2 worms in response to hypoxia/reoxygenation, respectively (Supplementary Fig. 7). Therefore, we could explore ftn-1 regulation on a much simpler genetic background, without compromising the strong phenotype. The genetic ablation of AQR, PQR, and URX increased the level of ftn-1 expression, at 21% O2, to the level observed in wild-type N2 worms after 6 h in hypoxia (Fig. 2A), suggesting that these neurons send an inhibitory signal that inhibits ftn-1 expression at 21% O2. Importantly, AQR, PQR, and URX ablation did not affect the activity of ftn-1 in hypoxia indicating that these neurons do not play a role in ftn-1 regulation in hypoxia. This is expected because the activity of these neurons is inhibited at low O2 level [31].
Fig. 2.

AQR, PQR, and URX inhibit the expression of ftn-1 at 21% O2. Bar graphs presenting the expression of ftn-1 at 21% O2 and after 6 h exposure in 1% O2. (A) Ablation of AQR, PQR, and URX resulted in increased expression of ftn-1 at 21% O2. Asterisks indicate significant compared to AQR, PQR, and URX ablated worms at 21% O2. Notably, the level of ftn-1 at 21% O2, in the AQR, PQR, and URX ablated strain, was similar to the level of ftn-1 in hypoxia. (B) Neurotransmitter/neuropeptide signalling is required for inhibiting ftn-1 expression at 21% O2. Asterisks indicate significant compared to N2 controls, within each experimental condition. (C) A schematic model for ACh synthesis, transport, and secretion; inspired by Ref. [81]. ACh synthesis (D) and transport (E) are crucial for inhibiting ftn-1 expression at 21% O2. Asterisks indicate significant compared to N2 controls after 6 h at 1% O2. These graphs represent the average of 4–7 (A), 3–5 (B), 5–6 (D), and 3–5 (E) biological repeats, respectively. Multiplet-tests with Holm-Sidak multiple comparison correction. *p < 0.5, ***p < 0.001, ****p < 0.0001, ns = non-significant. Multiple t-tests with Holm-Sidak multiple comparison correction. Error bars represent SEM. These graphs represent the average of 4–7 (A) and 3–5 (B) biological repeats, respectively. Multiplet-tests with Holm-Sidak multiple comparison correction. ***p < 0.001, ns = non-significant. Multiple t-tests with Holm-Sidak multiple comparison correction. Error bars represent SEM.
2.3. ftn-1 expression is regulated by neuropeptide and neurotransmitter signalling at 21% O2
We hypothesized that AQR, PQR, and URX inhibit ftn-1 expression through neurotransmitter or neuropeptide signalling, or both. To explore this, we measured the level of ftn-1 in unc-13(e450) worms that are defective in neurotransmitter release [[32], [33], [34]] and in unc-31(e928) and egl-3(n150) mutants that are defective in neuropeptide release and maturation, respectively [35]. The level of ftn-1 in these mutants was significantly higher compared to N2 controls at 21% O2 (Fig. 2B), suggesting that both neurotransmitter and neuropeptide signalling are important for inhibiting ftn-1 expression. Notably, the level of ftn-1 in these mutants was similar to N2 controls at 1% O2, suggesting that the upregulation of ftn-1 expression in hypoxia is not dependent on neurotransmitter or neuropeptide signalling.
UNC-13 is important for the release of the neurotransmitter acetylcholine (ACh) [36]. Therefore, we asked whether ACh mediates the inhibition of ftn-1 expression at 21% O2. To explore this, we measured ftn-1 expression in worms defective in ACh signalling. Namely, the cha-1(p1152) and unc-17(e245) strains that are defective in ACh synthesis [37] and vesicular ACh transport [38], respectively (Fig. 2C). The levels of ftn-1 (at 21% O2) in these mutants were similar to the ones observed in N2 worms after exposure to hypoxia (Fig. 2D and E), suggesting that at least part of the inhibitory signal that suppresses ftn-1 expression at 21% O2 is mediated by ACh. Interestingly, the ftn-1 levels of cha-1(p1152) mutants (at 1% O2) were significantly higher than N2 controls (Fig. 2D), suggesting that ACh attenuates ftn-1 expression at both 21% and 1% O2. However, the effect is more pronounced at 21% O2 and is not significant in unc-17(e245) worms at 1% O2 (Fig. 2E).
2.4. TAX-2 and TAX-4 are essential for suppressing ftn-1 expression at 21% O2
AQR, PQR, and URX activation at 21% O2 is dependent on the cyclic nucleotide-gated channels TAX-2 and TAX-4 [23,[39], [40], [41]] (Fig. 3A). Therefore, we hypothesize that these channels are essential for suppressing ftn-1 expression at 21% O2. To test this, we measured ftn-1 expression in tax-2 and tax-4 mutants at 21% O2 and after 6 h exposure to 1% O2 (as well as in N2 controls). At 21% O2, worms bearing the tax-2(ok3403) deletion allele or either of the loss-of-function tax-4 mutations (i.e. ks28 and p678) had higher levels of ftn-1 compared to wild type worms (Fig. 3B), indicating that these channel subunits are essential for inhibiting ftn-1 expression at 21% O2. By contrast, at 1% O2, the level of ftn-1 in the two tax-4 mutants was similar to N2 worms and slightly (but significantly) higher in tax-2(ok3403) mutants. Moreover, the level of ftn-1 in the tax-2(p671);tax-4(p678) double mutant strain was similar to the tax-4(p678) single mutant level.
Fig. 3.

TAX-2 and TAX-4 inhibit ftn-1 expression at 21% O2. (A) Schematic illustration presenting a model for AQR, PQR, and URX activation at 21% O2. Upon O2 binding GCY-35/GCY-35 increase cGMP production. cGMP binds to the TAX-2/TAX-4 channel complex and thus facilitates calcium (Ca2+) entry, and depolarization. (B) Bar graph presenting the expression of ftn-1 at 21% O2 and after 6 h exposure in 1% O2 in wild-type (N2) worms and in tax-2, tax-4, and cng-1 mutants. Asterisks indicate significance for comparisons with N2 animals at the beginning of the experiments (21% O2, time = 0; left side of the graph) and the significance for comparisons with N2 animals after 6 h at 1% O2 (time = 6; right side of the graph). Multiple t-tests with Holm-Sidak multiple comparison correction. These graphs represent the average of 3–8 biological repeats. Error bars represent SEM. *p < 0.05, ****p < 0.0001, ns = non-significant.
The cyclic nucleotide-gated channel cng-1 appears to interact genetically with tax-4 [42]. Moreover, it is expressed in the O2-sensing neuron PQR where both tax-2 and tax-4 are expressed [43]. Therefore, we asked whether CNG-1 regulates the expression of ftn-1. The cng-1(jh111) deletion mutation did not affect the level of ftn-1 at 21% or 1% O2 (Fig. 3B), suggesting that CNG-1 does not play a role in ftn-1 regulation. Moreover, the ftn-1 expression phenotypes of tax-4(p678);cng-1(jh111) and tax-4(p678) mutants was similar (Fig. 3B), suggesting that tax-4 is epistatic to cng-1. Together, these results suggest that the activity of TAX-2 and TAX-4 (but not of CNG-1) is essential for inhibiting ftn-1 expression at 21% O2. Moreover, our data suggest that TAX-2 may also negatively regulate the expression of ftn-1 in hypoxia, however, to a lesser extent.
2.5. The AQR, PQR, and URX sGCs play an important function in ftn-1 regulation
The activity of the TAX-2/TAX-4 channel is regulated by the atypical soluble guanylate cyclase (sGCs) GCY-35 and GCY-36 [23,31] (Fig. 3A). These sGCs appear to form a functional heterodimer that acts as an O2 sensor in AQR, PQR, and URX. Upon O2 binding, GCY-35/36 produce more cyclic GMP (cGMP) that triggers the opening of the TAX-2/TAX-4 channel and thus lead to the activation of AQR, PQR, and URX. Therefore, we hypothesized that these sGCs are important for inhibiting ftn-1- expression at 21% O2. To test this, we measured the expression of ftn-1 in worms bearing deletion alleles of gcy-35 and gcy-36 (gcy-35(ok769) and gcy-36(ok2208), respectively). At 21% O2, the levels of ftn-1 were significantly higher in the gcy-35 and gcy-36 mutants compared to N2 controls (Fig. 4A), further supporting the hypothesis that O2-induced cGMP signalling in AQR, PQR, and URX inhibit the expression of ftn-1 at 21% O2. Interestingly, ftn-1 expression was significantly lower in gcy-35 mutants compared to control worms (after 6 h exposure at 1% O2). However, the level of ftn-1 in gcy-36 mutants was similar to control worms.
Fig. 4.

sGCs act in AQR, PQR, and URX to inhibit ftn-1 expression at 21% O2. (A) Bar graph presenting the expression of ftn-1 at 21% O2 and after 6 h exposure in 1% O2 in wild-type (N2) worms and in sGCs mutants. Asterisks indicate significance for comparisons with N2 animals at the beginning of the experiments (21% O2, time = 0; left side of the graph) and the significance for comparisons with N2 animals after 6 h at 1% O2 (time = 6; right side of the graph). Multiple t-tests with Holm-Sidak multiple comparison correction. These graphs represent the average of 3–12 biological repeats. Error bars represent SEM. **p < 0.01, ***p < 0.001, ****p < 0.0001, ns = non-significant. (B) Measurement of sGC interaction through yeast two-hybrid assay. Diploid growth on selectable plates containing SD/–Leu/–Trp, X-α-Gal, and Aureobasidin A or non-selective plates (control plates) containing SD/–Leu/–Trp (upper and lower panels, respectively; in each Y2H experiment). Physical interaction between sGCs is indicated by colony formation on the selective media and the hydrolysis of X-α-Gal to a blue end product. (For interpretation of the references to colour in this figure legend, the reader is referred to the Web version of this article.)
In addition to gcy-35 and gcy-36, the AQR, PQR, and URX neurons express four additional sGCs, namely gcy-32, gcy-33, gcy-34, and gcy-37 [31,40,44]. We asked whether these sGCs regulate ftn-1 expression. To explore this, we measured the level of ftn-1 in worms bearing deletion mutations in these sGCs, i.e. gcy-32(ok995), gcy-33(ok232), gcy-34(ok2953), and gcy-37(ok384). Remarkably, each of these mutations increased the level of ftn-1 transcripts at 21% O2 (Fig. 4A), suggesting that each of these sGCs (as well as gcy-35 and gcy-36) has a unique activity that cannot be fully compensated by another sGC in AQR, PQR, and URX. It is worthwhile noticing that similarly to the gcy-35 mutants, the level of ftn-1 in gcy-32 and gcy-34 mutants was lower compared to N2 controls at 1% O2. In this respect, it is intriguing to speculate that these sGCs (as well as gcy-35) are also important for regulating ftn-1 level in hypoxia.
We carried out a control experiment in which we measured the effect of gcy-31 on ftn-1 expression. We chose gcy-31 because, among the seven sGCs encoded by the C. elegans genome (i.e. gcy-31-gcy-37), it is the only sGC that is expressed exclusively in the BAG O2-sensing neurons [31]; gcy-33 is expressed in BAG and AQR, PQR, and URX [31]. The BAG neurons are activated by decreases in O2 level and therefore act reciprocally to the URX neurons [31]; GCY-31 is essential for this O2 downshift response. The level of ftn-1 in worms bearing the gcy-31(ok296) deletion mutation was similar to N2 controls in both 21% and 1% O2 (Fig. 4A), suggesting that gcy-31 does not play a role in ftn-1 regulation. Together, our results suggest that each of the six sGCs expressed in AQR, PQR, and URX (i.e. gcy-32-gcy-37) has a unique role in ftn-1 inhibition at 21% O2. We next continued to explore the function of these sGCs.
2.6. In vitro exploration of sGCs interaction
Mammalian sGCs function as alpha/beta heterodimers [40,45,46]. In C. elegans, cumulative data suggest that GCY-35 and GCY-36 form a functional heterodimer in the AQR, PQR, and URX neurons [22,23,31,40]. However, little is known about other sGCs interactions in these neurons. To explore this, we performed yeast two-hybrid (Y2H) experiments. We used GCY-33, GCY-34, and GCY-35 as baits and GCY-31, GCY-32, GCY-33, GCY-35, and GCY-36 as preys and examined diploid growth on selective plates. As a negative and positive control we used the lamin:SV40 large T-antigen and p53:SV40 large T-antigen, respectively (see Ref. [21]). Apart from the GCY-33/GCY-32 and the GCY-33/GCY-36 diploids, all of the other diploids formed colonies on the selective plates (Fig. 4B). Notably, no colonies were observed in the negative control and rapid growth of colonies was observed in the positive control. Together, these results present an exciting and complex view of sGCs interaction inside AQR, PQR, and URX.
2.7. HIF-1 is not required for ftn-1 expression upregulation in hypoxia
Previous studies show that HIF-1 inhibits the expression of ftn-1 in N2 worms kept at standard ambient O2 conditions (i.e. 21% O2). Moreover, these studies demonstrate that HIF-1 binds to the ftn-1 promoter region [11,12], suggesting that this direct interaction underlies the suppression of ftn-1 expression. Our results show that ftn-1 expression is upregulated after 6 h at 1% O2, an O2 condition in which HIF-1 level is higher than at 21% O2 [17] and therefore would be expected to result in a stronger inhibition of ftn-1 expression and not an increase! To address this (apparent) conundrum, we first asked whether HIF-1 is required for the induction of ftn-1 expression in hypoxia. To answer this, we measured the expression of ftn-1 in worms bearing the hif-1(ia04) deletion allele [17] and N2 controls. As expected, and in agreement with previous studies, the expression of ftn-1 was significantly higher in hif-1(ia04) mutants compared to N2 control (Fig. 5A), indicating that HIF-1 acts as an ftn-1 suppressor at 21% O2. By contrast, ftn-1 levels were similar in hif-1(ia04) mutants and N2 controls at 1% O2, suggesting that the increase in ftn-1 expression is HIF-1-independent. Therefore, HIF-1 appears to have a strong impact on ftn-1 expression at 21% O2 but not in hypoxia.
Fig. 5.

HIF-1 is not required for ftn-1-upregulation at 1% O2. (A) Bar graphs presenting the expression of ftn-1 at 21% O2 and after 6 h exposure in 1% O2. Asterisks indicate significance for comparisons with N2 animals at the beginning of the experiments (21% O2, time = 0). The level of ftn-1 expression was similar in the two strains after 6 h in 1% O2. These graphs represent the average of 3 biological repeats. (B) A schematic working model presenting the inhibitory function of hydroxylated HIF-1 (HIF-1-OH). The egl-9 mutation inhibits the formation of HIF-1-OH, and thus results in constitutive ftn-1 expression. By contrast, the vhl-1 mutation results in HIF-1-OH enrichment, and therefore constitutive inhibition of ftn-1 expression. (C) Bar graphs presenting the expression of ftn-1 at 21% O2 and after 6 h exposure in 1% O2 in wild-type (N2) worms and egl-9 and vhl-1 mutants (B) or in HIF-1(P621G) transgenic worms (D). In (C), asterisks indicate significance for comparisons with N2 animals at the beginning of the experiments (21% O2, time = 0). In (D), the comparison was against ftn-1- expression in N2 worms at 1% O2. These graphs represent the average of 3–4 biological repeats. Multiple t-tests with Holm-Sidak multiple comparison correction. Error bars represent SEM. *p < 0.05, **p < 0.01, ****p < 0.0001, ns = non-significant.
2.8. HIF-1-hydroxylation appears to be crucial for suppressing ftn-1 expression at 21% O2
Why does HIF-1 suppress ftn-1 expression at 21% O2 but not in hypoxia? A recent paper by Sternberg and colleagues suggested an intriguing working model that may answer this question [18]. The model suggests that hydroxylated–HIF–1 (hereafter referred to as HIF-1-OH), but not the non-hydroxylated HIF-1, inhibits ftn-1 expression. To explore this, we measured the level of ftn-1 transcripts in animals bearing the egl-9(sa307) strong loss-of-function allele and in animals bearing the strong loss-of-function deletion mutation vhl-1(ok161). These mutations are known to stabilize HIF-1 to a similar extent at 21% O2 [47]. However, the egl-9(sa307) mutants accumulate non-hydroxylated HIF-1 and the vhl-1(ok161) mutants accumulate HIF-1-OH (Fig. 5B). Therefore, if the working model is correct we should expect a constitutive expression of ftn-1 in egl-9(sa307) mutants and constitutive low levels of ftn-1 in vhl-1(ok161) mutants. Our experiments confirmed these predictions. The expression of ftn-1 was constitutively high in egl-9(sa307) mutants and constitutively low in vhl-1(ok161) mutants (Fig. 5C), suggesting that high HIF-1 levels are not sufficient for suppressing ftn-1 expression and that in fact, it is the accumulation of HIF-1-OH that is necessary. To further demonstrate that HIF-1 hydroxylation is crucial for inhibiting ftn-1 expression, we used transgenic worms (i.e. the ZG583 strain [48]) expressing a HIF-1 mutant that contains a glycine amino acid residue instead of a proline in position 621. Proline621 is hydroxylated by EGL-9 at ambient O2 levels [14,49] and thus is essential for targeting HIF-1 to proteasomal degradation. Therefore, the HIF-1(P621G) protein is not hydroxylated by EGL-9 [14,48], and so remains stable at 21% O2. Similarly to egl-9(sa307) mutants, transgenic HIF-1(P621G) worms maintain high levels of ftn-1 at both 21% and 1% O2 (Fig. 5D), further supporting the conclusion that HIF-1-hydroxylation is essential for inhibiting ftn-1 expression.
2.9. FTN-1 protects against PA14 pathogenicity and oxidative stress
What are the physiological consequences of ftn-1 induction in hypoxia? To answer this question, we first set out to explore whether the changes we observed for ftn-1 at the level of mRNA are translated to the protein level. For this, we generated transgenic worms bearing the ftn-1(ok3625) deletion allele and a translation ftn-1 rescuing construct in which ftn-1 is driven by its own 5′ and 3′ UTR and fused to an mCherry tag at the carboxy-terminal end (Fig. 6A). In agreement with previous publications [8,9], we observed a strong fluorescent ftn-1::mCherry signal in the intestine (Fig. 6A). Exposure to 1% O2 for 6 h significantly increased the level of FTN-1 compared to control worms that remained at 21% O2 (Fig. 6B and C, upper and left panels, respectively) whereas adaptation to 21% O2 after 24 h exposure to 1% O2 resulted in decreased FTN-1 levels (Fig. 6B and C, lower and right panels, respectively). Together, the protein expression experiments recapitulated the microarray and qPCR data and therefore demonstrate that the changes observed at the RNA levels are translated to the protein level.
Fig. 6.

FTN-1 protects against PA14 toxicity and oxidative injury. (A) Transgenic ftn-1(ok3625) worms expressing an ftn-1 translational reporter. Scale bar: 50 μm. (B) Representative blots from at least four biological repeats are shown (for the 0–6 and 24.5–28 time points; upper and lower panels, respectively). Lysate from transgenic ftn-1::mCherry (indicated as “ftn-1::mCherry) and ftn-1(ok3625) mutants (indicated as “-”) were separated on a 12% SDS-PAGE gel and blotted with an anti-mCherry antibody. The Ponceau staining of the same gel is shown below the Western blot. Numbers on the left specify the protein molecular marker size in kDa. (C) Bar graphs showing the quantification of ftn-1::mCherry blot shown in (B). Asterisks indicate significance for comparisons with N2 animals at the beginning of the experiments (21% O2, time = 0; left side of the graph) and the significance for comparisons with N2 animals after 30 min at 21% O2 (post 24 h at 1% O2, time = 24.5; right side of the graph). Unpaired t-test with Welch's correction. Error bars represent SEM. *p < 0.05, **p < 0.01, ns = non-significant. These graphs represent the average of at least 4 biological repeats. Survival curves comparing the resistance of different worm strains to PA14 at 1% and 21% O2, (D and E, respectively). The survival of the worms was measured after 3, 6, and 24 h incubation at 25 °C. These graphs represent the average of nine independent experiments. Survival curves comparing the resistance of different worm strains to PQ at 1% and 21% O2, (F and G, respectively). The survival of the worms was measured after 3, 6, and 24 h incubation at 25 °C. These graphs represent the average of eight (1% O2) and twelve (21% O2) independent experiments. In D-G, P values indicate significance for comparisons with N2 worms. Log-rank (Mantel-Cox) test. Error bars represent SEM.
The intestine is usually the place in which worms encounter pathogenic bacteria [50] that can modulate their virulence profile in response to O2 [51,52]. Therefore, we asked whether the upregulation of ftn-1 in hypoxia can protect from Pseudomonas aeruginosa (PA14) bacteria-induced death. To explore this, we performed PA14 “fast” killing experiments (developed by Ausubell and colleagues [53,54] and modified by us [19]) under hypoxic conditions (in which ftn-1 levels are high). In brief, we pre-exposed N2 worms, ftn-1(ok3625) mutants, and ftn-1::mCherry transgenic worms to 1% O2 for 24 h (from their L2 until the late-L4 stage). We were concerned about the possibility that the ftn-1::mCherry fusion protein will not function to its full potential. Therefore, we generated the ftn-1(ok3625) mutants expressing ftn-1(wt) in a polycistronic construct in which the ftn-1 and mCherry are not physically connected (hereafter referred to as polycistronic::ftn-1 strain). After 24 h, the four strains were transferred to PA14 fast killing plates and the survival of worms was monitored after 3, 6, and 24 h. Importantly, all of the procedures were done at 1% O2, 25 °C. Therefore, we verified that ftn-1 expression is induced at this temperature (after 6 h at 1% O2) at both the mRNA and protein level (Supplementary Fig. 8A, and B,C, respectively).
The survival of ftn-1(ok3625) mutants was significantly lower compared to N2 control (Fig. 6D), indicating that FTN-1 is important for protecting against PA14 in hypoxia. Indeed, the ftn-1::mCherry rescuing strain displayed similar survival compared to N2 and the polycistronic::ftn-1 rescuing strain was even more resistant than N2 worms, suggesting that overexpression of ftn-1 may further increase the resistance to PA14. In addition to the hypoxic-PA14 experiments, we did experiments at 21% O2; a condition in which ftn-1 levels are lower compared to 1% O2. Similarly to the hypoxic conditions, the resistance of N2 worms to PA14 was significantly higher compared to ftn-1(ok3625) mutants (Fig. 6E). The survival of the two ftn-1 rescuing strains was significantly lower than that of the N2 controls at 21% O2. This result is surprising because these strains display full-rescue (and beyond) at 1% O2. Therefore, it could be that the rescuing constructs lack certain regulatory elements that are important for ftn-1 expression at 21% O2 but not in hypoxia. Notably, the four worm strains were less vulnerable to PA14 at 21% O2 compared to 1% O2. The underlying reason could be either due to increased PA14-virulence at 1% O2 or from increased sensitivity of worms to PA14 (at 1% O2) or both. The answer to this question is beyond the scope of this study. PA14 bacteria can induce oxidative injury through the production of pyocyanin and pyochelin [2,55]. Therefore, we asked whether FTN-1 protects from PA14 by acting as an antioxidant. To explore this, we exposed N2, ftn-1(ok3625), and polycistronic::ftn-1 worms to the superoxide generator paraquat (PQ) [56,57] and measure their survival at 1% and 21% O2 after 3, 6, and 24 h. Notably, similarly to the PA14 experiments, these experiments were done at 25 °C. The survival of ftn-1(ok3625) mutants was significantly lower compared to N2 controls at both 1% and 21% O2 (Fig. 6F and G, respectively). Moreover, the transgenic polycistronic::ftn-1 strain was as resistant to PA14 as N2 worms (at 1% and 21% O2). Together, these results demonstrate that FTN-1 is a potent antioxidant and suggest that this antioxidant activity underlies its protective effect against PA14.
3. Discussion
3.1. The function of neurons in communicating O2 and iron-homeostasis
O2 and iron metabolisms are intimately linked, and therefore should be tightly coordinated within and between cells and tissues. However, how is this achieved is still poorly understood. Here, we take a step toward advancing this understanding. Our data suggest that the O2-sensing neurons AQR, PQR, and URX send an inhibitory signal that suppresses intestinal ftn-1 expression at 21% O2. This signal is transmitted by neurotransmitter and neuropeptide signalling by a yet to be determined signalling pathway. The anatomy of AQR, PQR, and URX is well suited for this function, as they are located in the fluid-filled body cavity of the worm, i.e. pseudocoelom [58]. Thus, these neurons can communicate external and internal cues (e.g. O2 and nutrient) between different tissues. The communication between AQR, PQR, and URX and the intestine is not restricted to iron-homeostasis. Recent studies by Srinivasan and colleagues discover an intestine-URX communication axis that fine-tunes lipid metabolism in response to O2 [59,60]. Moreover, previous studies from the Aballay laboratory show that AQR, PQR, and URX regulate the innate immune response against PA14, in which intestinal genes are involved [61]. It is intriguing to speculate that these examples present the tip of the iceberg and that AQR, PQR, and URX modulate many other physiological processes, across different tissues, in response to changes in O2 level.
3.2. The function of soluble guanylate cyclases in ftn-1 regulation
Soluble guanylate cyclases (sGCs) play a crucial role in regulating diverse and important physiological processes including platelet aggregation, blood circulation, and memory processing [[62], [63], [64]]. Here, we show that sGCs play an important role in intestinal iron homeostasis in C. elegans. The activation of AQR, PQR, and URX is mediated by gcy-35/gcy-36 [22,31]. Since these neurons suppress the expression of ftn-1 at 21% O2, it is expected that deletion mutations in gcy-35/gcy-36 will result in ftn-1 induction at 21% O2. However, the importance of gcy-32, gcy-33, and gcy-34 is unexpected, since deletion mutations in these genes do not suppress the activation of URX at 21% O2 nor the avoidance response from 21% O2 [31,41]. Moreover, gcy-32, 33, 34, 35, and gcy-36 appear to have a distinct function in ftn-1 regulation. Otherwise, we would not have noticed the individual mutations’ phenotypes. Therefore, our data suggest that the function of these sGCs in AQR, PQR, and URX is more complex than previously thought. To our knowledge, the interaction between C. elegans sGCs had never been demonstrated biochemically. However, genetic and calcium imaging experiments suggest that the following complexes occur in vivo, i.e. GCY-31/GCY-33 [31,65], GCY-32/GCY-34 [41], and the GCY-35/GCY-36 [23,40]. Our Y2H experiments suggest that additional interaction may occur in vivo, i.e. GCY-32/GCY-35, GCY-33/GCY-35, and GCY-34/GCY-36. With that said, the Y2H results should be interpreted with caution for the following reasons: (1) The experiments were performed in a cellular environment/protein copy number that is different from the native one (2) We included the native carboxy-terminal CAAX prenylation sequence found in these sGCs [21,66]. However, this targeting sequence is conserved in yeast and therefore may interfere with the translocation of proteins to the nucleus. As a result, we may underestimate the strength of the sGC interaction and/or fail to detect weaker interactions (3) It could be that other C. elegans proteins (non-sGC) regulate the specificity of interaction and this cannot be recapitulated in yeast. In the future, it will be important to explore whether these interactions occur in vivo and to determine their physiological importance. Moreover, it will be important to explore whether sGCs regulate iron-homeostasis in mammals in response to changes in O2 level. In this respect, a recent study shows that a soluble guanylate cyclase, Gucy1b2, acts as an O2-sensor in mouse sensory neurons [67]. Gucy1b2 shares high sequence homology with GCY-33. Moreover, similarly to most of the C. elegans sGCs (all apart from GCY-31), it contains a CAAX sequence motif that targets the protein to the membrane (through cysteine prenylation [68]). We anticipate that our studies will inspire the exploration of Gucy1b2 function in iron metabolism in normoxic and hypoxic conditions.
3.3. ftn-1 regulation by HIF-1
A recent study by Sternberg and colleagues presented an exciting working model in which non-hydroxylated HIF-1 acts as an ftn-1 activator while HIF-1-OH acts as a repressor [18]. Our results support the hypothesis about the inhibitory activity of HIF-1-OH. Mutations that stabilize non-hydroxylated HIF-1 (i.e. egl-9(sa307) and HIF-1(P621G)) lead to constitutive induction of ftn-1 expression, whereas a mutation that stabilized HIF-1-OH (i.e. vhl-1(ok161)) results in constitutive inhibition of ftn-1 expression (Fig. 5C and D). However, our results and previous studies from the Gems [12] and Leibold [11] laboratories do not support the hypothesis that non-hydroxylated HIF-1 is an ftn-1 activator because the hif-1(ia04) deletion mutation increases the expression of ftn-1 at 21% O2 (Fig. 5A). Therefore, we would like to suggest a modified working model (Fig. 7) in which we embrace the idea that HIF-1-OH acts as an ftn-1 suppressor (as suggested by Sternberg and colleagues) while rejecting the idea that non-hydroxylated HIF-1 is important for the induction of ftn-1 expression.
Fig. 7.

A model for ftn-1 regulation by HIF-1. At 21% O2, HIF-1 is targeted to degradation via the activity of EGL-9 and VHL-1. However, some hydroxylated HIF-1 (HIF-1-OH) escapes degradation and acts to suppress ftn-1 expression. At 1% O2, HIF-1 is accumulated in its non-hydroxylated form. Therefore, ftn-1 expression is not inhibited. We hypothesize that ftn-1 expression is induced by a yet-to-be-identified transcription factor.
Notably, Sternberg's original model and the model we present here are based on the hypothesis that although the majority of HIF-1-OH is targeted to proteasomal degradation at 21% O2, there are enough remaining molecules to regulate gene expression. The experimental data supporting this hypothesis include the finding that C. elegans HIF-1 regulates the function of 1075 genes at 21% O2 [18]. Moreover, mammalian HIF-1α is known to be regulated by various stimuli including LPS [69], angiotensin II, and thrombin under normoxic conditions, in which PHDs are active [70]. Therefore, we believe that it is valid to suggest that HIF-1-OH is important for gene expression regulation at 21% O2. However, that being said, we acknowledge that biochemical studies are needed in order to elucidate the molecular mechanism by which HIF-1-OH suppresses ftn-1 expression and for finding the activator of ftn-1 in hypoxia.
4. Materials and methods
4.1. Strains
| EVG | Reagent or Resource | Source | Identifier |
|---|---|---|---|
| EVG002 | vhl-1(ok161) X | CGC | EVG002 (Parental strainCB5602) |
| EVG005 | lin-15B&lin-15A(n765); qaIs2241[gcy-36::egl-1 + gcy-35::GFP + lin-15(+)] X | CGC | EVG005 (Parental strain CX7102) |
| EVG009 | glb-5(Haw) V; npr-1(ad609) X | CGC | EVG009 (Parental strain AX1891) |
| EVG031 | tax-4(p678) III | CGC | EVG031 (Parental strain PR678) |
| EVG034 | npr-1 (ad609) X | CGC | EVG034 (Parental strain AX204) |
| EVG037 | N2 | CGC | EVG037 |
| EVG043 | hif-1(ia04) V | CGC | EVG043 (Parental strain ZG31) |
| EVG061 | glb-5(Haw) V; npr-1(ad609) X; gaIs148[Pges-1::FLAG::PAB-1 + Psur-5::GFP] | Gross lab | EVG061 (Parental strain AX1891, SD1084) |
| EVG350 | gcy-33(ok232) V | CGC | EVG350 (Parental strain AX326) |
| EVG351 | gcy-35(ok769) I | CGC | EVG351 (Parental strain AX1295) |
| EVG381 | tax-4(ks28) III | CGC | EVG381 (Parental strain Fk103) |
| EVG385 | ftn-1(ok3625) V | CGC | EVG385 (Parental strain RB2603) |
| EVG441 | gcy-36(ok2208) X | CGC | EVG441 (Parental strain RB1729) |
| EVG470 | egl-9(sa307) V | CGC | EVG470 (Parental strain JT307) |
| EVG558 | gcy-32(ok995) V | CGC | EVG558 (Parental strain RB1048) |
| EVG630 | gcy-31(ok296) X | CGC | EVG630 (Parental strain RB564) |
| EVG688 | unc-13(e450) I | CGC | EVG688 (Parental strain CB450) |
| EVG701 | unc-31 (e928) IV | CGC | EVG701 (Parental strain CB928) |
| EVG708 | ftn-1 (ok3625) V; heb18Ex[Pftn-1::ftn-1 (genomic)-mCherry: ftn-1 3′utr[ | This study | EVG708 (Parental strain RB2603) |
| EVG862 | unc-17(e245) IV | CGC | EVG862 (Parental strain CB933) |
| EVG870 | egl-3(n150) V. | CGC | EVG904 (Parental strain MT150) |
| EVG881 | tax-2(ok3403) I | CGC | EVG881 (Parental strain RB2464) |
| EVG882 | tax-2(p671) I; tax-4(p678) III | CGC | EVG882 (Parental strain BR5514) |
| EVG1022 | gcy-34(ok2953) V | CGC | EVG1022 (Parental strain VC2486) |
| EVG1034 | gcy-37(ok384) IV | CGC | EVG1034 (Parental strain RB626) |
| EVG1154 | cng-1(jh111) V | CGC | EVG1154 (Parental strain Kj461) |
| EVG1155 | tax-4(p678) III; cng-1(jh111) V | CGC | EVG1155 (Parental strain Kj5559) |
| EVG1175 | ftn-1 (ok3625) V;heb19Ex[Pftn-1::ftn-1 (genomic)-polycis -mCherry: ftn-1 3′utr] | This study | EVG1175 (Parental strain RB2903) |
| EVG1196 | hif-1(ia04) V; iaIs34[Phif-1::hif-1a(P621G)::tag + unc-119(+)] | CGC | EVG1196 (Parental strain ZG583) |
| EVG1304 | cha-1(p1152) IV | The Trenin laboratory |
4.2. Maintenance and handling of C. elegans strains
Except were indicated, C. elegans strains were grown under standard laboratory conditions [29] in 35 mm Petri dishes containing 4 ml of nematode growth medium (NGM)-agar seeded with 250 μl OP50 bacteria. The strains we used in this study are listed above. These strains were either generated in this study, using our own laboratory N2 strain or outcrossed with it at least three times.
4.3. Worm synchronization
To generate synchronized worms, we collected eggs from gravid hermaphrodites using hypochlorite solution [29]. In brief, gravid hermaphrodites were collected into 15 ml tubes by washing the NGM plates three times with M9 buffer (22 mM KH2PO4, 42 mM Na2HPO4, 86 mM NaCl, and 1 mM MgSO4). Tubes were centrifuged for 1 min (1690×g, 1min) and the supernatant was removed until 1 ml of volume remained. Then, we added 1 ml of hypochlorite solution (0.5 N NaOH, 1.25% NaOCl) to each tube and inverted it five times. To assist the release of embryos, we used a syringe with a 21-gauge needle and aspirated the worm suspensions back and forth several times. After 3 min, the embryos were sedimented by centrifugation (1690×g for 2 min), and most of the hypochlorite solution was removed. Each tube was washed 3 times with 5 ml of M9 buffer. Next, we removed most of the M9 buffer (without disturbing the embryos pellet) and added 2 ml of fresh M9 buffer to each tube. The tubes were rotated for 16 h at room temperature (RT, 21 °C). The hatched L1 larvae were collected by centrifugation (1690×g for 3 min), counted, and transferred to seeded NGM plate and grown until the desired developmental stage.
4.4. RNA purification & qPCR
We collected the worms with PBS buffer (137 mM NaCl, 2.7 mMKCl, 10 mM Na2HPO4, 1.8 mM KH2PO4, pH 7.4; 4 washes) at four time points: at the beginning of the experiments (T = 0, synchronized L4 hermaphrodites), 6 h after the exposure to either 1% O2 or 21% O2 as a control (T = 6), and 30 min and 4 h post returning to 21% O2 (after 24 h at 1% O2), i.e. T = 24.5 and 28, respectively. Hypoxia exposure (1% O2) was performed using a custom-made Coy hypoxia chamber (COY Lab Products Inc., Grass Lake, MI, USA). We centrifuged the worms (1690 g for 2 min), replaced the PBS buffer with 200 μl of TRIzol reagent (include in the TriRNA Pure Kit, Geneaid), and froze the tubes overnight at −80 °C. Then, we thawed the tubes on ice, added 0.1 g of Bullet Blender® pink beads (Next Advance, Inc.) to each of the Eppendorf tubes, and homogenized the worms using Bullet Blender® Homogenizer Cell Disrupter (Next Advance, Inc.). Total RNA was isolated from the lysates using GENEzol™ TriRNA Pure Kit (Geneaid, IM -GZXD200). The elution was performed with RNase-free water and RNA concentration and purity were determined with a NanoDrop spectrophotometer. RNA samples were reverse-transcribed to complementary DNA using qScript™ cDNA Synthesis Kit (Quanta bio, #95047). Each reaction contained 1 μg RNA in a total volume of 20 μl. Quantitative Real-Time PCR was performed with iTaq™ Universal SYBR® Green Supermix (Bio-Rad, #172–5124) and using CFX Connect™ Real-Time PCR Detection System (Bio-Rad). Each 12 μl-reaction contained 2 μl of 1/10 diluted cDNA and was performed in triplicate. Melting curves of all reaction products were checked to validate amplification quality and specificity. At least three independent biological repeats were performed for each experiment, in which RNA was extracted from separately-grown worms at different days. Expression of the genes ned-8 and ubq-2 were found to be stable throughout the different time points in our experiments, and they were used as reference genes. The efficiency of target and reference genes was checked with a standard curve and used in fold-change calculations. Expression of target genes was normalized against the reference genes and expression level of all genes in control samples was set to 0 (i.e. Log2(1)); the 0 and 24.5 h samples were used as controls for measuring gene induction at 6 h and 28 h respectively. All analysis and normalizations were performed with Bio-Rad CFX Manager 3.1 software. PCR amplification protocol: one cycle of 3 min at 95 °C followed by 40 cycles of 10 s at 95 °C and 30 s at 66 °C.
Primers are listed in Table 1.
Table 1.
qPCR primers.
| col-137 | For GATTTCTGCCAACATCGGAC Rev CGGTATGACGTTTGTTGGTTG |
|---|---|
| f22b5.4 | For CTCGTAATTGGTCAAGAGATC Rev GTGGATATACTTCATAAGCGTG |
| fat-3 | For CATTGATTGGCTTTGGGGTG Rev GACGAGGTAAGGAAGATTATTC |
| ftn-1 | For CTATCACGATGAAGTCGAAGC Rev GGCAATGTTCCGAAGTGCG |
| gpdh-1 | For GGTGACAACGGATTATGAGG Rev GTCCCAGACGGATGATAGC |
| ned-8 | For CGAACCAAATGATCGAGTCG Rev CTTGTAATCTGCTGCTGTCTTG |
| trx-3 | For GTACTTCTCTGCAAGCTGGT Rev CAACAGAATCACCTCAATGGG |
| ubq-2 | For GGAATCCCACCAGATCAGC Rev GGAGAGATGGCTCGATGATTC |
| zip-8 | For GAGCACACTACCCGCAAATG Rev GGAGGTATTTGGAGAGCGTG |
4.5. Microarray experiments
The mRNA purification and amplification procedure, and the microarray raw-data processing and analysis were previously described in Ref. [19]. Normalized data are deposited in the National Center for Biotechnology Information Gene Expression Omnibus (accession number GSE93149). We assessed the specificity of our mRNA pull-downs as described in Ref. [19]. In brief, we downloaded all the available expression patterns of genes present on our array from WormMine (WS250). We defined genes as “intestinal” if their expression pattern description contained the words “intestinal”, “intestine”, or “gut”. We compared the relative abundance of intestinal genes in intestinal-enrichment list to their relative abundance in background (all genome). Analysis was performed with Microsoft Excel.
4.6. Immunofluorescence
The immunohistochemistry experiments were performed as previously described in Ref. [19] and according to Nonet et al. [71] with some modifications (see below). For each immunostaining experiment, ~2000 hermaphrodites were washed off NGM plates with M9 buffer (22 mM KH2PO4, 42 mM Na2HPO4, 86 mM NaCl, and 1 mM MgSO4). To fix the worms, we added ice-cold mix of 400 μl methanol, 400 μl Bouin's fixative and 10 μl of β-mercaptoethanol to worm pellets. Samples were flash-frozen by immersion in liquid nitrogen and melted in tap water. Tubes were incubated for 30 min at RT with agitation. After rehydration in BO3 buffer with 0.5% Triton X-100 and 2% β-mercaptoethanol, worms were incubated for additional 2 h. Worms were washed with BO3 buffer with 0.5% Triton X-100 and then rinsed with ABA buffer (PBS, pH 7.4 with 0.01% Tween-20, 1 mM EDTA, and 0.1% sodium dodecyl sulfate (SDS)). Samples were blocked by ABA with 2% w/v BSA and 1 g/ml skimmed milk. Blocking was removed by ABB (PBS, pH 7.4 with 0.01% Tween-20, 1 mM EDTA, 0.1% SDS, and 2% w/v BSA), and then incubated with 70 μl of diluted 1:400 anti-FLAG M2 monoclonal antibody (Sigma-Aldrich, cat# F1804) for ~16 h at 4 °C with agitation. Then, worms were washed three times with ABB, incubated for 2 h at 4 °C with rotation, and washed three more times with ABB. Cy3 anti-mouse secondary antibody (Sigma-Aldrich, cat# C2181) was used at 1:200 dilution in Dako diluent for 1 h at RT. After three washes with ABB, worms were mounted on a 1.8% agar pad with a fluorescent antifade solution (GBI Labs, cat# E18-100) and covered with a coverslip. Images were captured using Olympus IX71 fluorescent microscope at 40 X and additional X1.6 magnifications. Microscope acquisition, device control, and image analysis were performed with MetaMorph® software.
4.7. Molecular biology
All molecular manipulations were done according to standard protocols [72].
Genotyping: The deletion alleles used in this study were confirmed by PCR using primers that flank the deletion region (as described in Ref. [19]). To confirm the ftn-1 (ok3625), deletion allele we used three primers:
-
(1)
F291: 5′ CAAGAACCCTTTCGTTGCCAATATGTAATG 3′
-
(2)
R1600: 5′ CACCTTATGTGTCTCAGATTTCCGCCAC 3′
-
(3)
R980: 5′ GATAGATAGACATAGGAGGCGTAGAGTTC 3′
The expected PCR products of the F291/R1600 reaction are 1309bp and 815bp in wild type and ftn-1 (ok3625) mutant worms, respectively. The expected PCR products of the F291/R980 reaction in wild type worms is 689 bp, whereas no product is expected in ftn-1 (ok3625) mutants. The relative location of the primers and the deletion sequence are indicated in Supplementary Fig. 9.
Transgene: the EVG061 strain was generated by crossing the parental strain SD1084 with glb-5( + );npr-1(−) worms, as described in details in Ref. [19]. The ftn-1 rescuing plasmids were generated using a modified polycistronicmCherry pPD95.75 expression vector [21]. To generate the translational ftn-1::mCherryconstructs, we amplified the promoter and 3′ UTR sequences of ftn-1 (~5.33 kb and ~1.7 kb, respectively) using N2 genomic DNA as a template. The promoter region was amplified with the.
5′ GTACGAATCCGGACTACAATCGTAATAGACTTGATTCAATTTTAAATAC 3′ and 5′ GTGGGTTCCTAGGGACGATTTACTTGGCAGAAAATATAATGACT 3′ primers and inserted at the BspEI and AvrII restriction sites. The ftn-1 3′ UTR sequence was amplified using the 5′ GTACGAAGGTACCTAATTTTTATTTGATGTATTTATTGTACATATGGATGAAATTG 3′ and 5′ GTACGAAACTAGTCTGCAAATTTTCAAATTTTTAGGTAAAAAAACCTATCAAAC 3′ primers and inserted at the KpnI and SpeI restriction sites. The genomic sequence of ftn-1 was first fused to an mCherry sequences (at the 3′ end) using PCR fusion [73] (the primers are listed in Table 2 below). The ftn-1::mCherry sequence was then amplified using the 5′ GTACGAACCTAGGAAAATATAATGTCTCTAGCTCGTCAAAACTATCACGATG 3′
Table 2.
Fusion primers.
| ftn-1::mCherry fusion | |
|---|---|
| A - ftn-1mC F | 5′ CGTCATGTCTCTAGCTCGTCAAAACTATC 3′ |
| B - ftn-1mC R | 5′ GAGAATATTTGTTCGACAAAGAGGAATTTTCTGAT 3′ |
| C - ftn-1mC F | 5′ GTTCGACAAAGAGGAATTTTCTGATAGCGGCCGCGTGAGCAAGGGCGAGGAGGACAACATG 3′ |
| D - ftn-1mC R | 5′ GCATGGACGAGCTGTACAAGTAAGAATTCC 3′ |
| Ap - ftn-1mC F | 5′ GTACGAACCTAGGAAAATATAATGTCTCTAGCTCGTCAAAACTATCACG 3′ |
| Dp - ftn-1mC R | 5′ CGGCATGGACGAGCTGTACAAGTAAGGTACCTTCGTAC 3′ |
| ftn-1::polycistronicmCherry | |
| A - ftn-1PC F | 5′ CTGCCAAGTAAATCGTCCCTAGGAAAATATAATGTCTCTAGCTCGTCAAAACTATCACG 3′ |
| B - ftn-1PC R | 5′ GTTAACTAGGTGAAAGTAGGATGAGACAGCTTAATCAGAAAATTCCTCTTTGTCGAACAAATATTCTC 3′ |
| C - ftn-1PC F | 5′ GCTGTCTCATCCTACTTTCACCTAGTTAAC 3′ |
| D - ftn-1PC R | 5′ TCCTCGCCCTTGCTCACGCGGCCGCCCATTATATTTTAGATCTGTACAGCAGTTTCCCTGAAT 3′ |
| Ap - ftn-1PC F | 5′ AAGTAAATCGTCCCTAGGAAAATATAATGTCTCTAGCTCGTCAAAACTATCACG3′ |
| Dp - ftn-1PC R | 5′ GCCCTTGCTCACGCGGCCGCCCATTATATTTTAGATCTGTACAGCAGTTTCCCTGAAT 3′ |
5′ GTACGAAGGTACCTTACTTGTACAGCTCGTCCATGCCG 3′ primers [74]. [74],and inserted at the AvrII and KpnI restriction sites. Microinjections were performed as described previously [75]. The resulted ftn-1::mCherry construct was injected to ftn-1(ok3625) worms with the PF15E11.1::GFP co-injection marker at 2.5 ng/μL and 47.5 ng/μL, respectively.
The ftn-1::mCherry fusion construct was used to generate the ftn-1:polycistronicmCherry construct. In essence, we just replaced the ftn-1 genomic sequence that did not have a stop codon (since it is in frame with the mCherry sequence) with a genomic ftn-1 sequence that contains a stop codon and is fused to a polycistronic sequence [21]. For this, we first generated an ftn-1::polycistronic fusion using PCR fusion (the primers are listed in Table 2). Then, we amplified the ftn-1::polycistronic sequence with the 5′ AAGTAAATCGTCCCTAGGAAAATATAATGTCTCTAGCTCGTCAAAACTATCACG 3′ and.
5′ GCCCTTGCTCACGCGGCCGCCCATTATATTTTAGATCTGTACAGCAGTTTCCCTGAAT 3′ Primers, and inserted the sequence at the AvrII and NotI restriction sites. The resulted ftn-1::polycistronic::mCherry construct was injected to ftn-1(ok3625) worms with the ccGFP co-injection marker at 20 ng/μL and 25 ng/μL, respectively.
4.8. Lysate preparation and immunoblotting
Worms were synchronized as described above and collected from plates at the indicated time points. We collected the worms (~3000 for each time point) into Eppendorf tubes by washing them from plates with double-distilled water (DDW). The tubes were centrifuged at 1690 g for 2 min and washed twice with DDW. The supernatant was removed until 100 μl were left. Then, we added 100 μl of 0.2 M NaOH to each tube and incubated them for 5 min at RT. The tubes were centrifuged at 1690 g for 2 min, and the supernatant was aspirated. Then, we added 100 μl SDS buffer (60 mM TRIS, 6.8, 5% glycerol, 2% SDS) and 0.1 g of Bullet Blender® pink beads (Next Advance, Inc.) to each tube. And put the tubes at −80 °C for at list 30 min. Then, we incubated the tubes at 95 °C for 3 min, homogenized them at 4 °C for 5 min using Bullet Blender Homogenizer Cell Disrupter (Next Advance), and sonicated them with a bath sonicator (digita ultrasonic cleaner 2.5L, citizen) for 8 min at 42 KHz. We then centrifuge the tubes at 1690 g for 2 min and transferred each of the supernatants to a new tube. Protein concentration was determined using the Pierce™ BCA protein assay kit (Thermo fisher scientific, cat# 23227). Equal amounts of protein lysate (9.5 μg/lane) were resolved by 12% SDS-polyacrylamide gel electrophoresis (PAGE) and electrophoretically transferred to nitrocellulose membrane (70 V for 90 min in an ice bucket that was put at 4 °C). Prior to the incubation with the primary anti-mCherry antibody (Abcam,ab183628), we stained the gel with Ponceau S solution (0.1% w/v Ponceau S in 1% v/v acetic acid) for 20 min. The densitometry of the Ponceau staining was used as a loading control to normalize the mCherry staining density. We completely removed the Ponceau stain by rinsing the membrane with DDW. Then, the membranes were washed with TBST buffer (0.02 M Tris/HCl at pH = 7.4, 0.15 M NaCl, and 0.2% Tween-20), and blocked in the same buffer containing 5% skim milk for 1 h at RT. Then, the membranes were incubated with primary antibody (Abcam,ab183628, diluted in the same blocking buffer, 1:4000) for ~16 h at 4 °C. After 3 washes with TBST buffer, we added the secondary antibody Anti-rabbit IgG, HRP-coupled Antibody (Cell Signalling, #7074, diluted in blocking buffer, 1:3000) and incubated the membranes at RT for 1 h. Finally, we washed the membranes (three times) with TBST buffer and used enhanced chemiluminescence reagent (Thermo fisher scientific, cat#34078) to detect immunoreactive bands. Images were acquired with the BIO-RAD gel doc XR (ChemiDocTM XRS+) and analyzed with the ImageJ software [76].
4.9. PA14 fast killing assay
The PA14 fast killing assay was conducted as described in Ref. [19], with some modifications. In brief, a single PA14 bacteria colony was grown in Kings B Medium (2% bacto-peptone, 1% glycerol, 0.15% K2HPO4, (pH 7.2), and 6.09 mM MgSO4) supplemented with 100 μg/ml ampicillin to an OD600 of ~0.6.25 μl of PA14 culture were evenly spread on a 3.5 cm plate containing 4 mL of PGS agar (1% bacto-peptone, 1% glucose, 1% NaCl, 75 mM sorbitol, 1.7% bacto-agar) and let dry for 2 days at RT. The seeded plates were wrapped with parafilm and incubated at 37 °C for 24 h. After 24 h, the plates were cooled at RT before use (~1 h before the experiment). Notably, we only used plates in which the bacteria covered the entire surface of the agar. At the day of the experiment, we placed 20 L4 staged hermaphrodites in the plates and scored their survival after 3, 6, 9, and 24 h. Worms were counted as dead on the basis of lack of any movement and failure to respond to a gentle poke in the head and tail regions with a platinum wire (adapted from Gems and Riddle [77]). Worms that displayed internal progeny hatching (worm bagging), ruptured, burrowed in the agar, or crawled off the plates were censored. However, they were included in the survival data analysis as censored animals (as described in Lee et al. [78]). Importantly, we performed the PA14 experiments under 1% and 21% O2 conditions. In both cases, the experiments were performed at 25 °C and the worms were pre-exposed to 25 °C from the L2 larval stage (at the relevant O2 condition, 1% and 21% O2, respectively). It is important to emphasize that in the hypoxic experiments we monitored the survival of worms with a microscope that was put inside the hypoxia chamber. Therefore, the worms did not experience 21% O2 throughout the assay. The 1% and 21% O2 PA14 assays included nine biological replicates., and at least 100 worms were assayed in each condition.
4.10. Yeast two-hybrid interaction assay
We used the MatchmakerTMGold Yeast two-hybrid system to investigate physical interaction between soluble guanylate cyclases (sGCs). In brief, the coding DNA (cDNA) sequences of gcy-33, gcy-34, and gcy-35 were cloned into pGBKT7, transformed into Y2HGold yeast cells, and grown on selective -Trp plates (according to Clontech Laboratories’ manual). Positive and negative control vectors, pGBKT7-53 and pGBKT7-Lam were transformed into Y2HGold yeast cells and grown under the same conditions. The cDNAs of gcy-31, gcy-32gcy-33, gcy-35, and gcy-36 were cloned into pGADT7, transformed into yeast strain Y187, and grown on selective -Leu plates. The negative control vector, pGADT7-T was also transformed into yeast strain Y187, and grown on selective -Leu plates. To generate Y2HGold/Y187 diploids, positive colonies from the -Trp and -Leu plates were mixed with a toothpick on a YPDA plate, and grown at 30 °C overnight. Y2HGold/Y187 diploids were streaked onto -Trp/Leu double-selection plates and grown for 3–4 days at 30 °C. We grew colonies in 3 ml of -Trp/-Leu liquid culture for ~16 h (overnight). We put 5 μl of diluted and undiluted diploid suspensions on -Trp/-Leu/0.16 μg/ml Aureobasidin A, 40 μg/ml X-α-Gal selective plates at 25 °C. In addition, we put the same amount of diluted/non-diluted diploid suspension on -Trp/-Leu plates as a control. Colony growth was monitored after 5–7 days to detect protein interaction.
4.11. Paraquat (PQ) resistance assay
We performed these experiments under 1% and 21% O2at 25 °C (similarly to the PA14 assays). Synchronized L2 worms were put at either 1% and 21% O2 at 25 °C until they got to the L4 stage. (similarly to the PA14 assays). Approximately 100 L4 larvae were washed twice with M9 buffer and put in 96-well plates (~12 worms per well) containing either 100 μl of 200 mM paraquat (Methyl viologen dichloride hydrate, Sigma Aldrich, #856177) (in M9 buffer) or M9 buffer as a control. The plates were incubated at 25 °C on a shaker at 350 rpm. The survival of worms was measured after 3, 6, and 24 h. We performed 8 (at 1% O2) and 12 (at 21% O2) independent assays for each strain. The total number of worms in each experiment was at least 120.
4.12. Bioinformatic methods
Data filtering was performed as described in Ref. [19]. In brief, we included genes that are either up/down-regulated by at least 1.7 fold (Log2) and have a fluorescence read of at least 5000 intensity units in at least one of the paired time-points. Clustering was performed with Partek Genomics Suite 6.6 software using the K-mean clustering algorithm. K-means clustering aims to partition n observations into k clusters in which each observation belongs to the cluster with the nearest mean. Heat maps were generated using GraphPad Prism version 8.0.2 for Windows, GraphPad Software, San Diego, California USA, www.graphpad.com. We performed GO Terms analysis for each of the six gene-clusters using the Gorilla software [79,80]. In this analysis, the entire set of 21,268 C. elegans genes present on the array was used as background and the P-value threshold was lower than <10−3. The specificity of the intestinal mRNA pulldown was analyzed as described in Ref. [19].
Declaration of competing interest
The authors declare that they have no conflict of interest.
Acknowledgments
We thank Gillian Kay for critical reading of the manuscript and the Gross laboratory members for comments and advice. We thank Prof. Millet Treinin for providing the cha-1(p1152) strain. Some strains were provided by the CGC, which is funded by the National Institutes of Health Office of Research Infrastructure Programs (P40 OD010440). This research was supported by the ISRAEL SCIENCE FOUNDATION (grant No. 989/19), the Israel Cancer Association, grant # 20190024, and the European Research Council under the European Union's Seventh Framework Programme (FP/2007–2013)/ERC Grant Agreement no. 281844.
Footnotes
Supplementary data to this article can be found online at https://doi.org/10.1016/j.redox.2019.101359.
Appendix A. Supplementary data
The following are the Supplementary data to this article:
References
- 1.Halliwell Barry, John G. In: Free Radicals in Biology and Medicine. Gutteridge John., editor. Clarendon Press; Oxford: 2007. [Google Scholar]
- 2.Halliwell B. Reactive species and antioxidants. Redox biology is a fundamental theme of aerobic life. Plant Physiol. 2006;141(2):312–322. doi: 10.1104/pp.106.077073. [DOI] [PMC free article] [PubMed] [Google Scholar]
- 3.Winterbourn C.C. Toxicity of iron and hydrogen peroxide: the Fenton reaction. Toxicol. Lett. 1995;82–83:969–974. doi: 10.1016/0378-4274(95)03532-x. [DOI] [PubMed] [Google Scholar]
- 4.Chepelev N.L., Willmore W.G. Regulation of iron pathways in response to hypoxia. Free Radic. Biol. Med. 2011;50(6):645–666. doi: 10.1016/j.freeradbiomed.2010.12.023. [DOI] [PubMed] [Google Scholar]
- 5.Dixon S.J., Stockwell B.R. The role of iron and reactive oxygen species in cell death. Nat. Chem. Biol. 2014;10(1):9–17. doi: 10.1038/nchembio.1416. [DOI] [PubMed] [Google Scholar]
- 6.Andrews S.C. The Ferritin-like superfamily: evolution of the biological iron storeman from a rubrerythrin-like ancestor. Biochim. Biophys. Acta. 2010;1800(8):691–705. doi: 10.1016/j.bbagen.2010.05.010. [DOI] [PubMed] [Google Scholar]
- 7.Crichton R.R., Declercq J.P. X-ray structures of ferritins and related proteins. Biochim. Biophys. Acta. 2010;1800(8):706–718. doi: 10.1016/j.bbagen.2010.03.019. [DOI] [PubMed] [Google Scholar]
- 8.Kim Y.I., Cho J.H., J Yoo O., Ahnn J. Transcriptional regulation and life-span modulation of cytosolic aconitase and ferritin genes in C. elegans. J. Mol. Biol. 2004;342:421–433. doi: 10.1016/j.jmb.2004.07.036. [DOI] [PubMed] [Google Scholar]
- 9.Romney S.J., Thacker C., Leibold E.A. An iron enhancer element in the FTN-1 gene directs iron-dependent expression in Caenorhabditis elegans intestine. J. Biol. Chem. 2008;283(2):716–725. doi: 10.1074/jbc.M707043200. [DOI] [PubMed] [Google Scholar]
- 10.Anderson C.P., Leibold E.A. Mechanisms of iron metabolism in Caenorhabditis elegans. Front. Pharmacol. 2014;5:113. doi: 10.3389/fphar.2014.00113. [DOI] [PMC free article] [PubMed] [Google Scholar]
- 11.Romney S.J., Newman B.S., Thacker C., Leibold E.A. HIF-1 regulates iron homeostasis in Caenorhabditis elegans by activation and inhibition of genes involved in iron uptake and storage. PLoS Genet. 2011;7(12) doi: 10.1371/journal.pgen.1002394. [DOI] [PMC free article] [PubMed] [Google Scholar]
- 12.Ackerman D., Gems D. Insulin/IGF-1 and hypoxia signaling act in concert to regulate iron homeostasis in Caenorhabditis elegans. PLoS Genet. 2012;8(3) doi: 10.1371/journal.pgen.1002498. [DOI] [PMC free article] [PubMed] [Google Scholar]
- 13.Lahiri S., Semenza G., Prabhakar N.R. CRC Press; 2003. Oxygen Sensing: Responses and Adaption to Hypoxia. [Google Scholar]
- 14.Epstein A.C.R., Gleadle J.M., McNeill L.A., Hewitson K.S., O'Rourke J., Mole D.R., Mukherji M., Metzen E., Wilson M.I., Dhanda A., Tian Y.M., Masson N., Hamilton D.L., Jaakkola P., Barstead R., Hodgkin J., Maxwell P.H., Pugh C.W., Schofield C.J., Ratcliffe P.J. C-elegans EGL-9 and mammalian homologs define a family of dioxygenases that regulate HIF by prolyl hydroxylation. Cell. 2001;107(1):43–54. doi: 10.1016/s0092-8674(01)00507-4. [DOI] [PubMed] [Google Scholar]
- 15.Kaelin W.G., Jr. The von Hippel-Lindau tumour suppressor protein: O2 sensing and cancer. Nat. Rev. Cancer. 2008;8(11):865–873. doi: 10.1038/nrc2502. [DOI] [PubMed] [Google Scholar]
- 16.Peyssonnaux C., Nizet V., Johnson R.S. Role of the hypoxia inducible factors HIF in iron metabolism. Cell Cycle. 2008;7(1):28–32. doi: 10.4161/cc.7.1.5145. [DOI] [PubMed] [Google Scholar]
- 17.Jiang H., Guo R., Powell-Coffman J.A. The Caenorhabditis elegans hif-1 gene encodes a bHLH-PAS protein that is required for adaptation to hypoxia. Proc. Natl. Acad. Sci. U. S. A. 2001;98(14):7916–7921. doi: 10.1073/pnas.141234698. [DOI] [PMC free article] [PubMed] [Google Scholar]
- 18.Angeles-Albores D., Puckett Robinson C., Williams B.A., Wold B.J., Sternberg P.W. Reconstructing a metazoan genetic pathway with transcriptome-wide epistasis measurements. Proc. Natl. Acad. Sci. U. S. A. 2018;115(13):E2930–E2939. doi: 10.1073/pnas.1712387115. [DOI] [PMC free article] [PubMed] [Google Scholar]
- 19.Zuckerman B., Abergel Z., Zelmanovich V., Romero L., Abergel R., Livshits L., Smith Y., Gross E. Characterization of gene expression associated with the adaptation of the nematode C. elegans to hypoxia and reoxygenation stress reveals an unexpected function of the neuroglobin GLB-5 in innate immunity. Free Radic. Biol. Med. 2017;108:858–873. doi: 10.1016/j.freeradbiomed.2017.05.007. [DOI] [PubMed] [Google Scholar]
- 20.Persson A., Gross E., Laurent P., Busch K.E., Bretes H., de Bono M. Natural variation in a neural globin tunes oxygen sensing in wild Caenorhabditis elegans. Nature. 2009;458(7241):1030–1033. doi: 10.1038/nature07820. [DOI] [PubMed] [Google Scholar]
- 21.Gross E., Soltesz Z., Oda S., Zelmanovich V., Abergel Z., de Bono M. GLOBIN-5-Dependent O2 responses are regulated by PDL-1/PrBP that targets prenylated soluble guanylate cyclases to dendritic endings. J. Neurosci. : Off. J. Soc. Neurosci. 2014;34(50):16726–16738. doi: 10.1523/JNEUROSCI.5368-13.2014. [DOI] [PMC free article] [PubMed] [Google Scholar]
- 22.Abergel Z., Chatterjee A.K., Zuckerman B., Gross E. Regulation of neuronal oxygen responses in C. elegans is mediated through interactions between globin 5 and the H-NOX domains of soluble guanylate cyclases. J. Neurosci. : Official J. Soc. Neurosci. 2016;36(3):963–978. doi: 10.1523/JNEUROSCI.3170-15.2016. [DOI] [PMC free article] [PubMed] [Google Scholar]
- 23.Gray J.M., Karow D.S., Lu H., Chang A.J., Chang J.S., Ellis R.E., Marletta M.A., Bargmann C.I. Oxygen sensation and social feeding mediated by a C. elegans guanylate cyclase homologue. Nature. 2004;430(6997):317–322. doi: 10.1038/nature02714. [DOI] [PubMed] [Google Scholar]
- 24.McGhee J.D. The C. elegans intestine. WormBook. 2007:1–36. doi: 10.1895/wormbook.1.133.1. [DOI] [PMC free article] [PubMed] [Google Scholar]
- 25.Stutz K., Kaech A., Aebi M., Kunzler M., Hengartner M.O. Disruption of the C. elegans intestinal brush border by the fungal lectin CCL2 phenocopies dietary lectin toxicity in mammals. PLoS One. 2015;10(6) doi: 10.1371/journal.pone.0129381. [DOI] [PMC free article] [PubMed] [Google Scholar]
- 26.Coimbra-Costa D., Alva N., Duran M., Carbonell T., Rama R. Oxidative stress and apoptosis after acute respiratory hypoxia and reoxygenation in rat brain. Redox Biol. 2017;12:216–225. doi: 10.1016/j.redox.2017.02.014. [DOI] [PMC free article] [PubMed] [Google Scholar]
- 27.Busch K.E., Laurent P., Soltesz Z., Murphy R.J., Faivre O., Hedwig B., Thomas M., Smith H.L., de Bono M. Tonic signaling from O(2) sensors sets neural circuit activity and behavioral state. Nat. Neurosci. 2012;15(4):581–591. doi: 10.1038/nn.3061. [DOI] [PMC free article] [PubMed] [Google Scholar]
- 28.Chang A.J., Chronis N., Karow D.S., Marletta M.A., Bargmann C.I. A distributed chemosensory circuit for oxygen preference in C. elegans. PLoS Biol. 2006;4(9) doi: 10.1371/journal.pbio.0040274. e274. [DOI] [PMC free article] [PubMed] [Google Scholar]
- 29.Brenner S. The genetics of Caenorhabditis elegans. Genetics. 1974;77(1):71–94. doi: 10.1093/genetics/77.1.71. [DOI] [PMC free article] [PubMed] [Google Scholar]
- 30.Zhao Y., Long L., Xu W., Campbell R.F., Large E.E., Greene J.S., McGrath P.T. Changes to social feeding behaviors are not sufficient for fitness gains of the Caenorhabditis elegans N2 reference strain. Elife. 2018;7 doi: 10.7554/eLife.38675. [DOI] [PMC free article] [PubMed] [Google Scholar]
- 31.Zimmer M., Gray J.M., Pokala N., Chang A.J., Karow D.S., Marletta M.A., Hudson M.L., Morton D.B., Chronis N., Bargmann C.I. Neurons detect increases and decreases in oxygen levels using distinct guanylate cyclases. Neuron. 2009;61(6):865–879. doi: 10.1016/j.neuron.2009.02.013. [DOI] [PMC free article] [PubMed] [Google Scholar]
- 32.Chun L., Gong J., Yuan F., Zhang B., Liu H., Zheng T., Yu T., Xu X.Z.S., Liu J. Metabotropic GABA signalling modulates longevity in C. elegans. Nat. Commun. 2015;6 doi: 10.1038/ncomms9828. 8828. [DOI] [PMC free article] [PubMed] [Google Scholar]
- 33.Kohn R.E., Duerr J.S., McManus J.R., Duke A., Rakow T.L., Maruyama H., Moulder G., Maruyama I.N., Barstead R.J., Rand J.B. Expression of multiple UNC-13 proteins in the Caenorhabditis elegans nervous system. Mol. Biol. Cell. 2000;11(10):3441–3452. doi: 10.1091/mbc.11.10.3441. [DOI] [PMC free article] [PubMed] [Google Scholar]
- 34.Miller K.G., Alfonso A., Nguyen M., Crowell J.A., Johnson C.D., Rand J.B. A genetic selection for Caenorhabditis elegans synaptic transmission mutants. Proc. Natl. Acad. Sci. U. S. A. 1996;93(22):12593–12598. doi: 10.1073/pnas.93.22.12593. [DOI] [PMC free article] [PubMed] [Google Scholar]
- 35.Edwards S.L., Charlie N.K., Richmond J.E., Hegermann J., Eimer S., Miller K.G. Impaired dense core vesicle maturation in Caenorhabditis elegans mutants lacking Rab2. J. Cell Biol. 2009;186(6):881–895. doi: 10.1083/jcb.200902095. [DOI] [PMC free article] [PubMed] [Google Scholar]
- 36.Lackner M.R., Nurrish S.J., Kaplan J.M. Facilitation of synaptic transmission by EGL-30 Gqalpha and EGL-8 PLCbeta: DAG binding to UNC-13 is required to stimulate acetylcholine release. Neuron. 1999;24(2):335–346. doi: 10.1016/s0896-6273(00)80848-x. [DOI] [PubMed] [Google Scholar]
- 37.Rand J.B., Russell R.L. Choline acetyltransferase-deficient mutants of the nematode Caenorhabditis elegans. Genetics. 1984;106(2):227–248. doi: 10.1093/genetics/106.2.227. [DOI] [PMC free article] [PubMed] [Google Scholar]
- 38.Alfonso A., Grundahl K., Duerr J.S., Han H.P., Rand J.B. The Caenorhabditis elegans unc-17 gene: a putative vesicular acetylcholine transporter. Science. 1993;261(5121):617–619. doi: 10.1126/science.8342028. [DOI] [PubMed] [Google Scholar]
- 39.Coates J.C., de Bono M. Antagonistic pathways in neurons exposed to body fluid regulate social feeding in Caenorhabditis elegans. Nature. 2002;419(6910):925–929. doi: 10.1038/nature01170. [DOI] [PubMed] [Google Scholar]
- 40.Cheung B.H., Arellano-Carbajal F., Rybicki I., de Bono M. Soluble guanylate cyclases act in neurons exposed to the body fluid to promote C. elegans aggregation behavior. Curr. Biol. : CB. 2004;14(12):1105–1111. doi: 10.1016/j.cub.2004.06.027. [DOI] [PubMed] [Google Scholar]
- 41.Cheung B.H., Cohen M., Rogers C., Albayram O., de Bono M. Experience-dependent modulation of C. elegans behavior by ambient oxygen. Curr. Biol. : CB. 2005;15(10):905–917. doi: 10.1016/j.cub.2005.04.017. [DOI] [PubMed] [Google Scholar]
- 42.Cho S.W., Cho J.H., Song H.O., Park C.S. Identification and characterization of a putative cyclic nucleotide-gated channel, CNG-1, in C-elegans. Mol. Cells. 2005;19(1):149–154. [PubMed] [Google Scholar]
- 43.Couto A., Oda S., Nikolaev V.O., Soltesz Z., de Bono M. In vivo genetic dissection of O-2-evoked cGMP dynamics in a Caenorhabditis elegans gas sensor. Proc. Natl. Acad. Sci. U. S. A. 2013;110(35):E3301–E3310. doi: 10.1073/pnas.1217428110. [DOI] [PMC free article] [PubMed] [Google Scholar]
- 44.Yu S., Avery L., Baude E., Garbers D.L. Guanylyl cyclase expression in specific sensory neurons: a new family of chemosensory receptors. Proc. Natl. Acad. Sci. U. S. A. 1997;94(7):3384–3387. doi: 10.1073/pnas.94.7.3384. [DOI] [PMC free article] [PubMed] [Google Scholar]
- 45.Wedel B.J., Garbers D.L. The guanylyl cyclase family at Y2K. Annu. Rev. Physiol. 2001;63:215–233. doi: 10.1146/annurev.physiol.63.1.215. [DOI] [PubMed] [Google Scholar]
- 46.Lucas K.A., Pitari G.M., Kazerounian S., Ruiz-Stewart I., Park J., Schulz S., Chepenik K.P., Waldman S.A. Guanylyl cyclases and signaling by cyclic GMP. Pharmacol. Rev. 2000;52(3):375–413. [PubMed] [Google Scholar]
- 47.Shen C., Shao Z., Powell-Coffman J.A. The Caenorhabditis elegans rhy-1 gene inhibits HIF-1 hypoxia-inducible factor activity in a negative feedback loop that does not include vhl-1. Genetics. 2006;174(3):1205–1214. doi: 10.1534/genetics.106.063594. [DOI] [PMC free article] [PubMed] [Google Scholar]
- 48.Zhang Y., Shao Z., Zhai Z., Shen C., Powell-Coffman J.A. The HIF-1 hypoxia-inducible factor modulates lifespan in C. elegans. PLoS One. 2009;4(7) doi: 10.1371/journal.pone.0006348. e6348. [DOI] [PMC free article] [PubMed] [Google Scholar]
- 49.Shao Z.Y., Zhang Y., Powell-Coffman J.A. Two distinct roles for EGL-9 in the regulation of HIF-1-Mediated gene expression in Caenorhabditis elegans. Genetics. 2009;183(3):821–829. doi: 10.1534/genetics.109.107284. [DOI] [PMC free article] [PubMed] [Google Scholar]
- 50.Miranda-Vizuete A., Veal E.A. Caenorhabditis elegans as a model for understanding ROS function in physiology and disease. Redox Biol. 2017;11:708–714. doi: 10.1016/j.redox.2016.12.020. [DOI] [PMC free article] [PubMed] [Google Scholar]
- 51.Schaible B., Rodriguez J., Garcia A., von Kriegsheim A., McClean S., Hickey C., Keogh C.E., Brown E., Schaffer K., Broquet A., Taylor C.T. Hypoxia reduces the pathogenicity of Pseudomonas aeruginosa by decreasing the expression of multiple virulence factors. J. Infect. Dis. 2017;215(9):1459–1467. doi: 10.1093/infdis/jix139. [DOI] [PubMed] [Google Scholar]
- 52.Schaffer K., Taylor C.T. The impact of hypoxia on bacterial infection. FEBS J. 2015;282(12):2260–2266. doi: 10.1111/febs.13270. [DOI] [PubMed] [Google Scholar]
- 53.Tan M.W., Mahajan-Miklos S., Ausubel F.M. Killing of Caenorhabditis elegans by Pseudomonas aeruginosa used to model mammalian bacterial pathogenesis. Proc. Natl. Acad. Sci. U. S. A. 1999;96(2):715–720. doi: 10.1073/pnas.96.2.715. [DOI] [PMC free article] [PubMed] [Google Scholar]
- 54.Mahajan-Miklos S., Tan M.W., Rahme L.G., Ausubel F.M. Molecular mechanisms of bacterial virulence elucidated using a Pseudomonas aeruginosa Caenorhabditis elegans pathogenesis model. Cell. 1999;96(1):47–56. doi: 10.1016/s0092-8674(00)80958-7. [DOI] [PubMed] [Google Scholar]
- 55.Britigan B.E., Rasmussen G.T., Cox C.D. Augmentation of oxidant injury to human pulmonary epithelial cells by the Pseudomonas aeruginosa siderophore pyochelin. Infect. Immun. 1997;65(3):1071–1076. doi: 10.1128/iai.65.3.1071-1076.1997. [DOI] [PMC free article] [PubMed] [Google Scholar]
- 56.Yang W., Hekimi S. A mitochondrial superoxide signal triggers increased longevity in Caenorhabditis elegans. PLoS Biol. 2010;8(12) doi: 10.1371/journal.pbio.1000556. [DOI] [PMC free article] [PubMed] [Google Scholar]
- 57.Drechsel D.A., Patel M. Differential contribution of the mitochondrial respiratory chain complexes to reactive oxygen species production by redox cycling agents implicated in parkinsonism. Toxicol. Sci. : Off. J. Soc. Toxicol. 2009;112(2):427–434. doi: 10.1093/toxsci/kfp223. [DOI] [PMC free article] [PubMed] [Google Scholar]
- 58.White J.G., Southgate E., Thomson J.N., Brenner S. The structure of the nervous-system of the nematode caenorhabditis-elegans. Philos. T Roy Soc. B. 1986;314(1165):1–340. doi: 10.1098/rstb.1986.0056. [DOI] [PubMed] [Google Scholar]
- 59.Witham E., Comunian C., Ratanpal H., Skora S., Zimmer M., Srinivasan S. C. elegans body cavity neurons are homeostatic sensors that integrate fluctuations in oxygen availability and internal nutrient reserves. Cell Rep. 2016;14(7):1641–1654. doi: 10.1016/j.celrep.2016.01.052. [DOI] [PMC free article] [PubMed] [Google Scholar]
- 60.Hussey R., Littlejohn N.K., Witham E., Vanstrum E., Mesgarzadeh J., Ratanpal H., Srinivasan S. Oxygen-sensing neurons reciprocally regulate peripheral lipid metabolism via neuropeptide signaling in Caenorhabditis elegans. PLoS Genet. 2018;14(3) doi: 10.1371/journal.pgen.1007305. [DOI] [PMC free article] [PubMed] [Google Scholar]
- 61.Styer K.L., Singh V., Macosko E., Steele S.E., Bargmann C.I., Aballay A. Innate immunity in Caenorhabditis elegans is regulated by neurons expressing NPR-1/GPCR. Science. 2008;322(5900):460–464. doi: 10.1126/science.1163673. [DOI] [PMC free article] [PubMed] [Google Scholar]
- 62.Derbyshire E.R., Marletta M.A. Structure and regulation of soluble guanylate cyclase. Annu. Rev. Biochem. 2012;81:533–559. doi: 10.1146/annurev-biochem-050410-100030. [DOI] [PubMed] [Google Scholar]
- 63.Kleppisch T., Feil R. cGMP signalling in the mammalian brain: role in synaptic plasticity and behaviour. Handb. Exp. Pharmacol. 2009;191:549–579. doi: 10.1007/978-3-540-68964-5_24. [DOI] [PubMed] [Google Scholar]
- 64.Shen F., Li Y.J., Shou X.J., Cui C.L. Role of the NO/sGC/PKG signaling pathway of hippocampal CA1 in morphine-induced reward memory. Neurobiol. Learn. Mem. 2012;98(2):130–138. doi: 10.1016/j.nlm.2012.07.005. [DOI] [PubMed] [Google Scholar]
- 65.Bretscher A.J., Kodama-Namba E., Busch K.E., Murphy R.J., Soltesz Z., Laurent P., de Bono M. Temperature, oxygen, and salt-sensing neurons in C. elegans are carbon dioxide sensors that control avoidance behavior. Neuron. 2011;69(6):1099–1113. doi: 10.1016/j.neuron.2011.02.023. [DOI] [PMC free article] [PubMed] [Google Scholar]
- 66.Lucas K.A., Pitari G.M., Kazerounian S., Ruiz-Stewart I., Park J., Schulz S., Chepenik K.P., Waldman S.A. Guanylyl cyclases and signaling by cyclic GMP. Pharmacol. Rev. 2000;52(3):375–414. [PubMed] [Google Scholar]
- 67.Bleymehl K., Perez-Gomez A., Omura M., Moreno-Perez A., Macias D., Bai Z., Johnson R.S., Leinders-Zufall T., Zufall F., Mombaerts P. A sensor for low environmental oxygen in the mouse main olfactory epithelium. Neuron. 2016;92(6):1196–1203. doi: 10.1016/j.neuron.2016.11.001. [DOI] [PMC free article] [PubMed] [Google Scholar]
- 68.Maurer-Stroh S., Washietl S., Eisenhaber F. Protein prenyltransferases. Genome Biol. 2003;4(4):212. doi: 10.1186/gb-2003-4-4-212. [DOI] [PMC free article] [PubMed] [Google Scholar]
- 69.Siegert I., Schodel J., Nairz M., Schatz V., Dettmer K., Dick C., Kalucka J., Franke K., Ehrenschwender M., Schley G., Beneke A., Sutter J., Moll M., Hellerbrand C., Wielockx B., Katschinski D.M., Lang R., Galy B., Hentze M.W., Koivunen P., Oefner P.J., Bogdan C., Weiss G., Willam C., Jantsch J. Ferritin-mediated iron sequestration stabilizes hypoxia-inducible factor-1alpha upon LPS activation in the presence of ample oxygen. Cell Rep. 2015;13(10):2048–2055. doi: 10.1016/j.celrep.2015.11.005. [DOI] [PubMed] [Google Scholar]
- 70.Kuschel A., Simon P., Tug S. Functional regulation of HIF-1alpha under normoxia--is there more than post-translational regulation? J. Cell. Physiol. 2012;227(2):514–524. doi: 10.1002/jcp.22798. [DOI] [PubMed] [Google Scholar]
- 71.Nonet M.L., Staunton J.E., Kilgard M.P., Fergestad T., Hartwieg E., Horvitz H.R., Jorgensen E.M., Meyer B.J. Caenorhabditis elegans rab-3 mutant synapses exhibit impaired function and are partially depleted of vesicles. J. Neurosci. : Off. J. Soc. Neurosci. 1997;17(21):8061–8073. doi: 10.1523/JNEUROSCI.17-21-08061.1997. [DOI] [PMC free article] [PubMed] [Google Scholar]
- 72.Sambrook J., Fritsch E.F., Maniatis T. second ed. Cold Spring Harbor Laboratory, Cold Spring Harbor, N.Y.; 1989. Molecular Cloning : a Laboratory Manual. [Google Scholar]
- 73.Esposito G., Di Schiavi E., Bergamasco C., Bazzicalupo P. Efficient and cell specific knock-down of gene function in targeted C. elegans neurons. Gene. 2007;395(1–2):170–176. doi: 10.1016/j.gene.2007.03.002. [DOI] [PubMed] [Google Scholar]
- 74.Hobert .O. PCR fusion-based approach to create reporter gene constructs for expression analysis in transgenic C. Elegans BioTech. BioTech. 2002;32:728–730. doi: 10.2144/02324bm01. 4. [DOI] [PubMed] [Google Scholar]
- 75.Mello C.C., Kramer J.M., Stinchcomb D., Ambros V. Efficient gene transfer in C.elegans: extrachromosomal maintenance and integration of transforming sequences. EMBO J. 1991;10(12):3959–3970. doi: 10.1002/j.1460-2075.1991.tb04966.x. [DOI] [PMC free article] [PubMed] [Google Scholar]
- 76.Schneider C.A., Rasband W.S., Eliceiri K.W. NIH Image to ImageJ: 25 years of image analysis. Nat. Methods. 2012;9(7):671–675. doi: 10.1038/nmeth.2089. [DOI] [PMC free article] [PubMed] [Google Scholar]
- 77.Gems D., Riddle D.L. Genetic, behavioral and environmental determinants of male longevity in Caenorhabditis elegans. Genetics. 2000;154(4):1597–1610. doi: 10.1093/genetics/154.4.1597. [DOI] [PMC free article] [PubMed] [Google Scholar]
- 78.Lee S.J., Hwang A.B., Kenyon C. Inhibition of respiration extends C. elegans' lifespan via reactive oxygen species that increase HIF-1 activity. Curr. Biol. : CB. 2010;20(23):2131–2136. doi: 10.1016/j.cub.2010.10.057. [DOI] [PMC free article] [PubMed] [Google Scholar]
- 79.Eden E., Navon R., Steinfeld I., Lipson D., Yakhini Z. GOrilla: a tool for discovery and visualization of enriched GO terms in ranked gene lists. BMC Bioinf. 2009;10(1):48. doi: 10.1186/1471-2105-10-48. [DOI] [PMC free article] [PubMed] [Google Scholar]
- 80.Eden E., Lipson D., Yogev S., Yakhini Z. Discovering motifs in ranked lists of DNA sequences. PLoS Comput. Biol. 2007;3(3) doi: 10.1371/journal.pcbi.0030039. e39. [DOI] [PMC free article] [PubMed] [Google Scholar]
- 81.Yook K.J., Proulx S.R., Jorgensen E.M. Rules of nonallelic noncomplementation at the synapse in Caenorhabditis elegans. Genetics. 2001;158(1):209–220. doi: 10.1093/genetics/158.1.209. [DOI] [PMC free article] [PubMed] [Google Scholar]
Associated Data
This section collects any data citations, data availability statements, or supplementary materials included in this article.