

Summary
Cotton is widely cultivated globally because it provides natural fibre for the textile industry and human use. To identify quantitative trait loci (QTLs)/genes associated with fibre quality and yield, a recombinant inbred line (RIL) population was developed in upland cotton. A consensus map covering the whole genome was constructed with three types of markers (8295 markers, 5197.17 centimorgans (cM)). Six fibre yield and quality traits were evaluated in 17 environments, and 983 QTLs were identified, 198 of which were stable and mainly distributed on chromosomes 4, 6, 7, 13, 21 and 25. Thirty‐seven QTL clusters were identified, in which 92.8% of paired traits with significant medium or high positive correlations had the same QTL additive effect directions, and all of the paired traits with significant medium or high negative correlations had opposite additive effect directions. In total, 1297 genes were discovered in the QTL clusters, 414 of which were expressed in two RNA‐Seq data sets. Many genes were discovered, 23 of which were promising candidates. Six important QTL clusters that included both fibre quality and yield traits were identified with opposite additive effect directions, and those on chromosome 13 ( qClu‐chr13‐2) could increase fibre quality but reduce yield; this result was validated in a natural population using three markers. These data could provide information about the genetic basis of cotton fibre quality and yield and help cotton breeders to improve fibre quality and yield simultaneously.
Keywords: upland cotton, consensus genetic map, fibre quality, fibre yield, QTL clusters, genetic correlation, gene expression level
Introduction
Among the four cultivated Gossypium species, G. hirsutum (upland cotton) accounts for 90%–95% of the total cotton fibre production because of its wide adaptability and attractive fibre quality (Lacape et al., 2009; Park et al., 2005; Percival et al., 1999; Rong et al., 2004). In conventional breeding procedures, which use sexual hybridization, parents are selected based on their desired phenotypic performance for the target traits; for complex traits such as cotton fibre quality and yield, however, it becomes challenging to further improve one without compromising the other (Cao et al., 2015; Li et al., 2016a; Ning et al., 2014; Qin et al., 2008; Shen et al., 2005; Yu et al., 2013a,b). Therefore, uncovering the genetic basis of the fibre quality and yield traits in upland cotton is becoming increasingly necessary for the simultaneous improvement of fibre quality and yield in the future (Ning et al., 2014; Sun et al., 2012).
Sequencing of the genomes of G. raimondii (Paterson et al., 2012; Wang et al., 2012), G. arboreum (Du et al., 2018; Li et al., 2014), G. barbadense (Liu et al., 2015; Yuan et al., 2015) and G. hirsutum (Li et al., 2015a; Wang et al., 2019; Zhang et al., 2015b) has provided new platforms for linkage map‐based QTL identification. To explain the genetic basis of cotton fibre quality and yield‐related traits, many genetic linkage maps have been constructed, including interspecific maps mainly between G. barbadense and G. hirsutum (Chandnani et al., 2018; Chee et al., 2005a,b; He et al., 2007; Lacape et al., 2010; Song et al., 2017; Wang et al., 2016; Yang et al., 2015; Zhai et al., 2016) and intra‐hirsutum maps (Liu et al., 2017; Ning et al., 2014; Shang et al., 2015, Sun et al., 2012; Tan et al., 2014; Tang et al., 2015; Zhang et al., 2012, 2017b; Zhang et al., 2016); QTLs have been identified based on these maps. Restriction fragment length polymorphism (RFLP) markers were used to construct the initial genetic map in cotton (Paterson et al., 2003; Rong et al., 2004; Ulloa et al., 2002, 2005), followed by simple sequence repeat (SSR) markers (Liu et al., 2017; Sun et al., 2012; Tan et al., 2014; Tang et al., 2015; Yang et al., 2015; Zhang et al., 2012, 2015c) and single nucleotide polymorphism (SNP) markers (Diouf et al., 2018; Hulse‐Kemp et al., 2015; Li et al., 2016a; Qi et al., 2017; Wang et al., 2015a,b; Zhang et al., 2016, 2017b). A QTL is a chromosome region that might cumulatively contribute to phenotypic variation; each QTL has a varying degree of efficacy for a specific trait (Paterson et al., 2003; Rong et al., 2004; Shen et al., 2005, 2007; Zhang et al., 2012; Tan et al., 2014; Wang et al., 2015a and Wang et al., 2015b). QTLs for fibre quality and yield traits have contributed to cotton breeding through marker‐assisted selection, fine mapping, functional characterization of genes and gene cloning. However, the maps used did not cover the whole genome, and the environments used to assess the phenotypes were insufficient (Diouf et al., 2018; Hulse‐Kemp et al., 2015; Jia et al., 2018; Li et al., 2016a; Liu et al., 2017; Qi et al., 2017; Tang et al., 2015; Wang et al., 2015a,b). Thus, many QTLs for fibre quality and yield traits remain to be identified and characterized across the upland cotton genome. It remains necessary to dissect the genetic basis of traits related to fibre quality and yield by identifying QTLs using a high‐density genetic linkage map with coverage of the entire upland cotton genome.
In this study, we developed a population of intraspecific RILs in upland cotton consisting of 196 lines with the parents 0‐153 and sGK9708. The fibre quality and yield traits were evaluated across 22 environments. A whole‐genome‐based high‐density genetic linkage map was constructed by integrating five previously reported basic linkage maps generated using SSR (Jamshed et al., 2016; Sun et al., 2012), SSR and SNP‐BSA (bulked segregation analysis) (Zhang et al., 2015c), SNP‐specific‐locus amplified fragment sequencing (SLAF) (Zhang et al., 2016) and SNP‐chip (Zhang et al., 2017b). QTLs for fibre quality and yield traits were identified in 17 of the 22 environments. QTL clusters were also identified to determine the genetic basis of the correlation between fibre quality and fibre yield.
This study demonstrates the integration of various linkage maps with different marker types to construct a high‐density genetic map covering the whole genome. This technique could be a powerful complementary strategy to dissect the genetic basis of complex traits and their genetic correlations in cotton. In addition to providing new insights into the genetic basis of the traits related to fibre quality and yield and their relationships, this study also provided information about improving cotton fibre quality and yield simultaneously.
Results
Phenotypic variation and correlation of traits relating to fibre quality and yield
A RIL population developed between the two parents 0‐153 and sGK9708 was planted from 2007 to 2015 across 22 environments (Table S1). The phenotypic variation ranges of fibre strength (FS), fibre length (FL), micronaire (FM), boll weight (BW), lint percentage (LP) and seed index (SI) for the parents and the RIL population are summarized in Table S2 and Figure 1. All the traits showed approximately normal distributions with an absolute skewness value of less than one and were characterized by transgressive segregation with respect to parental performance.
Figure 1.
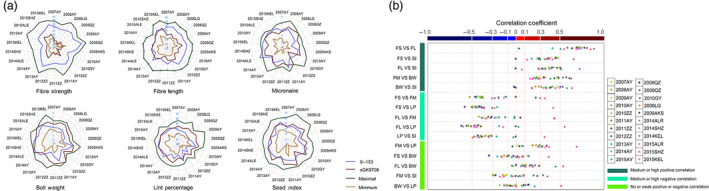
The phenotype of the parents and a transgressive segregation line in 22 environments and the correlation analysis. (a) The phenotype of the parents and transgressive segregation line in 22 environments. (b) The correlation analysis between the different traits in the same environments.
The heritability for FS, FL, FM, BW and LP was calculated across 21 environments, excluding 2013Anyang; the heritability for SI was calculated across 20 environments, excluding 2012Zhengzhou and 2013Anyang. The heritability for all traits was more than 50%, except in 2015Shihezi (49.80%) and 2014Alaer (31.20%), which indicates that these six traits had high heritability. The variance analysis and heritability analysis results are shown in Table S3.
To establish correlations between different traits in the same environment, three categories of correlations were observed among the six traits. In the first category, the trait pairs (FS and FL, FS and SI, FL and SI, FM and BW, and BW and SI) showed significant medium or high positive correlations in most of the environments; in the second category, the trait pairs (FS and FM, FS and LP, FL and FM, FL and LP, and LP and SI) showed significant medium or high negative correlations in most of the environments; and in the third category, the trait pairs (FM and LP, FS and BW, FL and BW, FM and SI, BW and LP) showed no or weak positive or negative correlations in most of the environments (Table S4, Figure 1).
In 2012Zhengzhou, 2014Kuerle and 2015Kuerle, the correlations between the traits differed significantly from those in the other environments. In 2011Anyang, 2011Zhengzhou and 2012Zhengzhou, some traits did not show any significant positive correlations with those in the other environments. These results indicated that these five environments were distorted; thus, the other 17 environments were used for QTL identification (Table S5).
Genotyping for constructing the genetic linkage map
To ensure the quality of the genetic consensus map, all three types of markers (SSR, SLAF‐SNP and chip‐SNP) were first filtered. For the SLAF‐SNP markers, the processing and the results of filtering the markers are shown in Zhang's reports (Zhang et al., 2016) (Table S6). For the chip‐SNP markers, 6989 SNPs were shown to be polymorphic between the parents, 4863 were located on the genome of upland cotton, 2734 were genotyped as AA × BB with a missing rate of <40%, and 2315 showed nonsignificant segregation distortion with P values of more than 0.001 and could therefore be used to construct the consensus genetic map (Table S6) (Zhang et al., 2017b). For the SSR markers, 398 markers with 458 loci from Sun's and Jamshed's research could be located in the upland cotton genome and used to construct the consensus genetic map; these markers were developed by other organizations (Table S6) (Jamshed et al., 2016; Sun et al., 2012).
Construction of the consensus genetic linkage map
After combining the filtered markers, the consensus genetic linkage map consisted of 8295 markers (458 SSRs, 5521 SLAF‐SNPs and 2316 chip‐SNPs) and spanned 5197.17 cM, with 2384.94 cM for the At subgenome and 2812.23 cM for the Dt subgenome. The average interval between adjacent markers was 0.88 cM. The gaps (more than 10 cM) in the integrated genetic linkage map were mainly found on Dt subgenome chromosomes, with five on chromosome 15 and four on chromosome 26. The largest map gap was found on chromosome 25 (24.36 cM). The segregation distortion of the markers (SDM) (0.001 < P value <0.05) in the integrated linkage map remained at almost the same level as in the component maps. Chromosome 14 (447) and chromosome 25 (249) were the two chromosomes with the highest levels of SDM. The marker density in the genetic and physical maps along the whole genome indicated high coverage, although the markers were unevenly distributed throughout the upland cotton genome, and there were large variations across chromosome regions. For the collinearity analysis, most of the SNP loci on the linkage map were in the same order as those on the corresponding chromosomes of the physical map of the upland cotton genome. These results demonstrated that the current linkage map could provide an effective and reliable tool for QTL mapping (Table 1, Figure 2).
Table 1.
Detailed information on the consensus genetic map for the RIL population
| No. Chr | Marker Num | Total Genetic Distance (cM) | Average Genetic Distance (cM) | Largest Gap | No. SLAF‐SNP Markers | No. chip‐SNP Markers | No. SSR Markers | Number of Gap (>5 cM) | Number of SDMs (0.001 < = P < 0.05) | Percentage of SDMs (%) | Chi‐square | P‐value | SDR |
|---|---|---|---|---|---|---|---|---|---|---|---|---|---|
| chr01 | 414 | 181.81 | 0.44 | 6.77 | 297 | 108 | 9 | 1 | 119 | 28.74 | 2.84 | 0.21 | 3 |
| chr02 | 238 | 151.99 | 0.64 | 11.18 | 180 | 54 | 4 | 6 | 21 | 8.82 | 1.32 | 0.45 | 2 |
| chr03 | 329 | 191.94 | 0.59 | 16.29 | 218 | 100 | 11 | 5 | 68 | 20.67 | 2.35 | 0.48 | 3 |
| chr04 | 646 | 208.85 | 0.32 | 15.12 | 574 | 60 | 12 | 7 | 8 | 1.24 | 0.94 | 0.47 | 1 |
| chr05 | 571 | 221.34 | 0.39 | 8.13 | 434 | 119 | 18 | 5 | 196 | 34.33 | 2.87 | 0.29 | 5 |
| chr06 | 181 | 207.63 | 1.15 | 16.98 | 101 | 42 | 38 | 3 | 76 | 41.99 | 6.80 | 0.35 | 4 |
| chr07 | 422 | 168.99 | 0.4 | 4.76 | 318 | 97 | 7 | 0 | 29 | 6.87 | 1.13 | 0.45 | 2 |
| chr08 | 78 | 85.3 | 1.11 | 4.79 | 56 | 21 | 1 | 0 | 20 | 25.64 | 7.01 | 0.31 | 1 |
| chr09 | 376 | 193.16 | 0.52 | 14.15 | 274 | 91 | 11 | 5 | 90 | 23.94 | 2.60 | 0.40 | 7 |
| chr10 | 218 | 199.12 | 0.92 | 9.90 | 133 | 68 | 17 | 11 | 74 | 33.94 | 9.36 | 0.24 | 2 |
| chr11 | 120 | 154.86 | 1.3 | 5.39 | 88 | 28 | 4 | 1 | 5 | 4.17 | 1.55 | 0.33 | 1 |
| chr12 | 368 | 212.73 | 0.58 | 4.76 | 273 | 89 | 6 | 0 | 89 | 24.18 | 2.61 | 0.24 | 5 |
| chr13 | 766 | 207.22 | 0.27 | 5.07 | 604 | 151 | 11 | 1 | 64 | 8.36 | 1.67 | 0.36 | 6 |
| chr14 | 727 | 234.63 | 0.32 | 2.98 | 408 | 305 | 14 | 0 | 477 | 65.61 | 7.32 | 0.15 | 2 |
| chr15 | 85 | 226.61 | 2.7 | 13.20 | 29 | 27 | 29 | 18 | 8 | 9.41 | 1.49 | 0.38 | 1 |
| chr16 | 620 | 245.76 | 0.4 | 16.17 | 399 | 175 | 46 | 8 | 202 | 32.58 | 5.37 | 0.28 | 5 |
| chr17 | 184 | 199.41 | 1.09 | 16.59 | 102 | 60 | 22 | 10 | 11 | 5.98 | 1.01 | 0.51 | 1 |
| chr18 | 286 | 236.88 | 0.83 | 23.66 | 172 | 96 | 18 | 15 | 52 | 18.18 | 2.10 | 0.31 | 4 |
| chr19 | 180 | 219.65 | 1.23 | 13.95 | 109 | 56 | 15 | 14 | 50 | 27.78 | 2.67 | 0.35 | 5 |
| chr20 | 150 | 226.79 | 1.52 | 13.51 | 60 | 62 | 28 | 12 | 43 | 28.67 | 6.03 | 0.34 | 4 |
| chr21 | 271 | 221.93 | 0.82 | 5.44 | 174 | 89 | 8 | 2 | 8 | 2.95 | 0.90 | 0.53 | 2 |
| chr22 | 149 | 152.86 | 1.03 | 4.76 | 75 | 64 | 10 | 0 | 2 | 1.34 | 0.54 | 0.65 | 0 |
| chr23 | 302 | 244.88 | 0.81 | 13.29 | 142 | 131 | 29 | 7 | 109 | 36.09 | 7.95 | 0.22 | 6 |
| chr24 | 109 | 132.17 | 1.22 | 3.90 | 60 | 46 | 3 | 0 | 16 | 14.68 | 1.82 | 0.43 | 1 |
| chr25 | 353 | 230.04 | 0.65 | 24.36 | 166 | 121 | 66 | 7 | 249 | 70.54 | 12.16 | 0.10 | 8 |
| chr26 | 152 | 240.62 | 1.59 | 16.07 | 75 | 56 | 21 | 12 | 22 | 14.47 | 1.86 | 0.42 | 3 |
Figure 2.
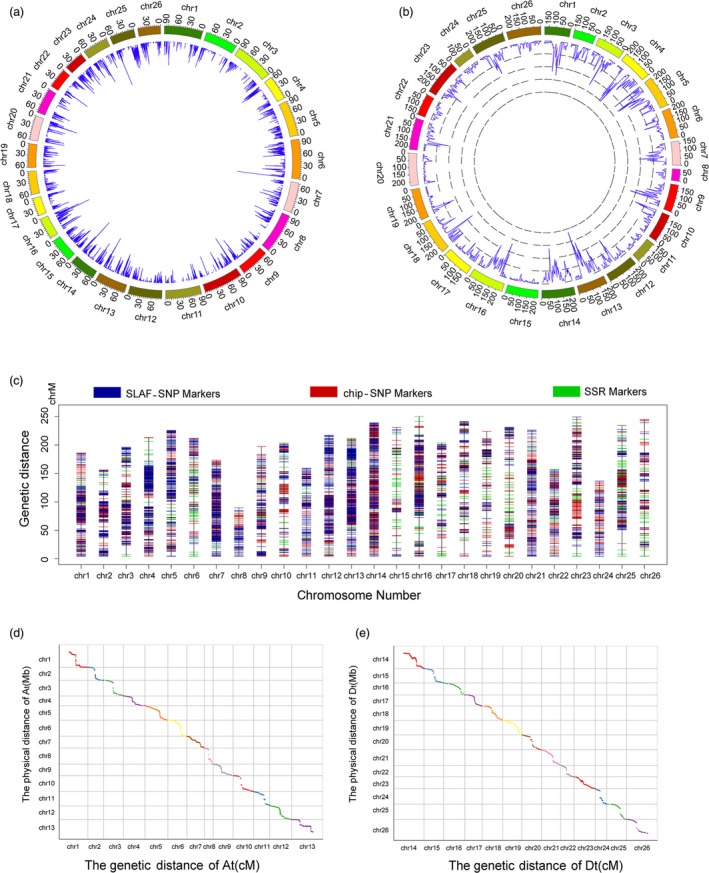
Detailed information about the consensus genetic map. (a) The density of markers in the genetic map in a 5 cM window. (b) The density of markers in the physical map in a 500 kb window. (c) The distribution of the SSR markers, SLAF‐SNP, markers and chip makers in the consensus genetic map. (d) Collinearity analysis of markers between the physical map and genetic map in the A subgenome. (e) Collinearity analysis of markers between the physical map and genetic map in D subgenome.
QTL identification for fibre quality and yield
Based on the consensus genetic map and the phenotype data across 17 environments, 983 QTLs (548 on At and 435 on Dt) for fibre quality and yield were identified. Among them, 198 were stable (118 on At and 80 on Dt) in at least three environments, and 53.53% of stable QTLs were mainly distributed on chromosomes 4, 6, 7, 13, 21 and 25, especially the three‐environment‐stable QTLs (Tables 2, S7 and S8, Figures S1 and 3).
Table 2.
The number of QTLs and stable QTLs for the six fibre quality and yield traits in 17 environments
| No. Chr | FS | FL | FM | BW | LP | SI | Total | |||||||
|---|---|---|---|---|---|---|---|---|---|---|---|---|---|---|
| Total | Stable | Total | Stable | Total | Stable | Total | Stable | Total | Stable | Total | Stable | Total | Stable | |
| Chr01 | 1 | 0 | 12 | 4 | 7 | 1 | 8 | 4 | 2 | 1 | 4 | 0 | 34 | 10 |
| Chr02 | 0 | 0 | 3 | 0 | 3 | 2 | 6 | 0 | 4 | 1 | 5 | 1 | 21 | 4 |
| Chr03 | 4 | 0 | 4 | 0 | 6 | 0 | 5 | 1 | 8 | 3 | 6 | 0 | 33 | 4 |
| Chr04 | 12 | 5 | 13 | 8 | 14 | 3 | 8 | 0 | 8 | 3 | 13 | 4 | 68 | 23 |
| Chr05 | 7 | 0 | 7 | 1 | 8 | 2 | 11 | 2 | 5 | 0 | 5 | 1 | 43 | 6 |
| Chr06 | 10 | 3 | 4 | 2 | 8 | 2 | 18 | 3 | 6 | 2 | 5 | 1 | 51 | 13 |
| Chr07 | 14 | 3 | 16 | 3 | 8 | 2 | 13 | 4 | 9 | 2 | 22 | 7 | 82 | 21 |
| Chr08 | 4 | 2 | 2 | 1 | 6 | 1 | 2 | 0 | 5 | 0 | 2 | 0 | 21 | 4 |
| Chr09 | 4 | 0 | 1 | 0 | 1 | 1 | 10 | 3 | 5 | 0 | 5 | 0 | 26 | 4 |
| Chr10 | 1 | 0 | 5 | 0 | 12 | 1 | 16 | 2 | 7 | 0 | 7 | 1 | 48 | 4 |
| Chr11 | 7 | 1 | 10 | 2 | 5 | 2 | 4 | 1 | 3 | 0 | 5 | 2 | 34 | 8 |
| Chr12 | 1 | 0 | 2 | 0 | 5 | 0 | 12 | 1 | 2 | 0 | 1 | 0 | 23 | 1 |
| Chr13 | 8 | 3 | 11 | 3 | 11 | 3 | 16 | 4 | 11 | 3 | 7 | 0 | 64 | 16 |
| Chr14 | 12 | 1 | 8 | 2 | 12 | 0 | 8 | 0 | 9 | 3 | 8 | 0 | 57 | 6 |
| Chr15 | 3 | 0 | 8 | 0 | 4 | 2 | 5 | 1 | 2 | 0 | 1 | 0 | 23 | 3 |
| Chr16 | 8 | 3 | 4 | 1 | 8 | 1 | 8 | 3 | 7 | 1 | 8 | 0 | 43 | 9 |
| Chr17 | 1 | 0 | 1 | 0 | 3 | 3 | 3 | 1 | 5 | 0 | 5 | 1 | 18 | 5 |
| Chr18 | 5 | 1 | 5 | 0 | 7 | 1 | 8 | 0 | 5 | 0 | 1 | 0 | 31 | 2 |
| Chr19 | 6 | 1 | 6 | 1 | 6 | 0 | 5 | 0 | 5 | 0 | 9 | 2 | 37 | 4 |
| Chr20 | 3 | 1 | 4 | 1 | 3 | 0 | 4 | 0 | 6 | 2 | 3 | 0 | 23 | 4 |
| Chr21 | 8 | 2 | 6 | 4 | 6 | 3 | 5 | 1 | 6 | 1 | 8 | 1 | 39 | 12 |
| Chr22 | 6 | 2 | 3 | 0 | 6 | 0 | 6 | 1 | 3 | 0 | 8 | 1 | 32 | 4 |
| Chr23 | 3 | 0 | 2 | 0 | 4 | 1 | 5 | 1 | 1 | 0 | 3 | 0 | 18 | 2 |
| Chr24 | 0 | 0 | 1 | 0 | 2 | 0 | 5 | 1 | 11 | 2 | 5 | 1 | 24 | 4 |
| Chr25 | 6 | 5 | 10 | 2 | 13 | 1 | 16 | 8 | 14 | 2 | 12 | 3 | 71 | 21 |
| Chr26 | 4 | 0 | 1 | 0 | 2 | 0 | 4 | 1 | 4 | 2 | 4 | 1 | 19 | 4 |
| Total | 138 | 33 | 149 | 35 | 170 | 32 | 211 | 43 | 153 | 28 | 162 | 27 | 983 | 198 |
Figure 3.
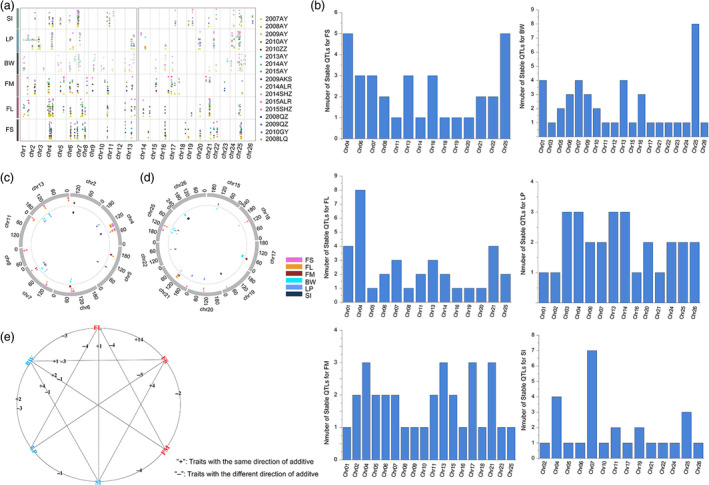
Detailed information about the QTLs and QTL clusters. (a) The position of the QTLs on the consensus genetic map. (b) The distribution of the stable QTLs for the six traits on the 26 chromosomes. (c) The position of QTL clusters on the consensus genetic map of At. (d) The position of QTL clusters on the consensus genetic map of Dt. (e) The number of two‐pair‐trait QTL clusters with the same and different direction for additive effect.
There were 138 QTLs for FS, 149 for FL, 170 for FM, 211 for BW, 153 for LP and 162 for SI. Among them, 33 (At was 17 and Dt was 16), 35 (At was 24 and Dt was 11), 32 (At was 20 and Dt was 12), 43 (At was 25 and Dt was 18), 28 (At was 15 and Dt was 13) and 27 (At was 17 and Dt was 10) QTLs were stable, respectively. These stable QTLs were distributed on all 26 chromosomes of cotton, mainly on chromosomes 4, 6, 7, 11, 13, 16, 20, 21 and 25. Detailed information about the confidence intervals, observed phenotypic variance (PV) values and additive effects of each QTL is shown in Tables 2, S7, S8, Figures S1 and 3.
QTL cluster identification
Among the QTLs identified for fibre quality and yield, there were QTLs for different traits that shared the same confidence intervals and were considered to constitute QTL clusters. In this research, 37 QTL clusters were identified (23 on At and 14 on Dt). All these QTL clusters were distributed on 17 chromosomes (chromosomes 2, 4, 5, 6, 7, 8, 11, 13, 15, 16, 17, 19, 20, 21, 22, 25 and 26). Six chromosomes (chromosomes 4, 6, 7, 13, 21 and 25) harboured 25 QTL clusters, accounting for 67.6% of the total clusters identified, and could be considered important chromosomes in this study. Among these QTL clusters, there were six QTL clusters that harboured QTLs for FS or FL and BW or LP. The 0‐153 allele increased FS and FL but decreased LP or BW in the qClu‐chr16‐1, qClu‐chr20‐1, qClu‐chr6‐2, qClu‐chr25‐2 and qClu‐chr13‐2 cluster; it also increased LP but decreased FS in qClu‐chr21‐3. Detailed information about the QTL clusters and the QTLs in these clusters is shown in Table S9, Figures S2 and 3.
Candidate gene identification and annotation
The genes in the confidence intervals related to the six traits were annotated with the Gene Ontology (GO), Kyoto Encyclopedia of Genes and Genomes (KEGG) and euKaryotic Orthologous Groups (KOG) databases. The GO term ‘nucleus’, the KEGG pathway ‘Metabolic pathways’ and the KOG basket ‘Signal transduction mechanisms’ were associated with the highest numbers of genes for each trait (Tables S10, S11, S12).
In the confidence intervals of the QTL clusters, there were a total of 1297 candidate genes, 946 of which belonged to At and 351 to Dt of the upland cotton genome (Table S13). The qClu‐chr11‐1 cluster harboured the most candidate genes at 194, while qClu‐chr7‐3 harboured only one candidate gene. Six QTL clusters (qClu‐chr4‐1, qClu‐chr4‐2, qClu‐chr4‐5, qClu‐chr5‐2, qClu‐chr7‐3 and qClu‐chr13‐2) harboured fewer than ten candidate genes, and nine QTL clusters (qClu‐chr7‐6, qClu‐chr13‐3, qClu‐chr13‐4, qClu‐chr15‐1, qClu‐chr16‐1, qClu‐chr17‐1 qClu‐chr20‐1, qClu‐chr21‐3 and qClu‐chr25‐2) did not harbour any candidate genes because of their small confidence intervals.
To predict the functions of the candidate genes, each was annotated with the Arabidopsis thaliana database and using GO, KEGG and KOG. In the Arabidopsis annotation database, 1165 candidate genes had annotation information (Table S14). For GO annotation, the 1122 candidate genes were annotated with 3326 GO terms, and some candidate genes were annotated with more than one GO term. The biological process category included 1997 GO terms; the cellular component category contained 429 GO terms, and the molecular function category held 900 GO terms (Table S15). For KEGG annotation, all 1297 candidate genes were annotated with 91 KEGG pathways, with some candidate genes having no KEGG annotation information (Table S15). For KOG annotation, 861 of the 1122 candidate genes had KOG annotation information. Detailed information on the annotation of the genes is shown in Table S15 and Figure S3.
Candidate gene expression patterns
The total number of genes located in the confidence intervals of the 37 QTL clusters was 1297. Among the QTLs in the 37 QTL clusters, there were 20 QTLs for FS, harbouring 763 genes; 18 QTLs for FL, harbouring 580 genes; 11 QTLs for FM, harbouring 433 genes; 15 QTLs for BW, harbouring 307 genes; nine QTLs for LP, harbouring 70 genes; and 13 QTLs for SI, harbouring 255 genes. To select the candidate genes, the RNA‐Seq data of all the tissues in TM‐1 were analysed (Zhang et al., 2015b). Overall, 777 of the 1297 candidate genes were expressed in at least one tissue with fragments per kilobase of transcript per million fragments mapped (FPKM) values of no less than 10, and 552 of the candidate genes were expressed in cotton fibres or ovules in Zhang's research (Zhang et al., 2015b). Examining our RNA‐Seq data for cotton fibre development indicated that 495 of the 1297 candidate genes were expressed in at least one developmental period. Combining the RNA‐Seq results of our and Zhang's research, we determined that 414 genes were expressed in both data sets and were distributed on 25 QTL clusters on chromosomes 2, 4, 5, 6, 7, 8, 11, 13, 19, 21, 22, 25 and 26. Overall, 246 of the 414 genes (59.42%) were located on six chromosomes (chromosomes 4, 6, 7, 13, 21 and 25). Among the 414 genes, there were 237 for FS, 192 for FL, 150 for FM, 89 for BW, 16 for LP and 167 for SI (Table S16, Figures S4, S5 and 4).
Figure 4.
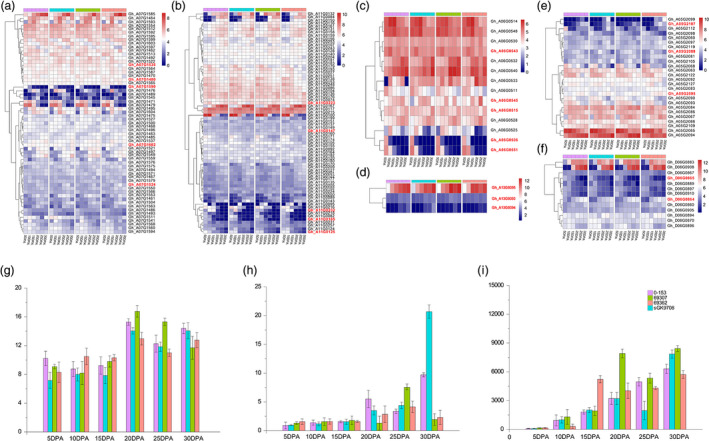
Heatmap of the expression level of candidate genes in six QTL clusters during cotton fibre development. (a–f) Heatmap of the expression level of candidate genes in qClu‐chr7‐2, qClu‐chr11‐1, qClu‐chr6‐2, qClu‐chr13‐2, qClu‐chr5‐1 and qClu‐chr25‐4 during cotton fibre development. (g–i) The qRT‐PCR result of the genes Gh_A13G0393, Gh_A13G0394 and Gh_A13G0395.
qRT‐PCR results
qRT‐PCR was performed to determine the expression levels of the four genes located on chromosome 13. The results indicated that there was no expression of the Gh_A13G0392 gene; Gh_A13G0393 was highly expressed at 20 days post‐anthesis (DPA), 25 DPA and 30 DPA, and the expression levels in the materials with high fibre quality were slightly higher than those with low fibre quality. The expression levels of Gh_A13G0394 and Gh_A13G0395 were higher in the later stages (20 DPA, 25 DPA and 30 DPA) than in the early stages (5, 10 and 15 DPA) of cotton fibre development (Table S17, Figure 4).
The descriptive statistics, quality of sequencing and population structure of the nature population
The descriptive statistics results showed that FS was from 19.10 to 49.9 cN/tex; FL from 23.9 to 37.70 mm; FM from 2.43 to 7.78; BW from 2.22 to 8.73 g; LP from 27.32% to 48.84%; and SI from 7.90 to 18.80 g in the nature population (Table S18, Figure S6).
The SNP number was from 93 4736 to 1 628 878; Q30 value from 91.08% to 93.79%; GC percentage from 33.06% to 38.70%; average depth from 7.19 to 29.54; integrity from 36.98% to 47.02%; and coverage from 0.03 to 0.05 in the nature population (Figure S7).
For the population structure analysis, the delta K value reached a sharp peak at K = 3. Therefore, this association population was clustered into three subpopulations (Figure S8).
Discussion
Coverage and saturation of the consensus genetic map
Based on the reference genome of upland cotton, the total genetic distance of the genetic map should be between 4500 and 5500 cM without visible gaps (Du et al., 2018; Li et al., 2016a; Paterson et al., 2012; Wang et al., 2012; Zhang et al., 2015b). In previous studies, several high‐density genetic maps were constructed using different markers with different populations; these maps, however, included genetic gaps of more than 20 cM (Diouf et al., 2018; Hulse‐Kemp et al., 2015; Jia et al., 2018; Li et al., 2016a; Liu et al., 2015, 2017; Qi et al., 2017; Tan et al., 2014; Tang et al., 2015; Wang et al., 2015a,b; Zhang et al., 2016, 2017a,b). In this study, we used three types of markers to construct a consensus genetic map that could fill some of the gaps in the previously generated maps. This consensus genetic map covered the whole genome of upland cotton with high saturation and is therefore a valuable tool for QTL and candidate gene identification, functional characterization and pyramiding breeding across the whole genome.
QTL numbers compared with previous reports
Because quantitative traits are influenced by the environment, some QTLs could be identified in several environments, while others could be identified only in specific environments; QTLs that could be identified in multiple environments or generations are considered stable QTLs (Sun et al., 2012) and may be of use for marker‐assisted breeding and gene cloning. As cotton fibre quality and yield traits are quantitative traits, they are controlled by multiple loci/genes. In previous studies, no more than 16 stable QTLs were identified within a population for each of the fibre quality or yield traits, that is the maximum of 16 was found for FS, seven for FL, five for FM, 16 for BW, seven for LP and four for SI (Diouf et al., 2018; Hulse‐Kemp et al., 2015; Li et al., 2016a; Liu et al., 2017; Qi et al., 2017; Tan et al., 2014, 2018; Tang et al., 2015; Wang et al., 2015a,b; Yang et al., 2015). In this study, we used a consensus genetic map with high coverage and saturation and identified more than 25 stable QTLs across 17 environments. Therefore, this study identified the greatest number of stable QTLs for fibre quality and yield. These results could provide more information about the genetic mechanisms underlying cotton fibre development and provide important loci related to the improvement of both cotton fibre quality and yield.
Congruence with previously reported QTLs
To determine whether the QTLs in our study were novel or had been previously identified, we compared our results with those from the cotton QTL database based on their physical confidence intervals and the reports of previous genome‐wide association studies (GWASs). A total of 43 QTLs shared the same or overlapping confidence intervals with QTLs identified in previous studies (Fang et al., 2014; Lacape et al., 2010; Rong et al., 2007; Said et al., 2013, 2015). Of these, 22 were in the cotton QTL database, and 25 were identified in previous GWAS (Table S19) (Fang et al., 2017b,2017c; Huang et al., 2017; Ma et al., 2018; Sun et al., 2017; Wang et al., 2017a).
Overall, of the 198 stable QTLs identified in our study, 43 have been identified in previous studies (seven for FS, seven for FL, 11 for FM, four for BW, ten for LP and four for SI.) The others (78.3% of 198) were newly identified (26 for FS, 28 for FL, 21 for FM, 39 for BW, 18 for LP and 23 for SI) and could provide more information about the mechanisms of cotton fibre development and yield formation.
Congruence with previously reported QTL clusters
In previous studies, many QTL clusters were reported and are available in the cotton QTL database (Fang et al., 2014; Lacape et al., 2010; Rong et al., 2007; Said et al., 2013, 2015). In this database, all the chromosomes harboured QTL clusters for no fewer than two traits among FS, FL, FM, BW, LP and SI. Among the 37 QTL clusters identified in our study, there were six QTL clusters (qClu‐chr6‐2, qClu‐chr7‐1, qClu‐chr13‐1, qClu‐chr13‐2, qClu‐chr17‐1 and qClu‐chr19‐1) that shared the same or overlapping confidence intervals with those in the database; the other 31 clusters were newly identified in our research.
Three markers, Marker8331, Marker8332 and Marker8333 related to qClu‐chr13‐2, were selected to genotype a natural population with 278 breeding parents (Table S18 and Figure S6). For all three markers, the phenotypes of the materials with markers and without markers showed significant differences, with P values <0.05. The FS increased from 9.77 to 10.61 cN/tex, and the FL increased from 6.40 to 4.21 mm with the markers. However, the BW decreased from 2.19 to 2.70 g, and the LP decreased from 3.17% to 4.20% with the markers (Table S20, Figure 5). These results could provide information about the mechanism underlying the negative correlation between yield traits and fibre quality traits and act as a reference for improving the yield and fibre quality of cotton.
Figure 5.
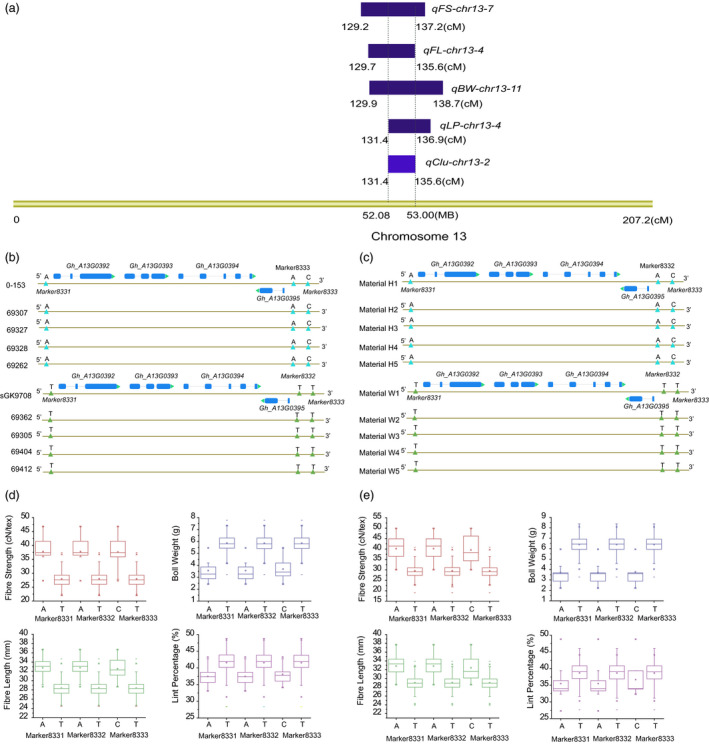
The detail information of the QTL cluster qClu‐chr13‐2. (a) The QTLs located in the QTL cluster qClu‐chr13‐2. (b) The genotype of the three markers in the QTL cluster qClu‐chr13‐2 based on the RIL population. (c) The genotype of the three markers in the QTL cluster qClu‐chr13‐2 based on the breeding parents. (d) The t‐test of the three markers in the QTL cluster qClu‐chr13‐2 based on the breeding parents in 2017. (e) The t‐test of the three markers in the QTL cluster qClu‐chr13‐2 based on the breeding parents in 2016.
QTL clusters and genetic correlation between fibre quality and fibre yield
Some previous studies in cotton have addressed the correlation between traits and QTL clusters but did not combine these results for further analysis (Diouf et al., 2018; Li et al., 2016a; Liu et al., 2017; Tan et al., 2018). In these studies, the number of QTL clusters ranged from 2 to 18, and the paired‐trait QTL clusters ranged from 2 to 27 (Table S21). Through detailed analysis of these results, we found that when paired traits had a medium or high significant positive correlation, the QTL additive effect directions for these two traits were the same (positive or negative) in most QTL clusters (Diouf et al., 2018; Liu et al., 2017; Tan et al., 2018) (Table S21); when paired traits had a medium or high significant negative correlation, the QTL additive effect directions for these two traits were opposite (positive and negative) in most of the QTL clusters (Liu et al., 2017); and when paired traits had no or only a weakly significant correlation, the QTL additive effect directions for these two traits were sometimes the same and sometimes opposite (Liu et al., 2017; Tan et al., 2018).
In our research, a total of 59 paired‐trait QTL clusters were identified for the fibre yield and quality traits; 28 (47.5%) showed the same QTL additive effect direction (positive or negative), and 31 (52.5%) showed the opposite QTL additive effect directions (positive and negative).
Five paired traits (FS and FL, FS and SI, FL and SI, FM and BW, and BW and SI) showed significant medium or high positive correlations in most environments; 27 paired‐trait QTL clusters were identified for these traits (Tables S3, S8, Figures S2 and 3). Except for two of the paired‐trait QTL clusters between FM and BW and SI and BW, the other 25 paired‐trait QTL clusters (92.8%) showed the same QTL additive effect directions (positive or negative), especially the 14 QTL clusters identified between FS and FL.
Five paired traits (FS and FM, FS and LP, FL and FM, FL and LP, and LP and SI) showed significant medium or high negative correlations in most environments, and 16 paired‐trait QTL clusters were identified for these traits (Tables S3, S8, Figures S2 and 3), all of which (100%) showed opposite QTL additive effect directions (positive and negative).
Five paired traits (FM and LP, FS and BW, FL and BW, FM and SI, and BW and LP) showed no or weak positive or negative correlations in most environments, and 16 paired‐trait QTL clusters were identified for these traits (Tables S3, S8, Figures S2, 3), 13 of which (81.2%) showed opposite QTL additive effect directions (positive and negative). Seventeen paired‐trait QTL clusters were identified for BW with FS, FM, SI and LP, nine of which (53%) showed the same QTL additive effect direction, and eight of which (47%) showed opposite additive effect directions.
Overall, the QTL clusters for cotton fibre quality and yield throughout the genome showed that paired traits with significant medium or high positive correlations always had the same QTL additive effect direction, indicating that it could be easy to simultaneously improve these traits. However, the paired traits with significant medium or high negative correlations always had opposite QTL additive effect directions, indicating that it could be difficult to simultaneously improve these traits. The paired traits with no or weak positive or negative correlations had either the same or opposite QTL additive effect directions, indicating that the positive and negative additive effects of QTLs in different clusters might have a mutually neutralizing effect with respect to these traits.
These conclusions indicated that genes and QTLs in clusters might be closely linked (Cai and Morishima, 2002; Durand et al., 2012; Gu et al., 2015; Ku et al., 2015; Li et al., 2015b; Reddy et al., 2013; Vikram et al., 2015; Zhao et al., 2016) or have pleiotropic effects (Li et al., 2016c; Xie et al., 2018; You et al., 2019; Yuan et al., 2018; Zhao et al., 2018) in the same genomic region, which provides an explanation for the significant phenotypic correlations between related traits and linkage drag. However, as in previous reports, especially in breeding populations, the negative genetic correlations between traits could be broken to a certain degree (Cai and Morishima, 2002; Durand et al., 2012; Gu et al., 2015; Ku et al., 2015; Li et al., 2015b; Reddy et al., 2013; Vikram et al., 2015; Zhao et al., 2016). This result suggests that genetic linkage may be the main genetic basis of trait correlation. To break the negative correlations between fibre quality traits and yield traits, the six QTL clusters (qClu‐chr16‐1, qClu‐chr20‐1, qClu‐chr6‐2, qClu‐chr25‐2, qClu‐chr13‐2 and qClu‐chr21‐3) should be considered for fine mapping of QTLs for FS, FL and LP. Techniques such as further separation of the confidence intervals of QTL clusters via secondary separation populations (Cao et al., 2015; Fang et al., 2017a,b,c; Liu et al., 2016; Xu et al., 2017), mutation with ethyl methanesulfonate (EMS) and radiation to change genes related to traits (Naoumkina et al., 2017; Patel et al., 2014) and the use of clustered regularly interspaced short palindromic repeats (CRISPR) technology to edit genes related to traits (Gao et al., 2017; Janga et al., 2017; Wang et al., 2017b, 2018) could be used to improve fibre quality and yield.
Important candidate genes in QTL clusters
To explore the mechanism of the negative correlation between fibre quality and yield from the standpoint of candidate genes, all the genes located in the six QTL clusters (qClu‐chr16‐1, qClu‐chr20‐1, qClu‐chr6‐2, qClu‐chr25‐2, qClu‐chr13‐2 and qClu‐chr21‐3) were analysed. Among the six QTL clusters, only two (qClu‐chr6‐2 and qClu‐chr13‐2) harboured genes. In qClu‐chr6‐2, 14 of the 49 genes were expressed in both our and Zhang's transcript data. In the qClu‐chr6‐2 GO analysis, Gh_A06G0506 was related to ‘plant‐type cell wall’; Gh_A06G0543 and Gh_A06G0515 were related to ‘Golgi’; Gh_A06G0545 was related to ‘cytoskeleton’; and ‘Gh_A06G0551’ was related to ‘auxin’. Gh_A06G0543, Gh_A06G0545 and Gh_A06G0551 were expressed in both ovules and cotton fibre and may be related to both fibre quality and yield traits; Gh_A06G0506 was expressed only at 5 DPA during cotton fibre development and may be related to FL; Gh_A06G0515 was expressed only in ovules and may be related to yield traits. In qClu‐chr13‐2, three of the four genes were expressed in both our and Zhang's transcript data. The qRT‐PCR analysis results also showed that these three genes were highly expressed at 20, 25 and 30 DPA during cotton fibre development.
Based on the numbers and annotation information of the candidate genes in the QTL clusters, the genes located in QTL clusters qClu‐chr7‐2, qClu‐chr25‐4, qClu‐chr11‐1 and qClu‐chr5‐1 were also examined. Of these, five genes have been previously reported in cotton research; Gh_A07G1524 belongs to the WRKY family and is related to the development of fibres, anthers and other tissues and is also reportedly involved in stress response (Cai et al., 2014; Dou et al., 2014); Gh_D06G0864 is a plant LKR/SDH locus that can encode three related but distinct enzymes associated with Lys catabolism and could finely regulate Lys catabolism during plant development (Tang et al., 2002); Gh_D06G0865 is related to pectin degradation and cotton fibre development (Li et al., 2016b; Liu et al., 2013); Gh_A11G0147 and Gh_A05G2095 are related to the NAC family and are associated with plant development and especially cotton fibre development (Meng et al., 2007; Meng et al., 2007, Shang et al., 2013, 2016, Zhang et al., 2017a).
Based on the annotation information, Gh_A07G1480, Gh_A07G1602 and Gh_A05G2107 were related to ‘Starch and sucrose metabolism’ in KEGG; Gh_A07G1590, Gh_A07G1535, Gh_A11G0125, Gh_A11G0232, Gh_A11G0223, Gh_A11G0165, Gh_A05G2107 and Gh_A05G2088 were directly related to the cell wall, such as ‘cell wall’ and ‘plant‐type cell wall’ in GO and ‘Cell wall/membrane/envelope biogenesis’ in KOG.
Based on the expression information, Gh_A07G1602, Gh_A07G1590, Gh_A07G1535 and Gh_A11G0223 were expressed at 5 DPA and/or 10 DPA during cotton fibre development and may be related to FL; Gh_A05G2107 was expressed at 15 DPA during cotton fibre development and may be related to FS; Gh_A07G1480, Gh_A11G0125 and Gh_A05G2088 were expressed in both the ovule and fibre and may be related to both fibre quality traits and yield traits; and Gh_A11G0232 and Gh_A11G0165 were expressed only in ovules and may be related to yield traits.
In total, there were 23 promising genes (six from qClu‐chr6‐2, five from qClu‐chr7‐2, five from qClu‐chr25‐4, three from qClu‐chr11‐1 and two each from qClu‐chr5‐1 and qClu‐chr13‐2). To determine whether these genes may contribute to the improvement of cotton fibre quality and yield, further studies will need to be completed in the future (Figures S4, S5 and 4).
Experimental procedures
Development and phenotypic evaluation of the mapping population
A RIL population derived from two upland cotton cultivars, 0‐153 and sGK9708, was evaluated and used throughout this study. Briefly, the cross was made in 2001, and a segregation population consisting of 196F6:8 RILs was developed as detailed by Sun et al. (2012). From 2007 to 2015, multi‐environmental evaluations were conducted in 22 different ecological locations across two principal cotton planting areas, Xinjiang Uygur Autonomous Region (XUAR) and Yellow River Valley (YRV). In the years 2007–2010 and 2013, this experiment was described in Zhang's report (Zhang et al., 2015b). In 2011, the population was planted in Anyang and Zhengzhou; in 2012, it was planted in Zhengzhou; in 2014 and 2015, it was planted in Anyang, Alaer, Shihezi and Kuerle. The phenotypic evaluations of the population at each location were conducted in a completely randomized block design of one‐row plots with two replicates in the YRV locations. Each row was 5 m long and 0.8 m apart, with 20 plants planted in each row except for 2013Anyang, which had only one replicate. In the XUAR locations, two‐narrow‐row plots were applied; each row was 3 m long and planted in wide/narrow alternating row spacing of 0.66/0.10 m, with 25 plants in each row. Field management was performed according to the local farming practices.
Three fibre quality traits, FL, FS and FM, and three yield traits, BW, LP and SI, were evaluated for their phenotypic performances throughout the population. Thirty normally opened bolls were sampled from each plot during the harvesting season in September of each testing year to evaluate the phenotypic performances of the aforementioned traits. Briefly, after the seed cotton samples were weighed and ginned, BW, LP and SI were evaluated. The methods of testing the fibre quality traits are described in Sun's and Zhang's reports (Sun et al., 2012; Zhang et al., 2016). One‐way ANOVA was used to test the significance of the differences in the traits between the two parents. The descriptive statistics were calculated with SPSS 20.0 software (SPSS, Chicago, IL), and the variance and heritability were analysed with IciMapping software (Li et al., 2007, 2015c; Meng et al., 2015).
Development and phenotype data analysis of the nature population
The nature population included 278 breeding materials was planted in Anyang of Henan province in 2016 and 2017. The method of planting, phenotype data collection and descriptive statistics were the same as that in the RIL population.
Correlation analysis of the six phenotype traits
The correlations between the different traits in the same environments and between the same traits in different environments were analysed with SPSS 20.0 software if the P value was more than 0.05, and the two traits had no correlation. When the P value was less than 0.05, if the correlation coefficient was from 0 to 0.3 or from −0.3 to 0, the two traits had a weak positive or negative correlation; if the correlation coefficient was from 0.3 to 0.5 or from −0.5 to −0.3, the two traits had a medium positive or negative correlation; and if the correlation coefficient was from 0.5 to 1 or from −1 to −0.5, the two traits had a high positive or negative correlation.
Marker filtration
The SSR markers (Jamshed et al., 2016; Sun et al., 2012; Zhang et al., 2015c), the markers developed by SLAF‐Seq (Zhang et al., 2016) and markers discovered using the IntlCottonSNPConsortium_70k chip (Zhang et al., 2017b) were used to generate the consensus genetic map. Before the construction of the consensus genetic map, the markers were filtered. Markers with no position or more than one position on the genome of upland cotton were removed (Li et al., 2015a; Zhang et al., 2015b), as were markers with unclear genotyping, those with no polymorphism between the parents, those that were heterozygous in at least one parent, those with a missing rate of more than 40% and those that showed segregation distortion with a P value of the chi‐square test less than 0.001.
Consensus genetic map construction
All the markers remaining after filtration were initially partitioned into linkage groups and located on the chromosomes following the procedures detailed in Zhang's research (Zhang et al., 2015a) and according to the reference genome database developed from TM‐1 (Li et al., 2015a; Zhang et al., 2015b). HighMap software was applied to order the alleles and correct genotyping errors within all chromosomes (w = 3, l = 200, r = 7) (Jansen et al., 2001; Liu et al., 2014; Van Ooijen, 2011). The method of processing and constructing the consensus map was the same as described in Zhang's research (Zhang et al., 2016).
The density of markers in the physical map and genetic map was calculated with Perl script with windows of 500 kb and 5 cM, and the picture was drawn by CIRCOS 0.66 (Krzywinski et al., 2009). The segregation distortion of each marker was analysed by the chi‐square test using JoinMap 4.0 software (Van Ooijen, 2006). The SDM loci showing significance with P values between 0.001 and 0.05 were maintained to construct the consensus genetic map, and any region on the map with more than three SDM loci was defined as a segregation distortion region (SDR) (Zhang et al., 2013).
QTL and QTL cluster identification for fibre quality and yield
Windows QTL Cartographer 2.5 (Wang et al., 2001) was applied to map the QTLs using the composite interval mapping method. QTLs identified consistently in at least three environments were considered to be stable (Sun et al., 2012). A positive additive effect indicates that the favourable allele comes from the parent 0‐153, while a negative effect indicates that the favourable allele comes from the parent sGK9708. The parameter of the software and the rules of QTL naming were described in Sun's and Zhang's reports (Sun et al., 2012; Zhang et al., 2016).
The stable QTLs identified were compared with the CottonQTLdb database (http://www.cottonqtldb.org) to determine whether they were novel or had been published in previous studies (Fang et al., 2014; Lacape et al., 2010; Rong et al., 2007; Said et al., 2013, 2015) or previous GWAS research (Fang et al., 2017a,b,c; Huang et al., 2017; Ma et al., 2018; Sun et al., 2017; Wang et al., 2017a). The stable QTLs in the database that shared the same or overlapping confidence intervals as the QTLs found in this study were considered to have been identified in previous studies. Stable QTLs for different traits that shared the same or overlapping confidence intervals were considered to reside in QTL clusters, and the overlapping regions were considered to be the confidence intervals of the QTL clusters.
Candidate gene identification and annotation
The genes located in the confidence intervals of the QTLs and QTL clusters were considered candidate genes. All candidate genes and their corresponding protein sequences were compared with TAIR 10, the Arabidopsis annotation database (https://www.arabidopsis.org/), using BLASTP software. The candidate genes were annotated with GO, KEGG and KOG. The GO annotation information was obtained from the GO databases at http://archive.geneontology.org/latest-lite/ and ftp://ftp.ncbi.nlm.nih.gov/gene/DATA/. The BLASTX software was used to compare the sequences of the candidate genes and the sequences in the database. The results with e values of less than e‐10 were considered to be significant. The KEGG annotation information was obtained from the KOBAS 3.0 software (Wu et al., 2006; Xie et al., 2011). The KOG annotation information for the candidate genes was obtained from the KOG database (ftp://ftp.ncbi.nih.gov/pub/COG/KOG). The rules of comparison were the same as those used for the GO analysis.
RNA sample collection and extraction
Four lines were selected for RNA‐Seq, including the two parents, 0‐153 and sGK9708, and two offspring, 69 307 and 69 362. The 69 307 and 69 362 lines belonged to the RIL population and showed transgressive segregation. The 69 307 had positive transgressive segregation with longer and stronger fibre, while the 69 362 line had negative transgressive segregation with short and weak fibre. All the four lines were selected for quantitative real‐time PCR (qRT‐PCR) analysis. Sample collection and RNA extraction were performed as described in Zou's research (Zou et al., 2018).
RNA library preparation, sequencing and quality control
The RNA samples were used to generate sequencing libraries with Illumina TruSeq™ RNA Sample Preparation Kits (Illumina, San Diego, CA) according to the manufacturer's instructions. Transcriptome sequencing was carried out on an Illumina HiSeq 2500 platform that produced 125 base pair (bp) paired‐end (PE) raw reads (Berry Genomics Co., Ltd). Raw data (raw reads) in FASTQ format were processed using Trimmomatic software (Bolger et al., 2014). In this step, clean data were obtained as follows: first, reads with ≥10% unidentified nucleotides (N) were removed; second, reads with >50% bases having Phred quality <5 were removed; and third, reads with >10 nt aligned to the adapter were removed. Reads with 0 nt aligned to the adapter were also removed to eliminate putative PCR duplicates generated by PCR amplification in the library construction process (read 1 and read 2 of two PE reads that were completely identical). All downstream analyses were based on clean data.
Read mapping and expression level analysis
First, the RNA‐Seq data from Zhang's research were downloaded from the National Center for Biotechnology Information (NCBI) database in SRA format (PRJNA248163) (Zhang et al., 2015b). The processes of transforming the SRA format into FASTQ format, mapping of reads to the upland cotton genome, calculating FPKM values and generating heatmaps are detailed in Zou's research (Zou et al., 2018).
qRT‐PCR verification
The RNA samples of ten materials from 5, 10, 15, 20, 25 and 30 DPA during cotton fibre development were used to conduct qRT‐PCR. The primers of the four genes were designed on the qPrimerDB website (https://biodb.swu.edu.cn/qprimerdb/browse_plants). The procedure was according to Zou and Zhang (Zhang et al., 2019; Zou et al., 2018).
Genotyping and population structure analysis for the nature population
SLAF sequence was used to develop SNP markers for the nature population with the two enzymes of HaeIII and SspI. The sequencing was done with the Illumina HiSeq Xten sequencing platform (Illumina, San Diego, CA), paired‐end 150 bp. The steps to trim the row data were detailed in Su's research (Su et al., 2016). The strategies of analysing the SLAF‐Seq data and population structure were the same as that it in Fang's research (Fang et al., 2017b). The original data have been uploaded to NCBI SRA database (PRJNA542946).
Conflict of interest
The authors declare no conflicts of interest.
Author contribution
Zhang Z analysed and summed all the data, drew the figures and wrote the manuscript; Li JW collected and analysed the phenotype data; Jamshed M developed the SSR markers; Shi YZ, Wang SF and Zhang JH managed the RIL population; Liu AY, Gong JW, Sun FD and Jia F collected and analysed the phenotype data in Huang He basin; Ge Q, Fan LQ and Zhang ZB collected and analysed the phenotype data in Xinjiang; Pan JT, Fan SM and Wang YL developed the chip‐SNP markers; Lu QW, Liu RX Deng XY and Liu P involved in the development of the SLAF‐SNP markers, Zou XY, Jiang X and Zhang CJ analysed the RNA‐Seq data; Li PT, Iqbal MS and Wang YM collected the RNA sample and performed the qRT‐PCR; Zhang CY and Zou J managed and collected the phenotype data in Linqing; Chen H and Tian Q managed and collected the phenotype data in Akesu; Jia XH, Wang BQ and Huang JY managed and collected the phenotype data in Zhengzhou; Ai NJ and Feng GL managed and collected the phenotype data in Shihezi; Hong M and Li SL managed and collected the phenotype data in Kuerle; Lian WM and Wu B managed and collected the phenotype data in Alaer; Hua JP managed and collected the phenotype data in Quzhou; Xu Aixia collected and analysis all the data of nature population; and Shang HH, Gong WK and Yuan YL provided the resources, designed the experiment and revised the manuscript.
Supporting information
Figure S1 The position of all the QTLs for fiber quality and yield traits across 17 environments.
Figure S2 The number of two‐pair‐trait QTL clusters with the same and different directions for additive effect.
Figure S3 The annotation information of the candidate genes in the QTL clusters.
Figure S4 Heatmap of the expression level of 1297 candidate genes during cotton fiber development.
Figure S5 Heatmap of the expression level of 1297 candidate genes in different cotton tissues.
Figure S6 The distribution of the FS, FL, BW and LP in breeding parents.
Figure S7 The information of sequencing data in each line in the whole nature population.
Figure S8 The K value and the population structure of the nature population.
Table S1 Detailed information about the field experiments for the RIL population from 2007 to 2015.
Table S2 Descriptive statistics of the fiber quality and yield traits for the parents and RIL population in 22 environments.
Table S3 Variance and heritability analysis of the fiber quality and yield traits for the RIL population in 22 environments.
Table S4 Correlation analysis between different traits in the same environments.
Table S5 Correlation analysis between the same traits in different environments.
Table S6 Detailed information on the filtering of SLAF‐SNP, chip‐SNP and SSR markers.
Table S7 Detailed information about all the QTLs associated with the six fiber quality and yield traits in 17 environments.
Table S8 The marker intervals and the physical confidence intervals of the stable QTLs.
Table S9 Detailed information about the QTL clusters.
Table S10 The GO annotation information of the candidate genes in the QTLs for each trait.
Table S11 The KEEG annotation information of the candidate genes in the QTLs for each trait.
Table S12 The KOG annotation information of the candidate genes in the QTLs for each trait.
Table S13 A list of candidate genes in the QTL clusters.
Table S14 A list of candidate genes and their annotations in Arabidopsis thaliana.
Table S15 The GO, KEGG and KOG annotation information of the candidate genes in the QTL clusters.
Table S16 The expression of 1297 candidate genes during cotton fiber development and in different tissues.
Table S17 The primer sequence of the qRT‐PCR.
Table S18 The descriptive statistics result of the breeding parents.
Table S19 The congruence analysis results with the previously QTL and GWAS reports.
Table S20 The T‐text results of the breeding parents.
Table S21 The relationship between trait correlation and QTL clusters in previous studies.
Acknowledgements
This work was funded by the National Key R&D Program of China (2016YFD0100500), the Natural Science Foundation of China (31471538 and 31371668), the Agricultural Science and Technology Innovation Program for CAAS (CAAS‐ASTIP‐ICRCAAS), the National High Technology Research and Development Program of China (2012AA101108 and 2009AA101104) and the Central Level of the Scientific Research Institutes for Basic R & D Special Fund Business (1610162014008). Thanks to the Biomarker Technologies Corporation (Beijing, China) for providing the HighMap software and assisting in the construction of the genetic map. Thanks to the Quantitative Genetics Group of CAAS (Beijing, China) for providing the IciMapping software. Thanks to Prof. Tianzhen Zhang at Zhejiang University, Prof. Yuanming Zhang at Huazhong Agricultural University and Prof. Jinfa Zhang at New Mexico State University for their valuable comments.
Contributor Information
Aixia Xu, Email: 799170439@qq.com.
Haihong Shang, Email: shanghaihong@caas.cn.
Wankui Gong, Email: wkgong@aliyun.com.
Youlu Yuan, Email: yuanyoulu@caas.cn.
References
- Bolger, A.M. , Lohse, M. and Usadel, B. (2014) Trimmomatic: a flexible trimmer for Illumina sequence data. Bioinformatics, 30, 2114–2120. [DOI] [PMC free article] [PubMed] [Google Scholar]
- Cai, H.W. and Morishima, H. (2002) QTL clusters reflect character associations in wild and cultivated rice. Theor. Appl. Genet. 104, 1217–1228. [DOI] [PubMed] [Google Scholar]
- Cai, C.P. , Niu, E.L. , Du, H. , Zhao, L. , Feng, Y. and Guo, W.Z. (2014) Genome‐wide analysis of the WRKY transcription factor gene family in Gossypium raimondii and the expression of orthologs in cultivated tetraploid cotton. Crop J. 2, 87–101. [Google Scholar]
- Cao, Z.B. , Zhu, X.F. , Chen, H. and Zhang, T.Z. (2015) Fine mapping of clustered quantitative trait loci for fiber quality on chromosome 7 using a Gossypium barbadense introgressed line. Mol. Breed. 35, 1–13. [Google Scholar]
- Chandnani, R. , Kim, C. , Guo, H. , Shehzad, T. , Wallace, J.G. , He, D.H. , Zhang, Z.S. et al. (2018) Genetic analysis of gossypium fiber quality traits in reciprocal advanced backcross populations. Plant Genome. 11, 170057. [DOI] [PMC free article] [PubMed] [Google Scholar]
- Chee, P.W. , Draye, X. , Jiang, C.X. , Decanini, L. , Delmonte, T.A. , Bredhauer, R. , Smith, C.W. et al. (2005a) Molecular dissection of interspecific variation between Gossypium hirsutum and Gossypium barbadense (cotton) by a backcross‐self approach: I. Fiber elongation. Theor. Appl. Genet. 111, 757–763. [DOI] [PubMed] [Google Scholar]
- Chee, P.W. , Draye, X. , Jiang, C.X. , Decanini, L. , Delmonte, T.A. , Bredhauer, R. , Smith, C.W. et al. (2005b) Molecular dissection of phenotypic variation between Gossypium hirsutum and Gossypium barbadense (cotton) by a backcross‐self approach: III. Fiber length. Theor Appl Genet. 111, 772–781. [DOI] [PubMed] [Google Scholar]
- Diouf, L. , Magwanga, R.O. , Gong, W.F. , He, S.P. , Pan, Z.E. , Jia, Y.H. , Kirungu, J.N. et al. (2018) QTL mapping of fiber quality and yield‐related traits in an intra‐specific upland cotton using genotype by sequencing (GBS). Int. J. Mol. Sci. 19, 441. [DOI] [PMC free article] [PubMed] [Google Scholar]
- Dou, L.L. , Zhang, X.H. , Pang, C.Y. , Song, M.Z. , Wei, H.L. , Fan, S.L. and Yu, S.X. (2014) Genome‐wide analysis of the WRKY gene family in cotton. Mol. Genet. Genomics, 289, 1103–1121. [DOI] [PubMed] [Google Scholar]
- Du, X.M. , Huang, G. , He, S.P. , Yang, Z.E. , Sun, G.F. , Ma, X.F. , Li, N. et al. (2018) Resequencing of 243 diploid cotton accessions based on an updated A genome identifies the genetic basis of key agronomic traits. Nat. Genet. 50, 796–802. [DOI] [PubMed] [Google Scholar]
- Durand, E. , Bouchet, S. , Bertin, P. , Ressayre, A. , Jamin, P. , Charcosset, A. , Dillmann, C. et al. (2012) Flowering time in maize: linkage and epistasis at a major effect locus. Genetics, 190, 1547–1562. [DOI] [PMC free article] [PubMed] [Google Scholar]
- Fang, D.D. , Jenkins, J.N. , Deng, D.D. , McCarty, J.C. , Li, P. and Wu, J.X. (2014) Quantitative trait loci analysis of fiber quality traits using a random‐mated recombinant inbred population in upland cotton (Gossypium hirsutum L.). BMC Genom. 15, 397. [DOI] [PMC free article] [PubMed] [Google Scholar]
- Fang, X.M. , Liu, X.Y. , Wang, X.Q. , Wang, W.W. , Liu, D.X. , Zhang, J. , Liu, D.J. et al. (2017a) Fine‐mapping qFS07.1 controlling fiber strength in upland cotton (Gossypium hirsutum L.). Theor. Appl. Genet. 130, 795–806. [DOI] [PubMed] [Google Scholar]
- Fang, L. , Gong, H. , Hu, Y. , Liu, C.X. , Zhou, B.L. , Huang, T. , Wang, Y.K. et al. (2017b) Genomic insights into divergence and dual domestication of cultivated allotetraploid cottons. Genome Biol. 18, 33. [DOI] [PMC free article] [PubMed] [Google Scholar]
- Fang, L. , Wang, Q. , Hu, Y. , Jia, Y.H. , Chen, J.D. , Liu, B.L. , Zhang, Z.Y. et al. (2017c) Genomic analyses in cotton identify signatures of selection and loci associated with fiber quality and yield traits. Nat. Genet. 49, 1089–1098. [DOI] [PubMed] [Google Scholar]
- Gao, W. , Long, L. , Tian, X.Q. , Xu, F.C. , Liu, J. , Singh, P.K. , Botella, J.R. et al. (2017) Genome editing in cotton with the CRISPR/Cas9 system. Front. Plant Sci. 8, 1364. [DOI] [PMC free article] [PubMed] [Google Scholar]
- Gu, R.L. , Chen, F.J. , Liu, B.R. , Wang, X. , Liu, J.C. , Li, P.C. , Pan, Q.C. et al. (2015) Comprehensive phenotypic analysis and quantitative trait locus identification for grain mineral concentration, content, and yield in maize (Zea mays L.). Theor Appl Gene. 128, 1777–1789. [DOI] [PubMed] [Google Scholar]
- He, D. , Lin, Z. , Zhang, X. , Nie, Y. , Guo, X. , Zhang, Y. and Li, W. (2007) QTL mapping for economic traits based on a dense genetic map of cotton with PCR‐based markers using the interspecific cross of Gossypium hirsutum × Gossypium barbadense . Euphytica, 153, 181–197. [Google Scholar]
- Huang, C. , Nie, X.H. , Shen, C. , You, C.Y. , Li, W. , Zhao, W.X. , Zhang, X.L. et al. (2017) Population structure and genetic basis of the agronomic traits of upland cotton in China revealed by a genome wide association study using high‐density SNPs. Plant Biotechnol. J. 15, 1374. [DOI] [PMC free article] [PubMed] [Google Scholar]
- Hulse‐Kemp, A.M. , Lemm, J. , Plieske, J. , Ashara, H. , Buyyarapu, R. , Fang, D.D. , Frelichowske, J. et al. (2015) Development of a 63K SNP Array for Cotton and High‐Density Mapping of Intraspecific and Interspecific Populations of Gossypium spp.. G3 (Bethesda) 5, 1187–1209. [DOI] [PMC free article] [PubMed] [Google Scholar]
- Jamshed, M. , Jia, F. , Gong, J.W. , Palanga, K.K. , Shi, Y.Z. , Li, J.W. , Shang, H.H. et al. (2016) Identification of stable quantitative trait loci (QTLs) for fiber quality traits across multiple environments in Gossypium hirsutum recombinant inbred line population. BMC Genom. 17, 197. [DOI] [PMC free article] [PubMed] [Google Scholar]
- Janga, M.R. , Campbell, L.M. and Rathorel, K.S. (2017) CRISPR/Cas9‐mediated targeted mutagenesis in upland cotton (Gossypium hirsutum L.). Plant Mol. Biol. 94, 349–360. [DOI] [PubMed] [Google Scholar]
- Jansen, J. , de Jong, A.G. and van Ooijen, J.W. (2001) Constructing dense genetic linkage maps. Theor. Appl. Genet. 102, 1113–1122. [Google Scholar]
- Jia, X.Y. , Wang, H.T. , Pang, C.Y. , Ma, Q.F. , Su, J.J. , Wei, H.L. , Song, M.Z. et al. (2018) QTL delineation for five fiber quality traits based on an intra‐specific Gossypium hirsutum L. recombinant inbred line population. Mol. Genet. Genomics, 293, 831–843. [DOI] [PubMed] [Google Scholar]
- Krzywinski, M. , Schein, J. , Birol, I. , Connors, J. , Gascoyne, R. , Horsman, D. , Jones, S.J. et al. (2009) Circos: an information aesthetic for comparative genomics. Genome Res. 19, 1639–1645. [DOI] [PMC free article] [PubMed] [Google Scholar]
- Ku, L.X. , Zhang, L.K. , Tian, Z.Q. , Guo, S.L. , Su, H.H. , Ren, Z.Z. , Wang, Z.Y. et al. (2015) Dissection of the genetic architecture underlying the plant density response by mapping plant height related traits in maize (Zea mays L.). Mol. Genet. Genomics, 290, 1223–1233. [DOI] [PubMed] [Google Scholar]
- Lacape, J.M. , Jacobs, J. , Arioli, T. , Derijcker, R. , Forestier‐Chiron, N. , Llewellyn, D. , Jean, J. et al. (2009) A new interspecific, Gossypium hirsutum × G. barbadense, RIL population: towards a unified consensus linkage map of tetraploid cotton. Theor. Appl. Genet. 119, 281–292. [DOI] [PubMed] [Google Scholar]
- Lacape, J.M. , Llewellyn, D. , Jacobs, J. , Arioli, T. , Becker, D. , Calhoun, S. , Al‐Ghazi, Y. et al. (2010) RMeseeartcah a‐raticnlealysis of cotton fiber quality QTLs across diverse environments in a Gossypium hirsutum x G.barbadense RIL population. BMC Plant Biol. 10, 132. [DOI] [PMC free article] [PubMed] [Google Scholar]
- Li, H.H. , Ye, G.Y. and Wang, J.K.Wang . (2007) A modified algorithm for the improvement of composite interval mapping. Genetics, 175, 361–374. [DOI] [PMC free article] [PubMed] [Google Scholar]
- Li, F.G. , Fan, G.Y. , Wang, K.B. , Sun, F.M. , Yuan, Y.L. , Song, G.L. , Lin, Q. et al. (2014) Genome sequence of the cultivated cotton Gossypium arboretum . Nat. Genet. 46, 567–572. [DOI] [PubMed] [Google Scholar]
- Li, F.G. , Fan, G.Y. , Lu, C.R. , Xiao, G.H. , Zou, C.S. , Kohel, R.J. , Ma, Z.Y. et al. (2015a) Genome sequence of cultivated upland cotton (Gossypium hirsutum TM‐1). Nat. Biotechnol. 33, 524–530. [DOI] [PubMed] [Google Scholar]
- Li, P.C. , Chen, F.J. , Cai, H.G. , Liu, J.C. , Pan, Q.C. , Liu, Z.G. , Gu, R.L. et al. (2015b) A genetic relationship between nitrogen use efficiency and seedling root traits in maize as revealed by QTL analysis. J. Exp. Bot. 66, 3175–3188. [DOI] [PMC free article] [PubMed] [Google Scholar]
- Li, S.S. , Wang, J.K. and Zhang, L.Y. (2015c) Inclusive composite interval mapping of QTL by environment interactions in biparental populations. PLoS ONE, 10, e132414. [DOI] [PMC free article] [PubMed] [Google Scholar]
- Li, C. , Dong, Y.T. , Zhao, T.L. , Li, L. , Li, C. , Yu, E. , Mei, L. et al. (2016a) Genome‐wide SNP linkage mapping and QTL analysis for fiber quality and yield traits in the upland cotton recombinant inbred lines population. Front. Plant Sci. 7, 1356. [DOI] [PMC free article] [PubMed] [Google Scholar]
- Li, W.J. , Shang, H.H. , Ge, Q. , Zou, C.S. , Cai, J. , Wang, D.J. , Fan, S.M. et al. (2016b) Genome‐wide identification, phylogeny and expression analysis of pectin methylesterases reveal their major role in cotton fiber development. BMC Genom. 17, 1000. [DOI] [PMC free article] [PubMed] [Google Scholar]
- Li, Y.Y. , Shen, A. , Xiong, W. , Sun, Q.L. , Luo, Q. , Song, T. , Li, Z.L. et al. (2016c) Overexpression of OsHox32 results in pleiotropic effects on plant type architecture and leaf development in rice. Rice, 9, 46. [DOI] [PMC free article] [PubMed] [Google Scholar]
- Liu, Q.X. , Talbot, M. and Llewellyn, D.J. (2013) Pectin methylesterase and pectin remodelling differ in the fibre walls of two gossypium species with very different fibre properties. PLoS ONE, 8, e65131. [DOI] [PMC free article] [PubMed] [Google Scholar]
- Liu, D.Y. , Ma, C.X. , Hong, W.G. , Huang, L. , Liu, M. , Liu, H. , Zeng, H.P. et al. (2014) Construction and analysis of high‐density linkage map using high‐throughput sequencing data. PLoS ONE, 9, e98855. [DOI] [PMC free article] [PubMed] [Google Scholar]
- Liu, X. , Zhao, B. , Zheng, J.H. , Hu, Y. , Lu, G. , Yang, C.Q. , Chen, J.D. et al. (2015) Gossypium barbadense genome sequence provides insight into the evolution of extra‐long staple fiber and specialized metabolites. Sci. Rep. 5, 14139. [DOI] [PMC free article] [PubMed] [Google Scholar]
- Liu, D.X. , Zhang, J. , Liu, X.Y. , Wang, W.W. , Liu, D.X. , Teng, Z.H. , Fang, X.M. et al. (2016) Fine mapping and RNA‐Seq unravels candidate genes for a major QTL controlling multiple fiber quality traits at the T1 region in upland cotton. BMC Genom. 17, 295. [DOI] [PMC free article] [PubMed] [Google Scholar]
- Liu, X.Y. , Teng, Z.H. , Wang, J.X. , Wu, T.T. , Zhang, Z.Q. , Deng, X.P. , Fang, X.M. et al. (2017) Enriching an intraspecific genetic map and identifying QTL for fiber quality and yield component traits across multiple environments in upland cotton (Gossypium hirsutum L.). Mol. Genet. Genomics, 292, 1281–1306. [DOI] [PubMed] [Google Scholar]
- Ma, Z.Y. , He, S.P. , Wang, X.F. , Sun, J.L. , Zhang, Y. , Zhang, G.Y. , Wu, L.Q. et al. (2018) Resequencing a core collection of upland cotton identifies genomic variation and loci influencing fiber quality and yield. Nat. Genet. 50, 803–813. [DOI] [PubMed] [Google Scholar]
- Meng, C.M. , Cai, C.P. , Zhang, T.Z. and Guo, W.Z. (2007) Characterization of six novel NAC genes and their responses to abiotic stresses in Gossypium hirsutum L. Plant Sci. 176, 352–359. [Google Scholar]
- Meng, L. , Li, H.H. , Zhang, L.Y. and Wang, J.K. (2015) QTL IciMapping: Integrated software for genetic linkage map construction and quantitative trait locus mapping in biparental populations. Crop J. 3, 26–283. [Google Scholar]
- Naoumkina, M. , Bechere, E. , Fang, D.D. , Thyssen, G.N. and Florane, C.B. (2017) Genome‐wide analysis of gene expression of EMS‐induced short fiber mutant Ligon lintless‐y (liy) in cotton (Gossypium hirsutum L.). Genomics, 109, 320–329. [DOI] [PubMed] [Google Scholar]
- Ning, Z.Y. , Chen, H. , Mei, H.X. and Zhang, T.Z. (2014) Molecular tagging of QTLs for fiber quality and yield in the upland cotton cultivar Acala‐Prema. Euphytica, 195, 143–156. [Google Scholar]
- Park, Y.H. , Alabady, M.S. , Ulloa, M. , Sickler, B. , Wilkins, T.A. , Yu, J. , Stelly, D.M. et al. (2005) Genetic mapping of new cotton fiber loci using EST‐derived microsatellites in an interspecific recombinant inbred line cotton population. Mol Gen Genomics. 274, 428–441. [DOI] [PubMed] [Google Scholar]
- Patel, J.D. , Wright, R.J. , Auld, D. , Chandnani, R. , Goff, V.H. , Ingles, J. , Pierce, G.J. et al. (2014) Alleles conferring improved fiber quality from EMS mutagenesis of elite cotton genotypes. Theor. Appl. Genet. 127, 821–830. [DOI] [PubMed] [Google Scholar]
- Paterson, A.H. , Saranga, Y. , Menz, M. , Jiang, C.‐X. and Wright, R.J. (2003) QTL analysis of genotype 3 environment interactions affecting cotton fiber quality. Theor. Appl. Genet. 106, 384–396. [DOI] [PubMed] [Google Scholar]
- Paterson, A.H. , Wendel, J.F. , Gundlach, W.H. , Guo, H. , Jenkins, J. , Jin, D. , Llewellyn, D. et al. (2012) Repeated polyploidization of Gossypium genomes and the evolution of spinnable cotton fibres. Nature, 492, 423–427. [DOI] [PubMed] [Google Scholar]
- Percival, A.E. , Wendel, J.F. and Stewart, J.M. (1999) Taxonomy and gemplasm resources. In Cotton: Origin, History, Technology, and Production, Vol. 19 ( Smith, C.W. and Cothren, J.T. , eds), pp. 33–63. New York, NY: Wiley. [Google Scholar]
- Qi, H.K. , Wang, N. , Qiao, W.Q. , Xu, Q.H. , Zhou, H. , Shi, J.B. , Yan, G.T. et al. (2017) Construction of a high‐density genetic map using genotyping by sequencing (GBS) for quantitative trait loci (QTL) analysis of three plant morphological traits in upland cotton (Gossypium hirsutum L.). Euphytica, 213, 83. [Google Scholar]
- Qin, H.D. , Guo, W. , Zhang, Y.M. and Zhang, T. (2008) QTL mapping of yield and fiber traits based on a four‐way cross population in Gossypium hirsutum L. Theor. Appl. Genet. 117, 883–894. [DOI] [PubMed] [Google Scholar]
- Reddy, R.N. , Madhusudhana, R. , Mohan, S.M. , Chakravarth, D.V.N. , Mehtre, S.P. , Swwtharama, N. and Patil, J.V. (2013) Mapping QTL for grain yield and other agronomic traits in post‐rainy sorghum [Sorghum bicolor (L.) Moench]. Theor. Appl. Genet. 126, 1921–1939. [DOI] [PubMed] [Google Scholar]
- Rong, J.K. , Abbey, C. , Browers, J.E. , Brubaker, C.L. , Cheng, C. , Chee, P.W. , Delmonte, T.A. et al. (2004) A 3347‐locus genetic recombination map of sequence‐tagged sites reveals features of genome organization, transmission and evolution of cotton (Gossypium). Genetics, 166, 389–417. [DOI] [PMC free article] [PubMed] [Google Scholar]
- Rong, J.K. , Feltus, F.A. , Waghmare, V.N. , Pierce, G.J. , Chee, P.W. , Draye, X. , Saranga, Y. et al. (2007) Meta‐analysis of polyploid cotton QTL shows unequal contributions of subgenomes to a complex network of genes and gene clusters implicated in lint fiber development. Genetics, 176, 2577–2588. [DOI] [PMC free article] [PubMed] [Google Scholar]
- Said, J.I. , Lin, Z.X. , Zhang, X.L. , Song, M.Z. and Zhang, J.F. (2013) A comprehensive meta QTL analysis for fiber quality, yield, yield related and morphological traits, drought tolerance, and disease resistance in tetraploid cotton. BMC Genom. 14, 776. [DOI] [PMC free article] [PubMed] [Google Scholar]
- Said, J.I. , Knapka, J.A. , Song, M.Z. and Zhang, J.F. (2015) Cotton QTLdb: a cotton QTL database for QTL analysis, visualization, and comparison between Gossypium hirsutum and G. hirsutum × G. barbadense populations. Mol. Genet. Genomics, 290, 1615–1625. [DOI] [PubMed] [Google Scholar]
- Shang, H.H. , Li, W. , Zou, C.S. and Yuan, Y.L. (2013) Analyses of the NAC Transcription factor gene family in Gossypium raimondii Ulbr.: chromosomal location, structure, phylogeny, and expression patterns. J. Integr. Plant Biol. 55, 663–676. [DOI] [PubMed] [Google Scholar]
- Shang, L.G. , Liang, Q.Z. , Wang, Y.M. , Wang, X.C. , Wang, K.B. , Abduweli, A. , Ma, L.L. et al. (2015) Identification of stable QTLs controlling fiber traits properties in multi‐environment using recombinant inbred lines in upland cotton (Gossypium hirsutum L.). Euphytica, 205, 877–888. [Google Scholar]
- Shang, H.H. , Wang, Z.N. , Zou, C.S. , Zhang, Z. , Li, W.J. , Shi, Y.Z. , Gong, W.K. et al. (2016) Comprehensive analysis of NAC transcription factors in diploid Gossypium: sequence conservation and expression analysis uncover their roles during fiber development. Sci. China Life Sci. 59, 142–153. [DOI] [PubMed] [Google Scholar]
- Shen, X.L. , Guo, W.Z. , Zhu, X.F. , Yuan, Y.L. , Yu, J.Z. , Kohel, R.J. and Zhagn, T.Z. (2005) Molecular mapping of QTLs for fiber qualities in three diverse lines in upland cotton using SSR markers. Mol. Breed. 15, 169–181. [Google Scholar]
- Shen, X.L. , Guo, W.Z. , Liu, Q.X. , Zhu, X.F. , Yuan, Y.L. and Zhang, T.Z. (2007) Genetic mapping of quantitative trait loci for fiber quality and yield trait by RIL approach in upland cotton. Euphytica, 155, 371–380. [Google Scholar]
- Song, W.W. , Wang, M. , Su, W. , Lu, Q.W. , Xiao, X.H. , Cai, J. , Zhang, Z. et al. (2017) Genetic and phenotypic effects of chromosome segments introgressed from Gossypium barbadense into Gossypium hirsutum . PLoS ONE, 12, e0184882. [DOI] [PMC free article] [PubMed] [Google Scholar]
- Su, J.J. , Pang, C.Y. , Wei, H.L. , Li, L.B. , Liang, B. , Wang, C.X. , Song, M.Z. , et al. (2016) Identification of favorable SNP alleles and candidate genes for traits related to early maturity via GWAS in upland cotton. BMC Genomics. 17, 687. [DOI] [PMC free article] [PubMed] [Google Scholar]
- Sun, F.D. , Zhang, J.H. , Wang, S.F. , Gong, W.K. , Shi, Y.Z. , Liu, A.Y. , Li, J.W. et al. (2012) QTL mapping for fiber quality traits across multiple generations and environments in upland cotton. Mol. Breed. 30, 569–582. [Google Scholar]
- Sun, Z.W. , Wang, X.F. , Liu, Z.W. , Gu, Q.S. , Zhang, Y. , Li, Z.K. , Ke, H.F. et al. (2017) Genome‐wide association study discovered genetic variation and candidate genes of fiber quality traits in Gossypium hirsutum L. Plant Biotechnol. J. 15, 982–996. [DOI] [PMC free article] [PubMed] [Google Scholar]
- Tan, Z.Y. , Fang, X.M. , Tang, S.Y. , Zhang, J. , Liu, D.J. , Teng, Z.H. , Li, L. et al. (2014) Genetic map and QTL controlling fiber quality traits in upland cotton (Gossypium hirsutum L.). Euphytica, 203, 615–628. [Google Scholar]
- Tan, Z.Y. , Zhang, Z.Q. , Sun, X.J. , Li, Q.Q. , Sun, Y. , Yang, P. , Wang, W.W. et al. (2018) Genetic map construction and fiber quality QTL mapping using the CottonSNP80K array in upland cotton. Front. Plant Sci. 9, 225. [DOI] [PMC free article] [PubMed] [Google Scholar]
- Tang, G.L. , Zhu, X.H. , Gakiere, B. , Levanony, H. , Kahana, A. and Galili, G. (2002) The bifunctional LKR/SDH Locus of plants also encodes a highly active monofunctional lysine‐ketoglutarate reductase using a polyadenylation signal located within an intron. Plant Physiol. 130, 147–154. [DOI] [PMC free article] [PubMed] [Google Scholar]
- Tang, S.Y. , Teng, Z.H. , Zhai, T.F. , Fang, X.M. , Liu, F. , Liu, D.J. , Zhang, J. et al. (2015) Construction of genetic map and QTL analysis of fiber quality traits for upland cotton (Gossypium hirsutum L.). Euphytica, 201, 195–213. [Google Scholar]
- Ulloa, M. , Meredith, W.R. Jr , Shappley, Z.W. and Kahler, A.L. (2002) RFLP genetic linkage maps from four F2.3 populations and a joinmap of Gossypium hirsutum L. Theor. Appl. Genet. 104, 200–208. [DOI] [PubMed] [Google Scholar]
- Ulloa, M. , Saha, S. , Jenkins, J.N. , Meredith, W.R. Jr , McCarty, J.C. Jr and Stelly, D.M. (2005) Chromosomal Assignment of RFLP Linkage Groups Harboring Important QTLs on an Intraspecific Cotton (Gossypium hirsutum L.) Joinmap. J. Hered. 96, 132–144. [DOI] [PubMed] [Google Scholar]
- van Ooijen, J.W. (2006) JoinMap 4.0: Software for the Calculation of Genetic Linkage Maps in Experimental Populations. Wageningen: Kyazma B.V. [Google Scholar]
- van Ooijen, J.W. (2011) Multipoint maximum likelihood mapping in a full‐sib family of an outbreeding species. Genet. Res. 93, 343–349. [DOI] [PubMed] [Google Scholar]
- Vikram, P. , Swamy, B.P.M. , Dixit, S. , Singh, R. , Singh, B.P. , Mirl, B. , Kohli, A. et al. (2015) Drought susceptibility of modern rice varieties: an effect of linkage of drought tolerance with undesirable traits. Sci. Rep. 5, 14799. [DOI] [PMC free article] [PubMed] [Google Scholar]
- Wang, S , Basten, C.J. and Zeng, Z.B. (2001) Windows QTL Cartographer 2.5. Department of Statistics, North Carolina State University, Raleigh, NC. http://statgen.ncsu.edu/qtlcart/WQTLCart.htm. Accessed 2013 Feb 1
- Wang, K.B. , Wang, Z.W. , Li, F.G. , Ye, W.W. , Wang, J.Y. , Song, G.L. , Yue, Z. et al. (2012) The draft genome of a diploid cotton Gossypium raimondii . Nat. Genet. 44, 1098–1103. [DOI] [PubMed] [Google Scholar]
- Wang, H.T. , Jin, X. , Zhang, B.B. , Shen, C. and Lin, Z.X. (2015a) Enrichment of an intraspecific genetic map of upland cotton by developing markers using parental RAD sequencing. DNA Res. 22, 147–160. [DOI] [PMC free article] [PubMed] [Google Scholar]
- Wang, Y.K. , Ning, Z.Y. , Hu, Y. , Chen, J.D. , Zhao, R. , Chen, H. , Ai, N.J. et al. (2015b) Molecular mapping of restriction‐site associated DNA markers in allotetraploid upland cotton. PLoS ONE, 10, e0124781. [DOI] [PMC free article] [PubMed] [Google Scholar]
- Wang, H.T. , Huang, C. , Zhao, W.X. , Dai, B.S. , Shen, C. , Zhang, B.B. , Li, D.G. et al. (2016) Identification of QTL for fiber quality and yield traits using two immortalized backcross populations in upland cotton. PLoS ONE, 11, e0166970. [DOI] [PMC free article] [PubMed] [Google Scholar]
- Wang, M.J. , Tu, L.L. , Lin, M. , Lin, Z.X. , Wang, P.C. , Yang, Q.Y. , Ye, Z.X. et al. (2017a) Asymmetric subgenome selection and cis‐regulatory divergence during cotton domestication. Nat. Genet. 49, 579–587. [DOI] [PubMed] [Google Scholar]
- Wang, Y.L. , Meng, Z.G. , Liang, C.Z. , Meng, Z.H. , Wang, Y. , Sun, G.Q. , Zhu, T. et al. (2017b) Increased lateral root formation by CRISPR/Cas9‐mediated editing of arginase genes in cotton. Sci. China Life Sci. 5, 524–527. [DOI] [PubMed] [Google Scholar]
- Wang, P.C. , Zhang, J. , Sun, L. , Ma, Y.Z. , Xu, J. , Liang, S.J. , Deng, J.W. et al. (2018) High efficient multisites genome editing in allotetraploid cotton (Gossypium hirsutum) using CRISPR/Cas9 system. Plant Biotechnol. J. 16, 137–150. [DOI] [PMC free article] [PubMed] [Google Scholar]
- Wang, M.J. , Tu, L.L. , Yuan, D.J. , Zhu, D. , Shen, C. , Li, J.Y. , Liu, F.Y. et al. (2019) Reference genome sequences of two cultivated allotetraploid cottons, Gossypium hirsutum and Gossypium barbadense . Nat. Genet. 51, 224–229. [DOI] [PubMed] [Google Scholar]
- Wu, J.M. , Mao, X.Z. , Cai, T. , Luo, J.C. and Wei, L.P. (2006) KOBAS server: a web‐based platform for automated annotation and pathway identification. Nucleic Acids Res. 34, 720–724. [DOI] [PMC free article] [PubMed] [Google Scholar]
- Xie, C. , Mao, X.Z. , Huang, J.J. , Ding, Y. , Wu, J.M. , Dong, S. , Kong, L. et al. (2011) KOBAS 2.0: a web server for annotation and identification of enriched pathways and diseases. Nucleic Acids Res. 39, 316–322. [DOI] [PMC free article] [PubMed] [Google Scholar]
- Xie, Q. , Li, N. , Yang, Y. , Lv, Y. , Yao, H. , Wei, R. , Sparkes, D.L. et al. (2018) Pleiotropic effects of the wheat domestication gene Q on yield and grain morphology. Planta, 247, 1089–1098. [DOI] [PubMed] [Google Scholar]
- Xu, P. , Gao, J. , Cao, Z.B. , Chee, P.W. , Guo, Q. , Xu, Z.Z. , Paterson, A.H. et al. (2017) Fine mapping and candidate gene analysis of qFL‐chr1, a fiber length QTL in cotton. Theor. Appl. Genet. 130, 1309–1319. [DOI] [PubMed] [Google Scholar]
- Yang, X.L. , Zhou, X.D. , Wang, X.F. , Li, Z.K. , Zhang, Y. , Liu, H.W. , Wu, L.Q. et al. (2015) Mapping QTL for cotton fiber quality traits using simple sequence repeat markers, conserved intron‐scanning primers,)and transcript‐derived fragments. Euphytica, 201, 215–230. [Google Scholar]
- You, W.J. , Feng, Y.R. , Shen, Y.H. , Chen, Y.R. , Chen, T.Y. and Fu, S.F. (2019) Silencing of NbCMT3s has pleiotropic effects on development by interfering with autophagy‐related genes in Nicotiana benthamiana . Plant Cell Physiol. 60, 1120–1135. [DOI] [PubMed] [Google Scholar]
- Yu, J.W. , Zhang, K. , Li, S.Y. , Yu, S.X. , Zhai, H.H. , Wu, M. , Li, X.L. et al. (2013a) Mapping quantitative trait loci for lint yield and fiber quality across environments in a Gossypium hirsutum × Gossypium barbadense backcross inbred line population. Theor. Appl. Genet. 126, 275–287. [DOI] [PubMed] [Google Scholar]
- Yu, J.W. , Yu, S.X. , Gore, Michael , Wu, M. , Zhai, H.H. , Li, X.L. , Fan, S.L. et al. (2013b) Identification of quantitative trait loci across interspecific F2, F2:3 and testcross populations for agronomic and fiber traits in tetraploid cotton. Euphytica, 191, 375–389. [Google Scholar]
- Yuan, D.J. , Tang, Z.H. , Wang, M.J. , Gao, W.H. , Tu, L.L. , Jin, X. , Chen, L.L. et al. (2015) The genome sequence of Sea‐Island cotton (Gossypium barbadense) provides insights into the allopolyploidization and development of superior spinnable fibres. Sci. Rep. 5, 17662. [DOI] [PMC free article] [PubMed] [Google Scholar]
- Yuan, X. , Huang, P. , Wang, R.Q. , Li, H.Y. , Lv, X.Q. , Duan, M. , Tang, H.J. et al. (2018) A zinc finger transcriptional repressor confers pleiotropic effects on rice growth and drought tolerance by down‐regulating stress‐responsive genes. Plant Cell Physiol. 59, 2129–2142. [DOI] [PubMed] [Google Scholar]
- Zhai, H.C. , Gong, W.K. , Tan, Y.N. , Liu, A.Y. , Song, W.W. , Li, J.W. , Deng, Z.Y. et al. (2016) Identification of Chromosome Segment Substitution Lines of Gossypium barbadense Introgressed in G. hirsutum and Quantitative Trait Locus Mapping for Fiber Quality and Yield Traits. PLoS ONE, 11, e0159101. [DOI] [PMC free article] [PubMed] [Google Scholar]
- Zhang, K. , Zhang, J. , Ma, J. , Tang, S.Y. , Liu, D.J. , Teng, Z.H. et al. (2012) Genetic mapping and quantitative trait locus analysis of fiber quality traits using a three‐parent composite population in upland cotton (Gossypium hirsutum L.). Mol. Breed. 29, 335–348. [Google Scholar]
- Zhang, Y.X. , Wang, L.H. , Xin, H.G. , Li, D.H. , Ma, C.X. , Ding, X. and Zhang, X.R. (2013) Construction of a high‐density genetic map for sesame based on large scale marker development by specific length amplified fragment (SLAF) sequencing. BMC Plant Biol. 13, 141. [DOI] [PMC free article] [PubMed] [Google Scholar]
- Zhang, J. , Zhang, Q.X. , Cheng, T.R. , Yang, W.R. , Pan, H.T. , Zhong, J.J. , Huang, L. et al. (2015a) High‐density genetic map construction and identification of a locus controlling weeping trait in an ornamental woody plant (Prunus mume Sieb. et Zucc). DNA Res. 22, 183–191. [DOI] [PMC free article] [PubMed] [Google Scholar]
- Zhang, T.Z. , Hu, Y. , Jiang, W.K. , Fang, L. , Guan, X.Y. , Chen, J.D. , Zhang, J.B. et al. (2015b) Sequencing of allotetraploid cotton (Gossypium hirsutum L. acc. TM‐1) provides a resource for fiber improvement. Nat. Biotechnol. 33, 531–537. [DOI] [PubMed] [Google Scholar]
- Zhang, Z. , Li, J.W. , Jamshed, M. , Cai, J. , Jia, F. , Shi, Y.Z. , Gong, J.W. et al. (2015c) High resolution consensus mapping of quantitative trait loci for fiber strength, length and micronaire on chromosome 25 of the upland cotton (Gossypium hirsutum L.). PLoS ONE, 10, e0135430. [DOI] [PMC free article] [PubMed] [Google Scholar]
- Zhang, Z. , Shang, H.H. , Shi, Y.Z. , Huang, L. , Li, J.W. , Ge, Q. , Gong, J.W. et al. (2016) Construction of a high‐density genetic map by specific locus amplified fragment sequencing (SLAF‐seq) and its application to quantitative trait loci (QTL) analysis for boll weight in upland cotton (Gossypium hirsutum.). BMC Plant Biol. 16, 79. [DOI] [PMC free article] [PubMed] [Google Scholar]
- Zhang, J. , Huang, G.Q. , Zou, D. , Yan, J.Q. , Li, Y. , Hu, S. and Li, X.B. (2017a) The cotton (Gossypium hirsutum) NAC transcription factor (FSN1) as a positive regulator participates in controlling secondary cell wall biosynthesis and modification of fibers. New Phytol. 217, 625–640. [DOI] [PubMed] [Google Scholar]
- Zhang, Z. , Ge, Q. , Liu, A.Y. , Li, J.W. , Gong, J.W. , Shang, H.H. , Shi, Y.Z. et al. (2017b) Construction of a high‐density genetic map and its application to QTL identification for fiber strength in upland cotton. Crop Sci. 57, 774–788. [Google Scholar]
- Zhang, Z. , Zou, X.Y. , Huang, Z. , Fan, S.M. , Ge, Q. , Liu, A.Y. , Gong, J.W. et al. (2019) Genome‐wide identification and analysis of the evolution and expression patterns of the GATA transcription factors in three species of Gossypium genus. Gene, 680, 72–83. [DOI] [PubMed] [Google Scholar]
- Zhao, X.Q. , Daygon, V.D. , McNally, K.L. , Hamilton, R.S. , Xie, F.M. , Reinke, R.F. and Fitzgerald, M.A. (2016) Identification of stable QTLs causing chalk in rice grains in nine environments. Theor. Appl. Genet. 129, 141–153. [DOI] [PubMed] [Google Scholar]
- Zhao, K. , Xiao, J. , Liu, Y. , Chen, S. , Yuan, C. , Cao, A. , You, F.M. et al. (2018) Rht23 (5Dq’) likely encodes a Q homeologue with pleiotropic effects on plant height and spike compactness. Theor. Appl. Genet. 131, 1825–1834. [DOI] [PubMed] [Google Scholar]
- Zou, X.Y. , Zhang, Z. , Ge, Q. , Fan, S.M. , Liu, A.Y. , Gong, W.K. , Li, J.W. et al. (2018) Genome‐wide identification and analysis of the evolution and expression patterns of the cellulose synthase gene superfamily in Gossypium species. Gene, 646, 28–38. [DOI] [PubMed] [Google Scholar]
Associated Data
This section collects any data citations, data availability statements, or supplementary materials included in this article.
Supplementary Materials
Figure S1 The position of all the QTLs for fiber quality and yield traits across 17 environments.
Figure S2 The number of two‐pair‐trait QTL clusters with the same and different directions for additive effect.
Figure S3 The annotation information of the candidate genes in the QTL clusters.
Figure S4 Heatmap of the expression level of 1297 candidate genes during cotton fiber development.
Figure S5 Heatmap of the expression level of 1297 candidate genes in different cotton tissues.
Figure S6 The distribution of the FS, FL, BW and LP in breeding parents.
Figure S7 The information of sequencing data in each line in the whole nature population.
Figure S8 The K value and the population structure of the nature population.
Table S1 Detailed information about the field experiments for the RIL population from 2007 to 2015.
Table S2 Descriptive statistics of the fiber quality and yield traits for the parents and RIL population in 22 environments.
Table S3 Variance and heritability analysis of the fiber quality and yield traits for the RIL population in 22 environments.
Table S4 Correlation analysis between different traits in the same environments.
Table S5 Correlation analysis between the same traits in different environments.
Table S6 Detailed information on the filtering of SLAF‐SNP, chip‐SNP and SSR markers.
Table S7 Detailed information about all the QTLs associated with the six fiber quality and yield traits in 17 environments.
Table S8 The marker intervals and the physical confidence intervals of the stable QTLs.
Table S9 Detailed information about the QTL clusters.
Table S10 The GO annotation information of the candidate genes in the QTLs for each trait.
Table S11 The KEEG annotation information of the candidate genes in the QTLs for each trait.
Table S12 The KOG annotation information of the candidate genes in the QTLs for each trait.
Table S13 A list of candidate genes in the QTL clusters.
Table S14 A list of candidate genes and their annotations in Arabidopsis thaliana.
Table S15 The GO, KEGG and KOG annotation information of the candidate genes in the QTL clusters.
Table S16 The expression of 1297 candidate genes during cotton fiber development and in different tissues.
Table S17 The primer sequence of the qRT‐PCR.
Table S18 The descriptive statistics result of the breeding parents.
Table S19 The congruence analysis results with the previously QTL and GWAS reports.
Table S20 The T‐text results of the breeding parents.
Table S21 The relationship between trait correlation and QTL clusters in previous studies.