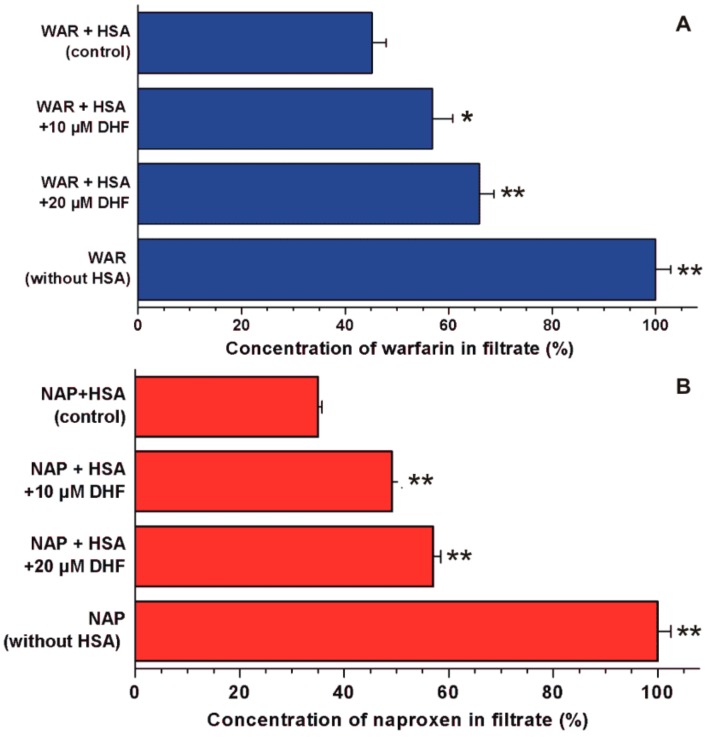
Figure 4.
Displacement of Site I (warfarin, WAR) and Site II (naproxen, NAP) markers from HSA by DHF. Concentrations of warfarin (A) and naproxen (B) in the filtrate: Before the ultrafiltration, the samples contained warfarin and HSA (1.0 and 5.0 μM, respectively) or naproxen and HSA (1.0 and 1.5 μM, respectively) with or without 10 and 20 μM DHF in PBS (pH 7.4; * p < 0.05, ** p < 0.01). In each model, the filtered concentration of site markers was compared to the concentration measured in the filtrate when no HSA was added to the site markers (100%).

