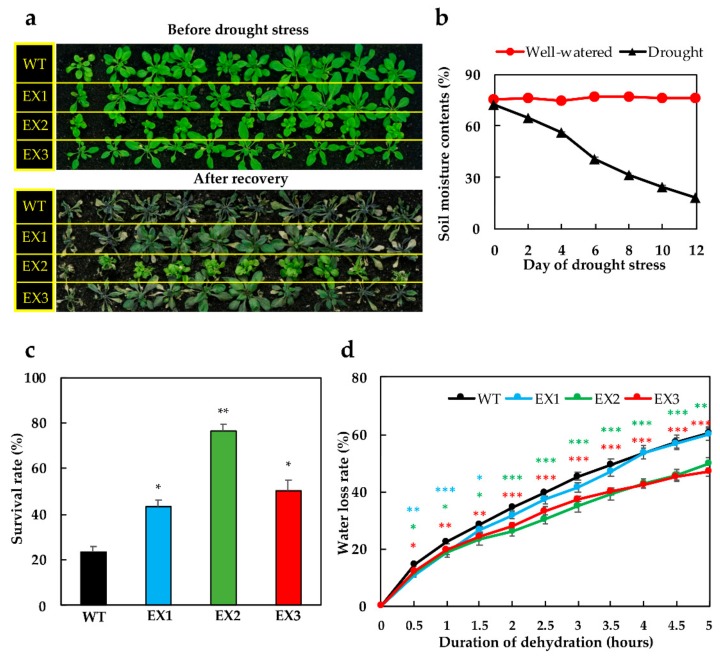
Figure 2.
Examinations of drought survival rates and water loss rates of the GmNAC109-EX1, 2, and 3 lines. (a) Phenotypes of wild-type (WT) and EX lines before the drought treatment (i.e., 28-day-old) and after the recovery period (i.e., 43-day-old plants; 12-day-non-irrigation followed by 3-day re-watering). (b) Monitored relative soil moisture contents during the drought treatment are shown (n = 6 readings/time point). (c) Recorded survival rates of WT and EX plants after re-watering (n = 3 replicates/genotype; 10 plants/replicate). (d) Average water loss rates of leaves detached from 28-day old plants and left air-dehydrated over a 5-h duration (n = 9 replicates/genotype; 2 leaves/plant/replicate). Standard errors were calculated and shown by error bars. Asterisks indicate significant differences, as determined by a Student’s t-test, between each EX line and the WT (* p-value < 0.05; ** p-value < 0.01; *** p-value < 0.001).

