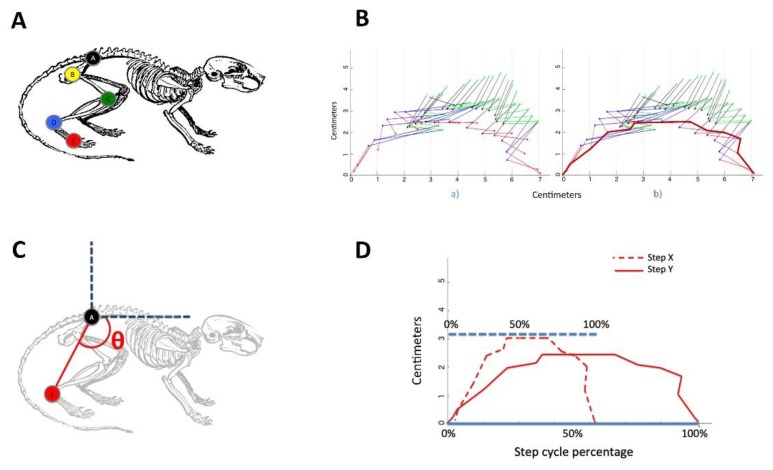
Figure 1.
Method to evaluate different kinematic locomotion parametres. (A) Selected hindlimb joints for locomotion pattern analysis. Control, chronic and acute mice were marked at five points on the left and right hindlimbs using a nontoxic marker. (B) The different color lines illustrated different lines segments between two market points. (a) An example of the pattern generated by the transition phase of a mouse, and (b) the curve corresponding to the amplitude of point E across time. (C) Depiction of the measured angle employed for the hindlimb pendulum-like movement analysis. (D) Depiction of two normalized curve patterns with respect to the step cycle.

